Estimating Annotation Cost for Active Learning
in a Multi-Annotator Environment
Shilpa Arora, Eric Nyberg and Carolyn P. Ros´e Language Technologies Institute
Carnegie Mellon University Pittsburgh, PA 15213, USA
{shilpaa,ehn,cprose}@cs.cmu.edu
Abstract
We present an empirical investigation of the annotation cost estimation task for active learning in a multi-annotator environment. We present our analysis from two perspectives: selecting examples to be presented to the user for annotation; and evaluating selective sam-pling strategies when actual annotation cost is not available. We present our results on a movie review classification task with rationale annotations. We demonstrate that a combina-tion of instance, annotator and annotacombina-tion task characteristics are important for developing an accurate estimator, and argue that both corre-lation coefficient and root mean square error should be used for evaluating annotation cost estimators.
1 Introduction
Active Learning is the process of selectively query-ing the user to annotate examples with the goal of minimizing the total annotation cost. Annota-tion cost has been tradiAnnota-tionally measured in terms of the number of examples annotated, but it has been widely acknowledged that different examples may require different annotation effort (Settles et al., 2008; Ringger et al., 2008).
Ideally, we would use actual human annotation cost for evaluating selective sampling strategies, but this will require conducting several user studies, one per strategy on the same dataset. Alternatively, we may be able to simulate the real user by an annota-tion cost estimator that can then be used to evaluate several selective sampling strategies without having to run a new user study each time. An annotation cost estimator models the characteristics that can
differentiate the examples in terms of their annota-tion time. The characteristics that strongly correlate with the annotation time can be used as a criterion in selective sampling strategies to minimize the total annotation cost.
In some domains, the annotation cost of an ex-ample is known or can be calculated exactly before querying the user. For example, in biological ex-periments it might be calculable from the cost of the equipment and the material used (King et al., 2004). In NLP, sometimes a simplifying assumption is made that the annotation cost for an example can be measured in terms of its length (e.g. seconds of voicemail annotated (Kapoor et al., 2007); number of tokens annotated (Tomanek et al., 2007)). An-other assumption is that the number of user anno-tation actions can be used as a proxy for annota-tion cost of an example (e.g. number of brackets added for parsing a sentence (Hwa, 2000); number of clicks for correcting named entities (Kristjannson et al., 2004)). While these are important factors in determining the annotation cost, none of them alone can fully substitute for the actual annotation cost. For example, a short sentence with a lot of embed-ded clauses may be more costly to annotate than a longer sentence with simpler grammatical structure. Similarly, a short sentence with multiple verbs and discontinuous arguments may take more time to an-notate with semantic roles than a longer sentence with a single verb and simple subject-verb-object structure (Carreras and M´arquez, 2004).
What further complicates the estimation of tation cost is that even for the same example, anno-tation cost may vary across annotators (Settles et al., 2008). For example, non-native speakers of English were found to take longer time to annotate part of
speech tags (Ringger et al., 2008). Often multiple annotators are used for creating an annotated cor-pus to avoid annotator bias, and we may not know all our annotators beforehand. Annotation cost also depends on the user interface used for annotation (Gweon et al., 2005), and the user interface may change during an annotation task. Thus, we need a general annotation cost estimator that can predict annotation cost for a given annotator and user inter-face. A general estimator can be built by using an-notator and user interface characteristics in addition to the instance characteristics for learning an anno-tation cost model, and training on data from mul-tiple annotators and mulmul-tiple user interfaces. Such a general estimator is important for active learning research where the goal is to compare selective sam-pling strategies independent of the annotator and the user interface.
In this work, we investigate the annotation cost es-timation problem for a movie review classification task in a multi-annotator environment with a fixed user interface. We demonstrate that a combination of instance, annotation task and annotator charac-teristics is important for accurately estimating the annotation cost. In the remainder of the paper, we first present a survey of related work and an analysis of the data collected. We then describe the features used for our supervised learning approach to anno-tation cost estimation, followed by the experimental setup and results. Finally, we conclude with some future directions we would like to explore.
2 Related work
There has been some recent research effort in using supervised learning for estimating annotation cost. The most closely related work is that by Settles et al. (2008) and Ringger et al. (2008). Settles et al. (2008) present a detailed analysis of annotation cost for four NLP applications: named entity recognition, image retrieval, speculative vs. definite distinction, and in-formation extraction. They study the effect of do-main, annotator, jitter, order of examples, etc., on the annotation cost.
Results from Settles et al. (2008) are promising but leave much room for improvement. They used only instance level features such as number of en-tities, length, number of characters, percentage of
non-alpha numeric characters, etc. for annotation cost estimation. For three of their tasks, the corre-lation between the estimated and actual annotation times was in the range (R = 0.587to0.852). Note that the percentage of variance accounted for by a model is obtained by squaring theRvalue from the correlation coefficient. Thus, anR value of 0.587 indicates that only about 34% (R2) of the variance is accounted for, so the model will make incorrect predictions about ranking in the majority of cases. Nevertheless, we acknowledge that our results are not substantially better, although we argue that this work contributes to the pool of knowledge that will hopefully lead to better performance in the future.
Settles et al. (2008) train and test their estimator on data from the same annotator. Thus, in order to use their model for a new annotator, we would need to first collect data for that annotator and train a model. In our work, a group of annotators anno-tate the same text, and we train and test on different annotators. We also show that using characteristics of the annotators and annotation task in addition to the instance characteristics improves performance.
Ringger et al. (2008) use linear regression for an-notation cost estimation for Part-Of-Speech (POS) tagging. About30annotators annotated36different instances each. The authors present about 13 de-scriptive statistics of the data, annotator and annota-tion task, but in their model they only used number of tokens in the sentence and the number of correc-tions needed as features. They report that the other variables didn’t have a significant effect when eval-uated using a Bayesian Information Criterion (from the R package).
Ringger et al. (2008) noticed that nativeness of the annotator did have an effect on the annotation time, but they chose not to include that feature in their model as they expected to have a similar mix of skills and background in their target anno-tators. However, if annotation times differ substan-tially across annotators, then not accounting for this difference will reduce the performance of the model. Also, the low adjusted correlation value for their model (R = 0.181) indicates that there is only a weak correlation between the annotation time and a linear combination of the length of the example and the number of corrections.
3 Analysis and Experiments
In this section, we present our annotation methodol-ogy and analysis of the data we collected, followed by a description of the features we used.We then present our experimental setup followed by a dis-cussion of our results.
3.1 Annotation Methodology and Data Analysis
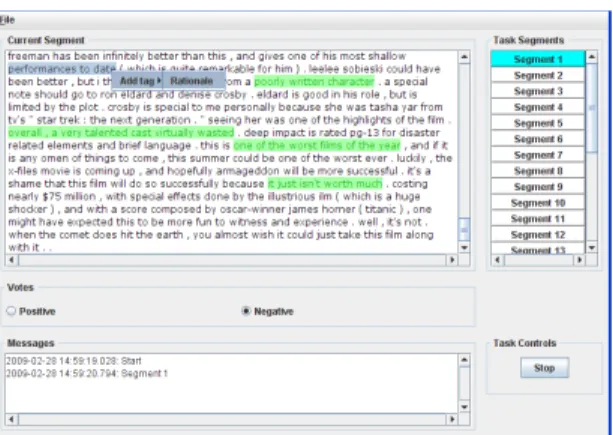
In this work, we estimate the annotation cost for a movie review classification task. The data we used were collected as part of a graduate course. Twenty annotators (students and instructors) were grouped into five groups of four each. The groups were cre-ated such that each group had similar variance in annotator characteristics such as department, educa-tional experience, programming experience, etc. We used the first 200 movie reviews from the dataset provided by Zaidan et al. (2007), with an equal dis-tribution of positive and negative examples. Each group annotated 25 movie reviews randomly se-lected from the 200 reviews and all annotators in each group annotated all 25 reviews. In addition to voting positive or negative for a review, annota-tors also annotatedrationales(Zaidan et al., 2007), spans of text in the review that support their vote. Rationales can be used to guide the model by identi-fying the most discriminant features. In related work (Arora and Nyberg, 2009), we ascertain that with ra-tionales the same performance can be achieved with less annotated data. The annotation task with ra-tionales involved a variety of user actions: voting positive or negative, highlighting spans of text and adding rationale annotations. We used the same an-notation guidelines as Zaidan et al. (2007). The data has been made available for research purposes1. Fig-ure 1 shows a screenshot of the GUI used. We per-formed an analysis of our data similar to that con-ducted by Settles et al. (2008). We address the fol-lowing main questions.
Are the annotation times variable enough? If all examples take a similar time to annotate, then the number of examples can be used as an approxima-tion for the annotaapproxima-tion cost. Figure 2 shows the his-togram of averaged annotation times (averaged over
1
www.cs.cmu.edu/˜shilpaa/datasets/ial/ ial-uee-mr-v0.1.zip
Figure 1: The GUI used for the annotation task. The user selects the review (segment) to annotate from the list in the right panel. The review text is displayed in the left panel. The user votes positive or negative using the radio buttons. Ratio-nales are added by selecting a span of text and right clicking to select the rationale tag. Thestart/stopbutton can be used to pause the current task.
Figure 2: Distribution of averaged annotation times
4annotators in a group). As can be seen from the mean (µ = 165 sec.) and the standard deviation (σ = 68.85), there is a meaningful variance in the annotation times.
How do the annotation times vary across annota-tors?A strong correlation between annotation times from different annotators on a set of instances sug-gests that there are certain characteristics of these in-stances, independent of the annotator characteristics, that can determine their ranking based on the time it takes to annotate them. We evaluated the pairwise correlation for all pairs of annotators in each group (Table 1). As can be seen, there is significant pair-wise correlation in more than half of the pairs of an-notators that differ in nativeness (10/16). However, not all such pairs of annotators are associated with significant correlation. This suggests that it is im-portant to consider both instance and annotator char-acteristics for estimating annotation time.
group Avg-Na(Std) Avg-CR(Std) #sign-pairs 0 2.25(0.96) 0.54(0.27) 4/6 (4/5) 1 1.75(0.5) 0.45(0.08) 5/6 (2/3) 2 1(0) 0.13(0.17) 0/6 (0/0) 3 1.75(0.96) 0.36(0.12) 2/6 (1/5) 4 2.75(0.5) 0.47(0.04) 6/6 (3/3) Avg. 1.9(0.58) 0.39(0.21) 17/30 (10/16) Table 1: The Table shows the average nativeness and average pairwise correlation between annotation times for the mem-bers of each group (and their standard deviation). #sign-pairs shows the fraction of pairwise correlations within the groups that were significant (p < 0.05). In brackets, is the fraction of correlations between annotators with different nativeness within the groups that were significant.
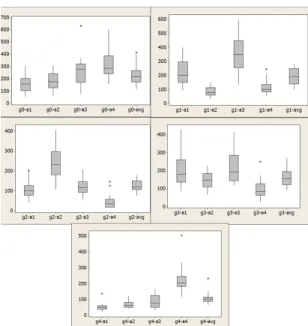
The box plot in Figure 3 shows the distribution of annotation times across annotators. As can be seen, some annotators take in general much longer than others, and the distribution of times is very dif-ferent across annotators. For some, the annotation times vary a lot, but not so much for others. This suggests that using annotator characteristics as fea-tures in addition to the instance characteristics may be important for learning a better estimator.
Figure 3: Box plot shows the annotation time (in sec) dis-tribution (y-axis) for an annotator (x-axis) for a set of25 doc-uments. g0-a1represents annotator1of group0andg0-avg
represents the average annotation time. A box represents the middle50%of annotation times, with the line representing the median. Whiskers on either side span the1stand4thquartiles and asterisks indicate the outliers.
3.2 Feature Design
We group the features in the following three cat-egories: Instance, Annotation Task and Annotator
characteristics.
3.2.1 Instance characteristics
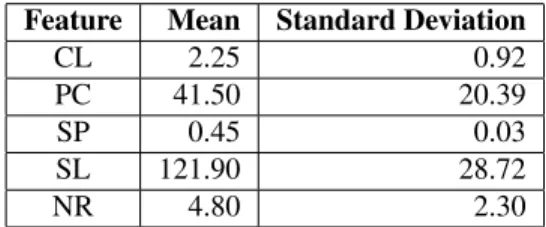
Instance characteristics capture the properties of the example the user annotates. Table 2 describes the instance based features we used and the intu-ition supporting their use for annotation cost esti-mation. Table 3 shows the mean and standard de-viation of each of these characteristics, and as can be seen, these characteristics do vary across exam-ples and hence these features can be beneficial for distinguishing examples.
3.2.2 Annotation Task characteristics
Annotation task characteristics are those that can be captured only during or after the annotation task. We used the number of rationales as a feature from this category. In addition to voting for movie re-views as positive or negative, the user also adds ra-tionales that support their vote. More rara-tionales im-ply more work since the user must look for the rele-vant span of text and perform the physical action of selecting the span and adding an annotation for each rationale. Table 3 shows the distribution of the aver-age Number of Rationales (NR) per example (aver-aged over the four annotators for a given set). 3.2.3 Annotator characteristics
The annotation cost of an example may vary across annotators. As reported in Table 1, the aver-age correlation for annotators on the same document is low (R= 0.39) with17out of30pairwise correla-tions being significant. Thus, it is important to con-sider annotator characteristics, such as whether the annotator is a native speaker of English, their educa-tion level, reading ability, etc. In this work, we only use nativeness of the annotator as a feature and plan to explore other characteristics in the future. We as-signed each annotator a nativeness value. A value of3was given to an annotator whose first language is English. A value of2was given to an annotator who has a different first language but has either been educated in English or has been in the United States for a long time. A value of1was assigned to the re-maining annotators. Among the20annotators in the study, there were8annotators with nativeness value of1, and 6 each for nativeness values of 2 and 3. Table 1 shows the average and standard deviation of the nativeness score in each group.
Feature Definition Intuition Character Length (CL) Length of review in terms of number of characters Longer documents take longer to anno-tate
Polar word Count (PC)
Number of words that are polar (strong subjective words from the lexicon (Wilson et al., 2005))
More subjectivity implies user would need more time to judge positive vs. negative
Stop word Percent (SC)
Percentage of words that are stop words
A high percentage of stop words im-plies that the text is not very complex and hence easier to read. Avg.
Sen-tence Length (SL)
Average of the char-acter length of sen-tences in the review
Long sentences in a review may make it harder to read. Table 2: Instance characteristics Feature Mean Standard Deviation
CL 2.25 0.92
PC 41.50 20.39
SP 0.45 0.03
SL 121.90 28.72
NR 4.80 2.30
Table 3:Mean and the standard deviation for the feature oc-currences in the data.
3.3 Evaluation Metric
We use both Root Mean Square (RMS) error and Correlation Coefficient (CRCoef) to evaluate our model, since the two metrics evaluate different as-pects of an estimate. RMS is a way to quantify the amount by which an estimator differs from the true value of the quantity being estimated. It tells us how ‘off’ our estimate is from the truth. CRCoef on the other hand measures the strength and direction of a linear relationship between two random variables. It tells us how well correlated our estimate is with the actual annotation time. Thus, for evaluating how ac-curate our model is in predicting annotation times, RMS is a more appropriate metric. For evaluating the utility of the estimated annotation cost as a cri-terion for ranking and selecting examples for user’s annotation, CRCoef is a better metric.
3.4 Experiments & Results
We learn an annotation cost estimator using the Lin-ear Regression and SMO Regression (Smola and Scholkopf, 1998) learners from the Weka machine learning toolkit (Witten and Frank, 2005). As
men-tioned earlier, we have5sets of25documents each, and each set was annotated by four annotators. The results reported are averaged over five folds, where each set is one fold, and two algorithms (Linear Re-gression and SMO ReRe-gression). Varying the algo-rithm helps us find the most predictive feature com-binations across different algorithms. Since each set was annotated by different annotators, we never train and test on the data from same annotators. We used the JMP2and Minitab3statistical tools for our analy-sis. We used an ANOVA model with Standard Least Squares fitting to compare the different experimen-tal conditions. We make all comparisons in terms of both the CRCoef and the RMS metrics. For sig-nificance results reported, we used 2-tailed paired T-test, considering (p <0.05) as significant.
We present our results and analysis in three parts. We first compare the four instance characteristics, annotator and annotation task characteristics; and their combination. We then present an analysis of the interaction between features and annotation time. Finally, we compare the ranking of features based on the two evaluation metrics we used. 3.4.1 Comparing characteristics for annotation
cost estimation
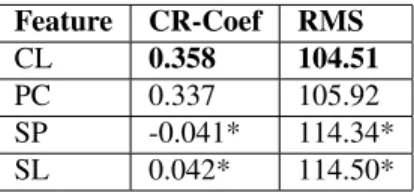
Instance Characteristics: We compare the four instance characteristics described in Section 3.2.1 and select the most predictive characteristic for fur-ther analysis with annotator and annotation task characteristics. As can be seen in Table 4, character length performs the best, and it is significantly better than stop word percent and average sentence length. Character length also outperforms polar word count, but this difference is not significant. Because of the large significant difference between the performance of stop word percent and average sentence length, compared to character length, we do not consider them for further analysis.
Feature Combinations: In Table 5, we compare the feature combinations of instance, annotator and annotation task characteristics. The table also shows the weights for the features used and the constant for the linear regression model trained on all the data. A missing weight for a feature indicates that it wasn’t used in that feature combination.
2http://www.jmp.com/software/ 3
Feature CR-Coef RMS
CL 0.358 104.51
PC 0.337 105.92
SP -0.041* 114.34*
SL 0.042* 114.50*
Table 4: CR-Coef and RMS results for Character Length (CL), Polar word Count (PC), Stop word Percent (SP) and av-erage Sentence Length (SL). Best performance is highlighted in bold.∗marks the results significantly worse than the best.
We use only the best performing instance charac-teristic, the character length. The length of an ex-ample has often been substituted for the annotation cost (Kapoor et al., 2007; Tomanek et al., 2007). We show in Table 5 that certain feature combina-tions significantly outperform character length. The combination of all three features (last row) performs the best for both CRCoef and RMS, and this result is significantly better than the character length (third row). The combination of number of rationales and nativeness (fourth row) also outperforms character length significantly in CRCoef. This suggests that the number of rationales we expect or require in a re-view and the annotator characteristics are important factors for annotation cost estimation and should be considered in addition to the character length.
CL NR AN Const. CR-Coef RMS -29.33 220.77 0.135∗ 123.93∗ 17.59 82.81 0.486 95.29 0.027 61.53 0.357∗ 104.51∗ 19.11 -40.78 153.21 0.55+ 96.04 0.028 32.79 120.18 0.397∗ 109.85∗ 0.02 15.15 17.57 0.553+ 90.27+ 0.021 16.64 -41.84 88.09 0.626+ 88.44+
Table 5: CR-Coef and RMS results for seven feature com-binations of Character Length (CL), Number of Rationales (NR) and Annotator Nativeness (AN). The values in feature and ‘Const.’ columns are weights and constant for the linear regression model trained on all the data. The numbers in bold are the results for the best feature combination. ∗marks the results significantly worse than the best. + marks the results significantly better than CL.
The impact of the nativeness feature is somewhat mixed. Adding the nativeness feature always im-proves the correlation and for RMS, it helps when added to the combined feature (CL+NR) but not oth-erwise. Although this improvement with addition of the nativeness feature is not significant, it does suggest that annotator characteristics might be im-portant to consider. To investigate this further, we
evaluated our assumption that native speakers take less time to annotate. For each set, we compared the average annotation times (averaged over examples) against the nativeness values. For all sets, annotators with nativeness value of3always took less time on average than those with nativeness value of2 or1. Between2and1, there were no reliable differences. Sometimes annotators with value of1took less time than annotators with value of2. Also, for group 2
which had all annotators with nativeness value of1, we observed a poor correlation between annotators (Table 1). This suggest two things: 1) our assign-ment of nativeness value may not be accurate and we need other ways of quantifying nativeness, 2) there are other annotator characteristics we should take into consideration.
PC CL NR AN Const. CR RMS 0.027 61.53 0.358ab 104.5x 2.2 74.20 0.337a 105.9x 0.7 0.019 60.89 0.355b 104.9x 0.028 -32.8 120.2 0.397ab 109.8x 2.3 -35.5 135.1 0.382a 111.1x 1.1 0.016 -34.3 121.8 0.395b 109.9x 0.02 15.1 17.57 0.553a 90.27x 1.5 15.1 32.02 0.542a 91.65x 0.0 0.02 15.1 17.57 0.554a 90.40x 0.021 16.6 -41.8 88.09 0.626a 88.44x 1.6 16.5 -43.5 102.8 0.614a 90.42y 0.0 0.021 16.6 -41.8 88.09 0.626a 88.78x Table 6: Each block of 3 rows in this table compares the performance of Character Length (CL) and Polar word Count (PC) in combination with Number of Rationales (NR) and An-notator Nativeness (AN) features. The values in feature and ‘Const.’ columns are weights and constant for the linear re-gression model trained on all the data. Best performance is highlighted in bold. Results in a block not connected by same letter are significantly different.
Polar word Count and Character Length: As we saw in Table 4, the difference between character length and polar word count is not significant. We further compare these two instance characteristics in the presence of the annotator and annotation task characteristics. Our goal is to ascertain whether character length performs better than polar word count, or vice versa, and whether this difference is significant. We also evaluate whether using both performs better than using any one of them alone. The results presented in Table 6 help us answer these questions. For all feature combinations character length, with and without polar word count, performs
better than polar word count, but this difference is not significant except in three cases. These results suggests that polar word count can be used as an al-ternative to character length in annotation cost esti-mation.
3.4.2 Interaction between Features and Annotation Time
As a post-experiment analysis, we studied the interaction between the features we used and an-notation time, and the interaction among features themselves. Table 7 reports the pairwise correlation (Pearson, 1895) for these variables, calculated over all 125 reviews. As can be seen, all features have significant correlation with annotation time except stop words percentage and average sentence length. Note that number of rationales has higher correla-tion with annotacorrela-tion time (R = 0.529) than charac-ter length (R = 0.417). This suggests that number of rationales may have more influence than charac-ter length on annotation time, and a low correlation between number of rationales and character length (R = 0.238) indicates that it might not be the case that longer documents necessarily contain more ra-tionales. Annotating rationales requires cognitive effort of identifying the right span and manual ef-fort to highlight and add an annotation, and hence more rationales implies more annotation time. We also found some examples in our data where docu-ments with substantially different lengths but same number of rationales took a similar time to anno-tate. One possible explanation for this observation is user’s annotation strategy. If the annotator chooses to skim through the remaining text when enough ra-tionales are found, two examples with same number of rationales but different lengths might take similar time. We plan to investigate the effect of annotator’s strategy on annotation time in the future.
A negative correlation of nativeness with annota-tion time (R = −0.219) is expected, since native speakers (AN = 3) are expected to take less anno-tation time than non-native speakers (AN ={2,1}), although this correlation is low. A low correla-tion between number of racorrela-tionales and nativeness (R = 0.149) suggests that number of rationales a user adds may not be influenced much by their nativeness value. A not significant low correlation (R = −0.06) between character length and
native-AT CL NR AN PC SP SL AT 1 CL 0.42 1 NR 0.53 0.24 1 AN -0.22 0.06 0.15 1 PC 0.4 0.89 0.28 0.11 1 SP 0.03 0.06 0.14 0.03 0.04 1 SL 0.08 0.15 0.01 -0.01 0.14 -0.13 1 Table 7: Correlation between Character Length (CL), Num-ber of Rationales (NR), Annotator Nativeness (AN), Polar word Count (PC), Stop word Percent (SP), average Sentence Length (SL) and Annotation Time (AT), calculated over all documents (125) and all annotators (20). Significant corre-lations are highlighted in bold.
ness provides no evidence that reviews with different lengths were distributed non-uniformly across anno-tators with different nativeness.
The number of polar words in a document has a similar correlation with annotation time as character length (R = 0.4). There is also a strong correla-tion between character length and polar word count (R = 0.89). Since reviews are essentially people’s opinions, we can expect longer documents to have more polar words. This also explains why there is no significant difference in performance for polar word count and character length (Table 4). A more useful feature may be the information about the number of positive and negative polar words in a review, since a review with both positive and negative opinions can be difficult to classify as positive or negative. We plan to explore these variations of the polar word feature in the future. We also plan to investigate how we can exploit this dependence between characteris-tics for annotation cost estimation.
3.4.3 CRCoef Vs. RMS
We presented our results using correlation coef-ficient and root mean squared error metrics. Ta-ble 8 shows the ranking of the feature combinations from better to worse for both these metrics and as we can see, there is a difference in the order of fea-ture combinations for the two metrics. Also, signif-icance results differ in some cases for the two met-rics. These differences suggest that features which correlate well with the annotation times (higher CR-Coef rank) can give an accurate ranking of examples based on their annotation cost, but they may not be as accurate in their absolute estimate for simulating annotators and thus might have a lower RMS rank. Thus, it is important to evaluate the user effort
esti-mator in terms of both these metrics so that the right estimator can be chosen for a given objective.
Rank CR-Coef RMS 1 (CL+NR+AN) (CL+NR+AN) 2 (CL+NR) (CL+NR) 3 (NR+AN) (NR) 4 (NR) (NR+AN) 5 (CL+AN) (CL) 6 (CL) (CL+AN) 7 (AN) (AN)
Table 8:Ranking of feature combinations. 4 Towards a General Annotation Cost
Estimator
Our multi-annotator environment allows us to train and test on data from different annotators by using annotator characteristics as features in the annota-tion cost estimaannota-tion. A model trained on data from a variety of annotators can be used for recommend-ing examples to annotators not represented in our training data but with similar characteristics. This is important since we may not always know all our annotators before building the model, and training an estimator for each new annotator is costly. Also, in active learning research, the goal is to evaluate selective sampling approaches independently of the annotator. Choosing annotators for supervised an-notation cost estimation such that the within group variance in annotator characteristics is high will give us a more generic estimator and a stricter evaluation criterion. Thus, we have a framework that has the potential to be used to build a user-independent an-notation cost estimator for a given task.
However, this framework is specific to the User Interface (UI) used. A change in the user interface might require recollecting the data from all the an-notators and training a model on the new data. For example, if annotating rationales was made signif-icantly faster in a new UI design, it would have a major impact on annotation cost. An alternative would be to incorporate UI features in our model and train it on several different UIs or modifications of the same UI, which will allow us to use our trained model with a new user interface or modifications of the existing UIs, without having to recollect the data and retrain the model. A few UI features that can be used in our context are: adding a rationale
annota-tion, voting positive or negative, etc. The units for expressing these features will be the low-level user interface actions such as number of clicks, mouse drags, etc. For example, in our task, adding a ra-tionale annotation requires one mouse drag and two clicks, and adding a vote requires one click. In a dif-ferent user interface, adding a rationale annotation might require just one mouse drag.
Using UI features raises a question of whether they can replace the annotation task features; e.g., whether the UI feature for adding rationale anno-tation can replace the number of rationales feature. Our hypothesis is that number of rationales has more influence on annotation time than just the manual ef-fort of annotating them. It also requires the cognitive effort of finding the rationale, deciding its span, etc. We aim to explore incorporating UI features in our annotation cost estimation model in the future.
5 Conclusion and Future Work
In this work we presented a detailed investigation of annotation cost estimation for active learning with multiple annotators. We motivated the task from two perspectives: selecting examples to minimize anno-tation cost and simulating annotators for evaluating active learning approaches. We defined three cate-gories of features based on instance, annotation task and annotator characteristics. Our results show that using a combination of features from all three cate-gories performs better than any one of them alone. Our analysis was limited to a small dataset. In the future, we plan to collect a larger dataset for this task and explore more features from each feature group.
With the multi-annotator annotation cost estima-tor proposed, we also motivated the need for a gen-eral estimator that can be used with new annotators or user interfaces without having to retrain. We aim to explore this direction in the future by extending our model to incorporate user interface features. We also plan to use the annotation cost model we devel-oped in an active learning experiment.
Acknowledgments
We would like to thank Hideki Shima for his help with the task setup and Jing Yang for helpful discus-sions. We would also like to thank all the anony-mous reviewers for their helpful comments.
References
Shilpa Arora and Eric Nyberg. 2009. Interactive An-notation Learning with Indirect Feature Voting. In Proceedings of NAACL-HLT 2009 (Student Research Workshop).
Xavier Carreras and Llu`ıs M´arquez. 2004. Intro-duction to the CoNLL-2004 Shared Task: Seman-tic Role Labeling. http://www.lsi.upc.edu/ ˜srlconll/st04/st04.html.
Gahgene Gweon, Carolyn Penstein Ros’e, Joerg Wittwer and Matthias Nueckles. 2005. Supporting Efficient and Reliable Content Analysis Using Automatic Text Processing Technology. In proceedings of INTER-ACT 2005: 1112-1115.
Robbie A. Haertel, Kevin D. Seppi, Eric K. Ringger and Janes L. Cattoll. 2008. Return on Investment for Ac-tive Learning. In proceedings of NIPS Workshop on Cost Sensitive Learning.
Rebecca Hwa. 2000. Sample Selection for Statistical Grammar Induction. In proceedings of joint SIGDAT conference on Empirical Methods in NLP and Very Large Corpora.
Ashish Kapoor, Eric Horvitz and Sumit Basu. 2007. Se-lective supervision:Guiding supervised learning with decision-theoretic active learning. In proceedings of IJCAI, pages 877-882.
Ross D. King, Kenneth E. Whelan, Ffion M. Jones, Philip G. K. Reiser, Christopher H. Bryant, Stephen H. Mug-gleton, Douglas B. Kell and Stephen G. Oliver. 2004.
Functional Genomics hypothesis generation and ex-perimentation by a robot scientist. In proceedings of Nature, 427(6971):247-52.
Trausti Kristjansson, Aron Culotta, Paul Viola and An-drew Mccallum. 2004. Interactive Information Ex-traction with Constrained Conditional Random Fields. In proceedings of AAAI.
Karl Pearson. 1895. Correlation Coefficient. Royal So-ciety Proceedings, 58, 214.
Eric Ringger, Marc Carmen, Robbie Haertel, Kevin Seppi, Deryle Lonsdale, Peter McClanahan, Janes L. Cattoll and Noel Ellison. 2008. Assessing the Costs of Machine-Assisted Corpus Annotation through a User Study. In proceedings of LREC.
Burr Settles, Mark Craven and Lewis Friedland. 2008.
Active Learning with Real Annotation Costs. In pro-ceedings of NIPS Workshop on Cost Sensitive Learn-ing.
Alex J. Smola and Bernhard Scholkopf 1998. A Tutorial on Support Vector Regression. NeuroCOLT2 Techni-cal Report Series - NC2-TR-1998-030.
Katrin Tomanek, Joachim Wermter and Udo Hahn. 2007.
An approach to text corpus construction which cuts an-notation costs and maintains reusability of annotated
data. In proceedings of EMNLP-CoNLL, pp. 486-495.
Theresa Wilson, Janyce Wiebe and Paul Hoffmann. 2005. Recognizing Contextual Polarity in Phrase-Level Sentiment Analysis. In proceedings of HLT/EMNLP, Vancouver, Canada.
Ian H. Witten and Eibe Frank. 2005.Data Mining: Prac-tical machine learning tools and techniques. 2nd Edi-tion, Morgan Kaufmann, San Francisco.
Omar Zaidan, Jason Eisner and Christine Piatko. 2007.
Using ”annotator rationales” to improve machine learning for text categorization. In Proceedings of NAACL-HLT, pp. 260-267, Rochester, NY.