Spiking Irregularity and Frequency
Modulate the Behavioral Report
of Single-Neuron Stimulation
Guy Doron,1Moritz von Heimendahl,1Peter Schlattmann,3Arthur R. Houweling,2and Michael Brecht1,* 1Bernstein Center for Computational Neuroscience, Humboldt University of Berlin, Berlin 10115, Germany
2Department of Neuroscience, Erasmus Medical Center, 3015 GE Rotterdam, the Netherlands
3Institute of Medical Statistics, Computer Sciences and Documentation, Friedrich Schiller University of Jena, Jena 07737, Germany
*Correspondence:[email protected] http://dx.doi.org/10.1016/j.neuron.2013.11.032
SUMMARY
The action potential activity of single cortical neurons
can evoke measurable sensory effects, but it is not
known how spiking parameters and neuronal
sub-types affect the evoked sensations. Here, we
exam-ined the effects of spike train irregularity, spike
frequency, and spike number on the detectability of
single-neuron stimulation in rat somatosensory
cor-tex. For regular-spiking, putative excitatory neurons,
detectability increased with spike train irregularity
and decreasing spike frequencies but was not
affected by spike number. Stimulation of single,
fast-spiking, putative inhibitory neurons led to a
larger sensory effect compared to regular-spiking
neurons, and the effect size depended only on spike
irregularity. An ideal-observer analysis suggests
that, under our experimental conditions, rats were
using integration windows of a few hundred
millisec-onds or more. Our data imply that the behaving
animal is sensitive to single neurons’ spikes and
even to their temporal patterning.
INTRODUCTION
A fundamental goal of neuroscience is to elucidate the link between neural activity and sensation. The first recordings of action potentials in nerve cells already suggested strong corre-lations between neural activity and sensations (Adrian, 1919). Because extracellular recording of neuronal activity is a correla-tional technique, establishing causal links between neural activity and sensation proved to be difficult. Intracortical micro-stimulation was, until recently, the only method that enabled activation of localized populations of neurons and directly influ-encing sensory perception (Afraz et al., 2006; Romo et al., 1998; Salzman et al., 1990). Based on evidence from microsti-mulation, it has been suggested that a spike count code (‘‘rate coding’’) in quickly adapting neurons may account for percep-tual discrimination in the primary somatosensory cortex of pri-mates (Luna et al., 2005). However, there is also evidence for
temporal coding in the rat barrel cortex (Panzeri et al., 2001, 2010). Thus, it remains under debate whether sensory informa-tion is encoded using a rate code (Roelfsema et al., 2004; Shadlen and Newsome, 1994) or a temporal code (deCharms and Merzenich, 1996; Engel et al., 2001; Softky and Koch, 1993).
In recent years, substantial advances have been made toward directly linking single-cell activity to sensation. The interest in the meaning of single-cell activity has been ignited by converging evidence from several experimental approaches, which sug-gested that neural activity is more sparse than previously thought (Greenberg et al., 2008; Hahnloser et al., 2002; Huber et al., 2008; Olshausen and Field, 2004; Wolfe et al., 2010). Following the pioneering work ofVallbo and colleagues (1984), a number of studies have demonstrated effects of single-cell stimulation of excitatory neurons in the intact animal on move-ment (Brecht et al., 2004; Herfst and Brecht, 2008), sensation (Houweling and Brecht, 2008), and brain state (Li et al., 2009), as well as effects of single-cell stimulation of excitatory or inhib-itory neurons on network dynamics (Bonifazi et al., 2009; Kwan and Dan, 2012; Papadopoulou et al., 2011).
It is still unclear, however, how these effects depend on cell type and the precise discharge pattern. In a previous study, we used nanostimulation, a technique that allows in vivo manipula-tion of spiking activity and identificamanipula-tion of individual neurons (Houweling et al., 2010), to provide evidence that individual neu-rons in the rat barrel cortex can have an impact on behavioral re-sponses in a detection task (Houweling and Brecht, 2008). Here, we applied the same technique to investigate if the behavioral report of single-cell stimulation varies with temporal pattern or rate of evoked spikes and the type of stimulated neuron (excit-atory versus inhibitory).
RESULTS
In order to assess the influence of spike train parameters and cell type on the detectability of nanostimulation, we trained rats on a single-cell stimulation task. For this, animals first learned to report microstimulation (40 cathodal pulses at 200 Hz, 0.3 ms pulse duration) applied to the barrel cortex. Tongue licks were rewarded with a drop of sweetened water and counted as a response if a lick occurred within 100– 1,200 ms from stimulus onset. When the animals had reached
their minimal detection thresholds (2–5 mA) after 8.1 ± 2.1 (mean ± SD) days of training, we introduced additional trials in which we used nanostimulation to induce spike firing in single cells from all cortical layers. Several different versions of single-cell stimulation experiments were performed in which 100, 200, 400, and/or 800 ms nanostimulation currents, de-pending on the type of experiment, were injected into a neuron through a glass pipette. All types of single-cell stimulation ex-periments included catch trials without current injection, which allowed us to estimate false-alarm rates.
Fast-Spiking Neurons Are More Detectable Than Regular-Spiking Neurons
To find out whether the sensory effects of single-cell stimulation were different for inhibitory and excitatory cells, we first classi-fied our data set into fast-spiking (FS) neurons, which are puta-tive inhibitory neurons, and regular-spiking (RS) neurons, which are putative excitatory neurons. The inclusion criteria were based on the evoked spiking pattern as illustrated in Figures 1A and 1B. Cells were classified as FS if at least 50 spikes were evoked during 200 ms current injections or if the spike width was no greater than 0.4 ms (Houweling and Brecht, 2008). We verified some of the classifications by recovering and reconstructing RS (Figure 1C) and FS (Figure 1D) cells. In 11 of 11 recovered cells, the criteria correctly predicted excit-atory (spiny, pyramidal, n = 9) and inhibitory (nonspiny, n = 2) neuron morphologies.
To measure the effect of single-cell stimulation, we com-pared the behavioral responses in single-cell stimulation trials (200 ms current steps) to catch trials without current injection. We combined all data of our current experiments that contained 200-ms-duration nanostimulation trials and those of a previ-ously published study (Houweling and Brecht, 2008) (seeTable S1 available online). Testing the prediction that single-neuron stimulation leads to responses revealed a small but statistically significant increase in response rates due to nanostimulation of RS neurons (Figure 1E; average increase, 1.5 percentage points; p = 0.04, one-sided t test). It is interesting that single-cell stimulation of FS neurons led to much larger sensory effects (Figure 1F; average increase, 7.0 percentage points; p = 0.004).
In different types of single-cell stimulation experiments, we varied pulse duration and amplitude to elicit a desired number and frequency of spikes. In frequency experiments, the spike rate was varied while keeping the number of spikes fixed within a single experiment with one cell; in number experiments, the number of spikes was varied while the frequency was maintained fixed. Last, in irregularity experiments, we applied fluctuating current injections versus constant current pulses to manipulate the regularity of spike trains.
In order to study the dependence of nanostimulation’s behav-ioral effect on spiking parameters and appropriately take into
0 50 100 0 50 100 False Positives [%] Hits [%] 0 50 100 0 50 100 False Positives [%] 3 10 30 100 300 0 0.5 1
RS
FS
Stim.Frequency [Hz] Response Probability B A C L5b L2/3 L1 L5a L4 L6 L5b L2/3 L1 L5a L4 L6 F E G200
µm
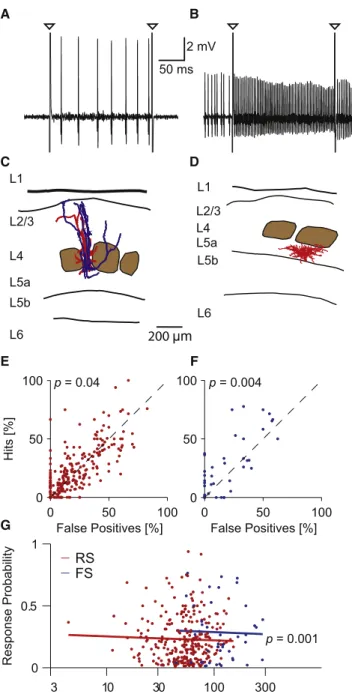
D p = 0.001 2 mV 50 ms p = 0.04 p = 0.004Figure 1. Stimulation Has Stronger Sensory Effect for FS than for RS Neurons
(A) Single-cell stimulation example trace of an RS, putative excitatory neuron. Triangles indicate stimulation onset and offset artifacts.
(B) Same as in (A) but for an FS, putative interneuron.
(C and D) Reconstructions of the dendritic (red) and axonal (blue) morphology of cells recorded during single-cell stimulation experiments. The morphology confirms our classification. (C) shows the putative excitatory cell from (A), a layer 4 pyramidal neuron; (D) shows the putative inhibitory cell from (B), a layer 5 interneuron. Brown blobs indicate layer 4 barrels. L, layer.
(E) Response rates (hits) for trials with single-cell stimulation versus catch trials (false-positives) of RS neurons (n = 270; note several points coincide). On average, hit rates were higher than catch rates (p = 0.04, one-sided paired t test).
(F) Same as in (E) but for FS neurons (n = 43 neurons); on average, hit rates were higher than catch rates (p = 0.004, one-sided paired t test).
(G) Adjusted response rates (seeExperimental Procedures) of RS and FS
neurons as a function of stimulation (Stim.) frequency. Each dot is a cell, and the lines show the regression fits (using cell type and frequency). The effect of cell type is significant (FS > RS, p = 0.001; regression against cell type and frequency; unified data set).
account their complexity and correlations, we developed a statistical model of the animal’s response to nanostimulation, which is described in detail in the Experimental Procedures. Briefly, we regressed the response probability (calculated across nanostimulation trials; seeExperimental Procedures) against the manipulated spike train statistics (i.e., spike number, frequency, and irregularity). In addition, we used the catch rate (namely, the response rate during nonstimulation trials) and the cell type as further regressors. While the catch rate was always included in the model, different subsets of spike number, frequency, and irregularity, as well as cell type were used as regressors, de-pending on the question. The model also contains so-called random effects to account for possible rat and within-cell correlations (seeExperimental Procedures).
First, we investigated the influence of cell type on single-neuron detectability. We applied the regression model to a unified data set including the irregularity, frequency, and num-ber experiments presented earlier, as well as data from a previously published study (Houweling and Brecht, 2008) (see Table S1) and confirmed that nanostimulation had a signifi-cantly stronger impact on response probability in FS compared to RS neurons (p = 0.001, regression against cell type). This re-mained true, excluding the previous Houweling data (p = 0.01). Given that the two cell types had, by definition, different firing rates, which might influence the efficacy of nanostimulation,
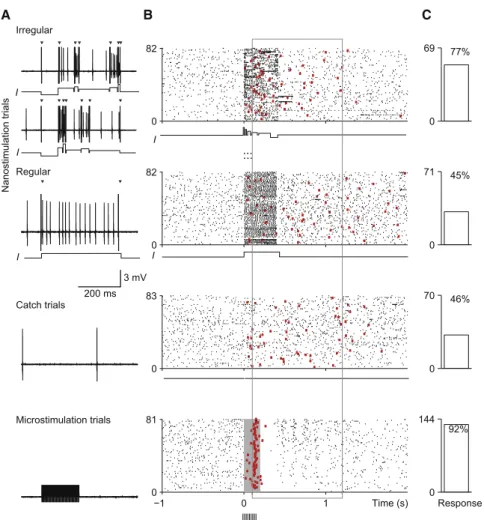
0 82 0 69 77% 0 82 0 71 45% 0 83 0 70 46% −1 0 1 0 81 0 144 92% Nanostimulation trials Time (s) Response I Regular Irregular C B I I I 3 mV 200 ms ... ... A I Catch trials Microstimulation trials
Figure 2. Behavioral Responses to Irregular and Regular Spike Trains in an RS Neuron (A) Recordings of a putative excitatory neuron during trials with, from top to bottom, randomized fluctuating current injection (two sample traces, 18 ± 6 spikes), regular nanostimulation trials with a single current step (13 ± 6 spikes), catch
trials without current injection, and
micro-stimulation trials (micro-stimulation current, 4mA).
Tri-angles indicate stimulation onset and offset artifacts. In the microstimulation trace, artifacts were partially clipped.
(B) Action potential (ticks) raster plots and first lick responses (red squares) for the different stimula-tion condistimula-tions. Only 81/144 microstimulastimula-tion trials are shown. The neuron was inhibited shortly after microstimulation. No activity is shown during microstimulation (gray area), because it could not be measured.
(C) Response rate for each stimulation condition.
we repeated the test controlling for fre-quency (Figure 1G). The effect of cell type was still significant (p = 0.001, regression against cell type and fre-quency). We conclude that the sensory difference between RS and FS neurons does not come about because we induced the FS neurons to fire at higher rates but that it results from a greater detectability of FS neurons’ spikes under our conditions. This suggests that ferent cell types have fundamentally dif-ferent effects on downstream neuronal populations; therefore, all further analysis was done separately for RS and FS neurons.
Single-Neuron Detectability Increases with Spike Irregularity
In our previous work, we used simple DC current steps that typi-cally resulted in regular spike discharge patterns (Houweling and Brecht, 2008). The average bias toward responding under these conditions was small. Since natural spiking patterns in the cortex are highly irregular and contain bursts (Connors and Gutnick, 1990; Gray and McCormick, 1996), we examined if introducing irregularity in the evoked spike trains increased the animal’s re-sponses (Figure 2).
To this end, we stimulated neurons in the barrel cortex using a fluctuating nanostimulation current injection consisting of a sequence of current steps with a total duration of 400 ms. The in-dividual current steps had different intensities and durations and were presented in random order (seeFigure 2A;Experimental Procedures), which resulted in spike trains much more irregular than for single current steps; therefore, these experiments were called irregularity experiments. As a control, we also included a regular condition where a regular spike train was induced by a single 400 ms current step (Figure 2A, ‘‘Regular’’). Figure 2 shows a typical irregularity experiment with an RS neuron. It comprises trials in four different stimulation
conditions: irregular nanostimulation, regular nanostimulation, no stimulation, and microstimulation (Figures 2A–2C, from top to bottom).
Spike train irregularity was quantified using the coefficient of variation (CV, defined as the ratio between the SD and the mean) of the interspike interval (ISI) distribution during nanosti-mulation and will be referred to here as CVISI. When stimulated
with fluctuating currents, RS neurons’ spike trains had a CVISI
of 0.95 ± 0.26, which is close to experimentally observed values for natural spike trains (Softky and Koch, 1993). In contrast, single-cell stimulation with regular current steps resulted in much lower CVISIvalues (CVISI= 0.46 ± 0.21). It is interesting
that the response rate to the irregular spike train was much higher than the response rate to the regular one (Figure 2C; p = 0.02; regression against CVISI).
To verify the effect of irregularity at the population level, we applied the regression model to all cells from the irregularity ex-periments, using CVISIas a regressor, and found a significant
positive effect in both cell types (Figures 3A and 3B; regression against CVISI). In these plots, every cell is represented by two
dots corresponding to the two nanostimulation conditions. We next asked whether the increased detectability of irregular spike trains was due to some particularly salient component of the spike train (a ‘‘motif’’) or if, instead, it was a global property of irregularity. One such simple motif is the pair of spikes that has the shortest ISI of the whole spike train, termed the shortest ISI doublet. Plotting the rat’s response latency as a function of the motif’s position within the spike train revealed a modest but significant correlation in RS neurons (correlation coefficient = 0.15, p = 0.001;Figure 3C). Thus, rats reacted sooner to the irregular stimulus when the motif was positioned earlier in the spike train. If the motif was the main determinant of the rat’s response, then the graph inFigure 3C would be expected to have a slope near 1, which was not the case. Therefore, the motif introduces a significant but small bias, arguing against a readout mechanism that relies on information in very short time windows
alone. Other motifs were also found to be significantly correlated but did not improve predictive power as measured by Pearson’s correlation coefficient (for minimum ISI triplet: correlation coeffi-cient = 0.10, p = 0.03; for most irregular triplet: correlation coef-ficient = 0.13, p = 0.007). Analysis of FS neurons revealed similar trends (for minimum ISI doublet: correlation coefficient = 0.17, p = 0.06; for minimum ISI triplet: correlation coefficient = 0.10, p = 0.3; for most irregular triplet: correlation coefficient = 0.10, p = 0.29).
We conclude that the irregularity of the induced spike train has a major effect on the detectability of single-neuron activity, both in terms of response probability and latency.
Spike Frequency, but Not Number, Modulates Detectability
Do spike frequency and number influence behavioral perfor-mance in our single-neuron stimulation detection task?
To examine the influence of the frequency of stimulation spikes, frequency experiments were conducted consisting of nanostimulation conditions that differed in their spike fre-quencies but had the same average number of spikes. This was achieved by using nanostimulation currents of lengths 100, 200, and 400 ms, with current intensities that varied inversely with the duration (seeFigures S1A–S1C for an example experiment).
Across the RS neurons recorded in frequency experiments, re-gressing for frequency revealed a negative effect of stimulation frequency on response probability (Figure 4A, p = 0.03, regres-sion against frequency).
To find out whether response latency was also affected by stimulation spike parameters, we designed a second, analogous regression model (see Experimental Procedures). Consistent with a reduced detectability at higher spike frequencies, we found that response latencies were significantly longer ( Fig-ure 4B, p = 0.001, regression against frequency).
In the same way, we tested whether the number of evoked spikes affects the animal’s response. For this, we conducted number experiments that used nanostimulation currents of lengths of 100, 200, 400, and 800 ms while keeping the current intensities constant across the durations, resulting in increasing spike numbers with similar spike frequencies (seeFigures S2A– S2C for an example experiment). In RS neurons, no significant correlation between spike number and either response rate or latency was found (Figures 4C and 4D, regression against number).
Also, in FS neurons, none of the relations examined earlier was significant (Figure S3); note, though, the small sample sizes for FS neurons (Table S1).
We conclude that, in RS neurons, the lower the spike fre-quency, the more likely was a behavioral response of the rat, and the sooner it occurred. This was not observed in FS neurons, and no effect of spike number was found in either cell type.
Irregularity Has the Largest Impact on Spiking Detectability
What was the relative impact of the spiking parameters on the rat’s behavior? Because the impact of CVISI, frequency, and
number were measured in different experiments, this might
0 1 2 0 0.5 1 CV ISI Response Prob. 0 1 2 0 0.5 1 CV ISI 0 0.2 0.4 0.4 0.6 0.8 Motif Position [s] Latency [s] p = 0.0004 p = 0.001 p = 0.001 C B A
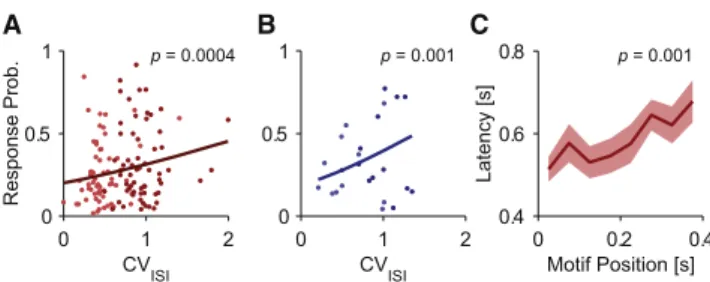
Figure 3. Effect of Irregularity on Behavioral Responses
(A) Adjusted response probability as a function of CVISIfor RS neurons
re-corded during irregularity experiments (n = 62 cells). Each dot represents a cell and a stimulation condition: bright red, regular stimulation; dark red, irregular stimulation. The regression model (line plot) shows a significant increase with
CVISI(p = 0.0004).
(B) Same as in (A) but for FS neurons (n = 12, p = 0.001). Bright blue, regular stimulation; dark blue, irregular stimulation.
(C) Response latency after RS neuron irregular stimulation as a function of the time of occurrence of the shortest ISI doublet within the spike train. Later, doublet positions are significantly correlated with delayed responses (Pear-son’s correlation coefficient = 0.15, p = 0.001). Shaded area indicates SE.
bias a comparison of their strengths. To avoid this, and also to verify the generality of the observed effects, we applied the regression model with the regressors CVISI, spike number,
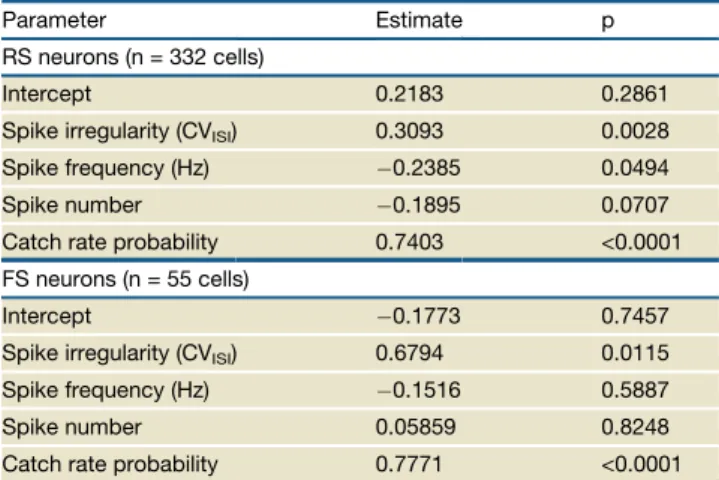
and spike frequency on the unified data set including the irregularity, frequency, and number experiments presented earlier, as well as data from a previously published study ( Houw-eling and Brecht, 2008; seeTable S1). This combined data set contained 332 RS neurons (20,129 trials) and 55 FS neurons (3,564 trials). The spiking parameters CVISI, spike number, and
frequency were calculated over the duration of the nanostimula-tion (100, 200, 400, or 800 ms), which differed between trials. Consistent with the results from the irregularity experiments (Figure 3), the regression on the unified data set showed that CVISI had a highly significant positive influence on response
probability in both cell types (Figures 5A and 5B;Table 1). Simi-larly, the negative effect of spike frequency in RS neurons ( Fig-ure 4A), but not FS neurons, was confirmed (Figures 5C and 5D;Table 1). Also, no correlation between spike number and response probability was found for either cell type (Figures 5E and 5F;Table 1).
To summarize, the analysis of the unified data set confirms the results from the separate experiments. The aforementioned find-ings suggest that CVISI has the strongest impact on the rat’s
behavior, but to assess the relative importance rigorously, we ran the regression model leaving out the regressor in question and observed the change in goodness of fit quantified by the Bayesian information criterion (BIC). Lower values indicate a better fit, and the BIC imposes a penalty for the number of
0
1
2
0
0.5
1
CV
ISIResponse Prob.
0
1
2
0
0.5
1
CV
ISI10
30
100 300
0
0.5
1
Frequency [Hz]
Response Prob.
10
30
100 300
0
0.5
1
Frequency [Hz]
1
10
100
0
0.5
1
Number of spikes
Response Prob.
1
10
100
0
0.5
1
Number of spikes
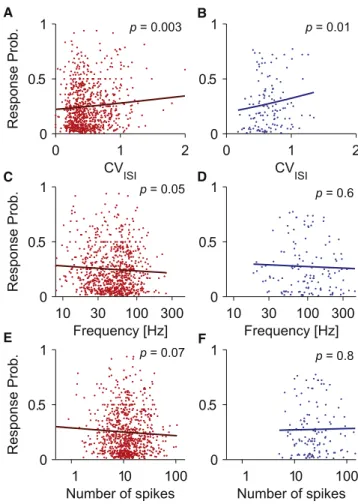
p = 0.003 p = 0.01 p = 0.05 B A D C F E p = 0.6 p = 0.07 p = 0.8Figure 5. Across-Experiments Assessment of Effects of Spiking Parameters in RS and FS Neurons
(A) Adjusted response probability as a function of CVISIfor RS neurons, cells
from unified data set (n = 332 cells). Each dot represents a cell and a nano-stimulation condition; the regression model (line plot) uses all three spiking parameters (irregularity, spike frequency, and number) as regressors and
shows a significant increase with CVISI(p = 0.003).
(B) Same as in (A) but for FS neurons (n = 55); as for RS neurons, there was a significant positive correlation (p = 0.01).
(C) Adjusted response probability as a function of spike frequency, same data set as in (A); the regression model shows a significant negative correlation (p = 0.046).
(D) Same as in (C) but for FS neurons (n = 55); unlike for RS neurons, there was no significant correlation (p = 0.6).
(E) Adjusted response probability as a function of spike number, same data set as in (A); there was no significant correlation (p = 0.07).
(F) Same as in (E) but for FS neurons (n = 55); as for RS neurons, there was no significant correlation (p = 0.8).
See alsoFigures S4andS6.
10 30 100 300 0 0.5 1 Frequency [Hz] Response Prob. 10 30 100 300 0 0.5 1 Frequency [Hz] Latency [s] 1 10 100 0 0.5 1 Number of spikes Response Prob. 1 10 100 0 0.5 1 Number of spikes Latency [s]
Effect of spike frequency
Effect of spike number
p = 0.03 B p = 0.001
A
D
C p = 0.2 p = 0.3
Figure 4. Effects of Spike Frequency and Number in RS Neurons (A) Frequency experiment: adjusted response probability as a function of nanostimulation spike frequency for RS neurons (n = 55). Each dot represents a cell and a condition. The regression model (line plot) shows a significant decrease with frequency (p = 0.03).
(B) Response latency after RS neuron stimulation as a function of frequency. Lower frequencies are significantly correlated with faster reaction times (p = 0.001)
(C and D) Same as in (A) and (B) for the number experiment (n = 156). There was no significant effect of spike number on either response probability or latency (p = 0.2 and p = 0.3, respectively).
parameters of a model, thus avoiding overfitting. Figure S4 shows that leaving out spike number decreased the BIC, indi-cating that its inclusion did not improve the model fit enough to justify the added complexity of the model. Leaving out either fre-quency or CVISIharmed the goodness of fit but much more so for
CVISI. This indicates that the model should include both CVISIand
frequency and that CVISIhas the highest predictive power on the
rat’s response probability.
From the experimenter’s point of view, spike number and fre-quency could be varied independently, and this was done in the number and frequency experiments (Figures 4,S1, andS2). It is unclear, however, how the rat perceives these stimuli. If, for example, the rat’s readout of the stimulated neuron can be described by a sliding integration window of fixed length, then number and frequency are no longer independent but propor-tional to each other. In order to account for a potential confound between spike frequency and number, we eliminated one spiking parameter at a time from the model to observe the effect on the remaining regressors. We found that removing spike num-ber increased the weight of spike frequency in RS but not in FS neurons, suggesting a possible correlation between these parameters in some of our experiments (Table S2). Also, elimi-nating spike irregularity as a regressor increased the weight of spike frequency for RS neurons, while spike number remained insignificant (Table S2), confirming the lack of an effect observed in the number experiments.
Optimal Integration Windows Match Stimulus
If the animal used a readout mechanism that can be modeled by a sliding window, then this predicts the correlation between the effects of frequency and number on the rat’s behavior, which we reported above. Another prediction from the window model is that it is impossible for the rat to measure the duration of a stimulus. Indeed, consistent with this, we did not see an effect in the number experiment, where frequency was held constant and the number varied by means of changing the duration. We therefore asked if we could estimate the optimal window’s length from our data, using data from all experiments of this study.
To find out, we looked for the time window across which an ideal observer should integrate the stimulated neuron’s activity to optimally predict the rat’s behavior. To quantify the relation-ship between the neuronal activity in a given time window and the behavioral responses, we used receiver operating character-istic (ROC) analysis. We measured the observer’s performance by the area under the ROC curve, which can be interpreted as the probability of an observer to correctly classify a positive and a negative (here: a response and a nonresponse) sample (Britten et al., 1996). Thus, a value of 0.5 indicates chance perfor-mance, while a value of 1.0 represents a perfect prediction of the behavioral response based on the neuronal activity. We used both spike rate and spike CVISIas measures of the spiking
activ-ity in the window and as classifiers for the ROC analysis. Time windows varied in length between 25 ms and 100 s and were anchored to the animal’s response time, thus applying a backward-looking analysis, with a variable delay of 0 to 200 ms between the window’s end and the response. Given that, for nonresponse trials, the response time was undefined, multiple random virtual nonresponse times within the allowed response window were chosen. Then, for each window length and position, choice probability was calculated. For each window length, we chose the window position that yielded the maximal choice probability.
When choice probabilities are calculated across the entire data set, they are expected to be above chance level only for cells where the response rate to stimulation was above the catch rate and below chance level otherwise. This leads to their effects cancelling each other out when averaging across cells. Whereas this still leads to a significantly above-chance choice probability (0.52; data not shown), we chose to restrict further analysis to the subset of cells where hit rate exceeded catch rate in order to get a better estimate of the optimal integration window.
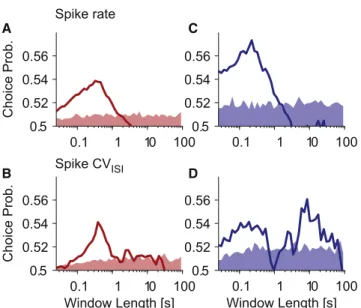
Figure 6shows choice probability as a function of window length for both cell types and classifiers. We found that, for RS neurons, increasing the window length is beneficial up to a length of around 300–400 ms, when further increase degrades choice probabilities (Figures 6A and 6B).
In FS neurons, choice probability was higher at short windows and reached a peak at windows shorter than those for RS neu-rons (100–200 ms and 300–400 ms, respectively; Figures 6C and 6D), which is consistent with a higher information rate of FS neurons due to their higher evoked firing rates (Figure 1G). Also, using the spike rate classifier, choice probability was generally higher for FS neurons compared to RS neurons, which is in line with the higher detectability of FS neuron stimulation (Figure 1G). In FS neurons, the CVISI, but not the spike rate
clas-sifier, showed another peak around 8 s. This is surprising, because this time window contains a lot of spiking activity outside of the current trial’s stimulation period and typically one or more previous trials.
To summarize, we found that the ideal time window to predict the rat’s behavior depended on the classifier used but also that RS neurons needed longer windows than FS neurons. Also, in FS neurons, we observed an unexpectedly long time window with strong predictive power of the rat’s behavior, which may relate to slow brain state fluctuations.
Table 1. Global Statistical Analysis using Logistic Regression Model
Parameter Estimate p
RS neurons (n = 332 cells)
Intercept 0.2183 0.2861
Spike irregularity (CVISI) 0.3093 0.0028
Spike frequency (Hz) 0.2385 0.0494
Spike number 0.1895 0.0707
Catch rate probability 0.7403 <0.0001 FS neurons (n = 55 cells)
Intercept 0.1773 0.7457
Spike irregularity (CVISI) 0.6794 0.0115
Spike frequency (Hz) 0.1516 0.5887
Spike number 0.05859 0.8248
Single-Cell Stimulation Detectability Depends on Brain State
The finding that rats may rely on slow modulations of many sec-onds prior to the stimulus presentation prompted us to further investigate this possibility. Given that slow-state fluctuations are typically a network rather than a single-cell phenomenon, we analyzed the local field potential (LFP) oscillations prior to the trial onset for a subset of the experiments where the LFP was available. We particularly focused on LFP power in the lower beta frequency range (12–18 Hz), which has been reported to be related to performance in tactile perception tasks ( Linkenkaer-Hansen et al., 2004; Schubert et al., 2009). We found that hits (correct responses on nanostimulation trials) were preceded by increased power in low beta compared to misses (Figure S5A; p = 0.04, two-sided paired t test); this trend was present across the entire examined range of 4–30 Hz (p = 0.2). It is interesting that, for the catch trials, the situation was reversed in that correct rejections had increased power compared to false-positives (Figure S5B), both across the whole range (p = 0.03) and in the low beta frequency (p = 0.01). This suggests that increased LFP power predicts not responding per se but correctness of the rat’s behavior. To test this, correct responses and rejections were pooled and compared to the pooled misses and false-positives. Indeed, there was a significant increase in power across the entire examined range (p = 0.002) as well as within
the low beta frequency range (p = 0.003) predicting correct behavioral choice.
DISCUSSION
In the present study, we examined how the detectability of single-cell stimulation in the rat somatosensory cortex depends on cell type and spike train parameters. Consistent with a previ-ous study (Houweling and Brecht, 2008), we found that stimula-tion of fast spiking (FS), putative inhibitory neurons is much more easily detected by the rat than stimulation of regular spiking (RS), putative excitatory neurons. Moreover, evoked spike trains with irregular spike times have a stronger sensory effect on the animal than rhythmically regular ones. Spike frequency also has an impact, in that, unexpectedly, lower frequency spike trains are, at equal number of spikes, more easily detected in RS neurons. Surprisingly, no effect of spike number at equal frequency was observed in either cell type.
Using an ideal observer model, we estimated the best integra-tion window the rat may use to base its decision on in our exper-iments, and found that, depending on cell type and coding scheme, a window of several hundred milliseconds works best. This analysis also revealed an unanticipated slow (8 s) brain state fluctuation, which has an impact on the rat’s response. This may also be reflected by an observed difference in LFP power predicting correct responses.
The implications of these findings for existing hypotheses about sensory coding in the cortex are discussed in what follows.
Neural Coding in Excitatory and Inhibitory Neurons
In order to elucidate the role of specific cell populations in single-cell stimulation, we examined the influence of spike parameters in RS and FS neurons separately. We found that stimulation of FS neurons is more detectable (Figure 1), as was suggested by some of our previous data (Houweling and Brecht, 2008).
In line with the observed powerful effect of FS activity on the rat’s behavior, interneurons have been reported to exert a strong impact on network activity. For example, a study in hippocampal slices indicated that GABAergic interneurons may function as hubs and trigger population synchronization (Bonifazi et al., 2009). Further evidence for the role of putative interneurons in synchronous activity comes from a study in the somatosensory barrel cortex of awake rabbits (Swadlow, 2003). FS neurons are highly connected via both GABAergic chemical and electrical synapses (Galarreta and Hestrin, 1999, 2002; Gibson et al., 1999), which may support their ability to orchestrate activity in neural circuits (Cardin et al., 2009).
Another possible reason for the rat’s higher sensitivity to stim-ulation of FS compared to RS neurons may lie in the microstimu-lation training protocol used here. Although there is an increase in firing during microstimulation, we usually observed a long-lasting inhibition after the microstimulation train. This raises the possibility that we trained the animals to report neuronal circuit inhibition rather than excitation and might explain why animals so readily report inhibitory cell activity. In this perspective, how can any effect of RS neuron stimulation be explained? A recent study reported that in vivo low-frequency optogenetic
Choice Prob. 0.1 1 10 100 0.5 0.52 0.54 0.56 0.1 1 10 100 0.5 0.52 0.54 0.56 Choice Prob. Window Length [s] 0.1 1 10 100 0.5 0.52 0.54 0.56 Window Length [s] 0.1 1 10 100 0.5 0.52 0.54 0.56 Spike rate Spike CVISI C A D B
Figure 6. Detection Performance Depends on Statistic and Integra-tion Window
(A) The line plot shows choice probability as a function of integration window length. The classifier used was spike rate in the given window. A value of 0.5 corresponds to chance performance, and 1 corresponds to perfect
discrimi-nation. SeeResultsfor a detailed explanation of the procedure to calculate
choice probability. The pale red area contains 95% of the shuffled choice probabilities (100 permutations) around an expected value of 0.5. Choice probabilities rising above the shaded area can therefore be considered sig-nificant. Data averaged across all RS neurons with response probabilities greater than their catch rate (n = 109).
(B) Same as in (A), with spike CVISIas the classifier.
stimulation (Zhang et al., 2007) of excitatory layer 2/3 neurons in the barrel cortex results in a state-dependent recruitment of inhibitory neurons, with FS neurons being most active and firing the largest number of spikes (Mateo et al., 2011). Furthermore, other studies showed that activity of a single pyramidal cell may be sufficient to induce such inhibition (Kapfer et al., 2007), presumably via recruitment of somatostatin-expressing inhibi-tory interneurons (Kwan and Dan, 2012; Silberberg and Mark-ram, 2007).
Significance of Spike Train Irregularity
In order to examine the role of irregularity in the behavioral detec-tion of single-neuron stimuladetec-tion, we elicited irregular spike trains in neurons and compared the behavioral responses to those induced by regular spike trains (Figures 2and3). For irregular stimulation, we found a behavioral effect approximately twice as large as that previously reported for regular 200 ms DC cur-rent nanostimulation (Houweling and Brecht, 2008).
The fact that neural firing is highly irregular in the awake-behaving brain (Softky and Koch, 1993), in addition to our finding of increased detectability of temporally irregular stimuli, makes us speculate that perhaps the perceptual impact is maximized with irregular input and that neurons communicate with each other more efficiently this way.
Though it is unclear by which mechanism cells have a stron-ger impact on downstream populations when they fire irregu-larly, a similar finding comes from a related yet complementary study:Lak et al. (2008)examined the neuronal responses in rat barrel cortex to trains of whisker deflections at different fre-quencies with either a periodic or an irregular, noisy temporal structure. They reported that, above 10 Hz, the noisy stimuli led to a larger response magnitude and sharpening of the tem-poral precision.
However, in the present study as much as in the Lak et al. (2008)study, we cannot be sure if the irregularity merely intro-duces an upward bias or if it is usefully interpreted, indepen-dently of other spike train parameters, by downstream circuits.
Impact of Frequency and Number
We find that spike frequency is a significant parameter in the detection of single-cell stimulation of excitatory neurons in rat barrel cortex.
A previous study in the rat motor cortex provided evidence for the influence of single pyramidal cells on whisker movement in a spike-frequency-dependent manner (Brecht et al., 2004). The authors reported that single-cell stimulation at different fre-quencies could elicit whisker motion in opposite directions. Simi-larly, we found that stimulating single somatosensory cortical cells with low-frequency stimulation had the biggest sensory effect, whereas high-frequency stimulation had an opposite effect (Figures 4,5, andS6).
For microstimulation, unlike the present findings, it was observed that the detection threshold in the barrel cortex of awake head-restrained rats decreased with pulse frequency, indicating an increased sensory effect (Butovas and Schwarz, 2007). Thus, it is likely that electrical stimulation of a large popu-lation of neurons has a qualitatively different perceptual effect than stimulation of a single neuron.
The finding that higher frequencies of nanostimulation result in decreased detectability may seem counterintuitive. Indeed, the motif analysis (Figure 3C) indicated that high-frequency doublets are particularly salient, in that they influence the response timing, which is not true for low-frequency motifs (data not shown). In contrast, high-frequency stimulation of about 10 spikes was less detectable than low-frequency stimulation of the same num-ber of spikes (Figures4A and5C). While the current study did not address the mechanistic origin of these effects, one possible explanation may lie in the widespread depressing properties of synapses (Abbott et al., 1997; Tsodyks and Markram, 1997), which depend on the frequency and number of induced spikes in the presynaptic cell.
It is surprising that evoking increasing number of spikes, at equal frequency, in putative excitatory neurons did not result in an increased detectablity in the same cells (Figures 4,5, and S2). This observation is at odds with a previous report that concluded that monkeys use a simple accumulative counting strategy in primary somatosensory cortex for vibrotactile dis-crimination (Luna et al., 2005).
Optimal Integration Window
To better understand how the animal reads out the activity of the stimulated neuron, we assumed a sliding window model and measured the performance of different window lengths, posi-tions, and spike train statistics in predicting the rat’s behavioral choice.
Using this analysis, we estimated the window length that best predicted the rat’s behavior and found that FS neurons were best read out using shorter (around 100–200 ms) windows compared to RS neurons (300–400 ms,Figure 6).
Similar time scales were reported by previous studies in the monkey visual and somatosensory cortices (Britten et al., 1996; Luna et al., 2005; Salinas et al., 2000; Uka and DeAngelis, 2004; Va´zquez et al., 2013), whereas recent studies in rats showed a very short integration window of only 25 ms (Stu¨ttgen and Schwarz, 2008, 2010) in detecting near-threshold tactile stimuli. In our experiment, we found that much longer integration windows predicted the animal’s behavior best (Figure 6). This discrepancy may be because, in the Stu¨ttgen and Schwarz (2008, 2010) studies, an external stimulus evoked unreliable and quickly adapting spiking responses in many neurons simul-taneously, while in the present study, highly reproducible, nona-dapting spikes were evoked in a single neuron.
CONCLUSIONS
The present study confirms and extends the surprising discovery that manipulation of single-neuron activity can drive an animal’s behavior. The strongest modulator of the stimulation’s detect-ability turned out to be the regularity of the spikes’ timing, consis-tent with a role of temporal patterns in sensory coding. The frequency of spikes had, at equal number of action potentials, a negative influence: low-frequency stimulation was more easily detected.
Together, these findings challenge the concept of a noisy brain where individual spikes and neurons do not matter. Fur-thermore, it highlights the need to better understand structure
and function of cortical circuits and how they compute to create sensations.
EXPERIMENTAL PROCEDURES Surgical Procedures and Training
Most experimental procedures were performed as described elsewhere (Houweling and Brecht, 2008; Voigt et al., 2008). Male Wistar rats (n = 35, P33–P38 on the day of surgery) were handled and habituated to the experi-mental setup for 2–3 days before surgery. Animals were implanted under ketamine/xylazine anesthesia (100 mg/kg and 5 mg/kg intraperitoneal, supple-mentary injections of ketamine or ketamine/xylazine, respectively, adminis-tered as needed) with a metal bolt for head fixation and a recording chamber (2.5 mm posterior and 5.5 mm lateral from bregma) for chronic access to barrel cortex. Over several days, animals were habituated to head fixation and a water restriction schedule with access to water ad libitum for 1 hr/day. Animals were then trained to respond with tongue lick to a 200 ms train of microstimulation pulses applied to barrel cortex (40 cathodal pulses at 200 Hz, 0.3 ms pulse dura-tion) through a tungsten microelectrode and presented at random intervals. Tongue lick responses were detected with a beam breaker and rewarded dur-ing the task with a drop of saccharin water (0.1%) and counted as a response if they occurred within 100 to 1,200 ms after stimulus onset. The time of the first lick after stimulus onset was taken as the reaction time. To encourage animals to use a nonconservative response criterion, we only mildly punished licks in the interstimulus interval with an additional 1.5 s delay to the next stimulus presen-tation. The average interstimulus interval therefore depended on the frequency of interstimulus licks and was 7.5 ± 2.4 s over all recording sessions. All experimental procedures were carried out according to German guidelines on animal welfare under the supervision of local ethics committees.
Single-Neuron Stimulation Detection Task
Once animals performed at current intensities below 5mA on 2 consecutive
days, we switched to single-cell stimulation experiments, as previously
described (Houweling and Brecht, 2008; Voigt et al., 2008). Briefly, the animals
were head fixed during the task, and waited for the microstimulation/nanosti-mulation detection task to begin, which it did when a neuron was found. During single-cell stimulation trials, a 100, 200, 400, or 800 ms square-wave current pulse was injected into a neuron through a glass pipette. Current strength was adjusted (range = 3–40 nA, median = 12 nA) to elicit either a fixed number of spikes for the different pulse durations in the spike frequency experiments or a variable number of spikes at the same frequency in the spike number experiments.
Single-cell stimulation trials, catch trials without current injection, and micro-stimulation trials were pseudorandomly interleaved in a series of seven trials including three microstimulation trials, three single-cell stimulation trials (each of different duration), and one catch trial. All trials were presented at random intervals (Poisson process, mean = 3 s). Microstimulation currents
were adjusted (range = 3–8mA, median = 4) so that animals performed close
to the detection threshold, resulting in an average microstimulation hit rate of 90%.
For the spike regularity experiments, a 400 ms sequence was presented in order to induce an irregular spike pattern. It comprised 10, 20, 40, 80, and 160 ms current steps with intensities of 100%, 50%, 25%, 12.5%, and 6.25%, respectively, and a negative current pulse of 90 ms duration at 50% of maximal current intensity, which inhibited spiking. Every stimulation sequence contained each step exactly once, while their order was varied pseudorandomly from trial to trial. To induce a regular spike pattern, we used a single 400 ms DC current step.
Electrophysiology
The glass pipette for juxtacellular single-cell stimulation and recording was glued to a tungsten microelectrode used for microstimulation at a distance
of approximately 70mm, as described elsewhere (Houweling and Brecht,
2008; Voigt et al., 2008). The pipette was filled with intracellular solution containing (in millimolars): 135 mM K-gluconate; 10 mM HEPES; 10 mM
Na2-phosphocreatine; 4 mM KCl; 4 mM MgATP; and 0.3 mM Na3GTP
(pH 7.2). The juxtacellular signal was amplified and low-pass filtered at 3 kHz by a patch-clamp amplifier (Dagan) and sampled at 25 kHz by a Power1401 data acquisition interface under the control of Spike2 software (CED). Single-cell stimulation experiments were performed at a mean depth
reading of 1,554 ± 458mm, which is likely an overestimate of the true depth
due to oblique penetrations and dimpling.
Histological Analysis
Rats were killed by an overdose of urethane or ketamine and perfused trans-cardially with 0.9% PBS solution, followed by 4% paraformaldehyde in 0.1 M phosphate buffer. Brains were removed from the skull and immersed in fixative for at least 1 day. To reveal the cell morphology of juxtacellularly labeled cells,
brains were sectioned in 150-mm-thick coronal slices, which were then
pro-cessed with the avidin-biotin-peroxidase method essentially as described
elsewhere (Brecht and Sakmann, 2002). Sections were then mounted with
Moviol on glass coverslips. In most slices, additional cytochrome oxidase staining was performed to visualize the layer 4 barrels. Neurons were recon-structed with Neurolucida software (MBF Bioscience) and displayed as two-dimensional projections.
Data Analysis Inclusion Criteria
We restricted the analysis of behavioral responses to those single-cell stimu-lation and catch trials in which animals were considered attentive, as judged by their performance in microstimulation trials. Specifically, single-cell stimulation trials and catch trials were included if the animal responded in both the preced-ing and the succeedpreced-ing microstimulation trials or if the animal responded in a microstimulation trial that immediately preceded or succeeded the respective trial. Aborted trials, where the animal licked earlier than 100 ms from stimulus onset, were not included in the analysis. All reported values are expressed as mean ± SD if not indicated otherwise.
A cell was included in the data set if at least five single-cell stimulation trials of each condition and five catch trials fulfilled this criterion. Reported single-cell stimulation and catch trial response rates therefore refer to these included trials. Spike rates/numbers, however, were calculated over all trials. The average spontaneous firing rate was 5.1 ± 8.9 Hz for putative excitatory neurons and 10.8 ± 16.4 Hz for putative inhibitory neurons. We think that two factors contribute to the relatively high firing rates under our experimental conditions. First, we made no attempt to sample neurons in an unbiased way and, accordingly, our audio monitor was on during our search for cells; this may have resulted in sampling biases toward active units. Second, it seems likely that juxtacellular stimulation—which induces pores into the membrane of the cell under study and requires an extremely close approach—is stressful to cells and might depolarize neurons and increase their spiking rate. Indeed, we observed slight increases in firing rates across
the duration of several of our experiments (seeFigures 2,S1, andS2for
examples). Since animals were awake and displayed movements during the task, single-cell stimulation experiments were typically of short duration (median = 15, range = 3.5–165 min). A median of 14 (range = 5–197) single-cell stimulation trials per condition and 14 (range = 5–196) catch trials were included per cell.
The inclusion criteria for putative interneurons (FS neurons) were an action potential width no greater than 0.4 ms or a response of at least 50 action
potentials during at least one 200 ms current injection, as described (
Houwel-ing and Brecht, 2008). In the current study, spike width was measured as the time from threshold voltage (defined as the voltage at which the spike induced an inflection in the trace) to peak.
Assessment of Response Behavior
In a previous study (Houweling and Brecht, 2008), we used the difference
between the response rates of stimulation and catch trials, termed effect size, as a statistic to measure the behavioral influence of nanostimulation. In the present study, we analyzed the effect of several factors on this behavioral effect with a logistic regression model, which models the response probability. Therefore, the central statistic in the present study is response probability, not the previously defined effect size. Nevertheless, the catch rate is still accounted for as a regressor in the model (see the following section, titled
The logistic model implied use of the logistic function and its inverse, which are undefined for probabilities of 0 and 1. Therefore, adjusted probabilities/ rates were used, defined as
pR= NðresponsesÞ+12= ðNðtrialsÞ+1Þ;
and all references to response probability used this definition.
Correlation coefficients were Pearson’s correlation coefficients, and their significance was calculated using permutation tests that shuffled the value pair assignments.
Regression Model
The influence of cell type and the three spike train statistics CVISI, spike
fre-quency, and number on response probability was analyzed by a logistic regression with random effects. This model offers the advantage that it takes the correlation due to repeated measurements within an animal into account. Also, it allows modeling the variability between animals. The purpose of the random effects is not the quantification of these correlations but the decorre-lation of the residual error term. This is necessary because, otherwise, the cor-relations violate the underlying assumption of independent samples in the regression.
The model is described by the following equation:
logitp=b0+bi+bij+b1,CT+b2,CVISI+b3,logf+b4,logN
+b5,logitpc
where logit = the function ln [p/(1p)];p= adjusted response probability;bk=
weights of the fixed effects;bi= rat-specific intercept of rati, random effect,
assumed normally distributed (0,t1
2
);bij= cell-specific intercept of cellj, rat
i, random effect, assumed normally distributed (0,t22); CT = classification
var-iable of cell type (takes on values 1 or 0 only); CVISI= spike time intervals’ CV;
f= spike frequency;N= number of spikes; andpc= adjusted catch rate.
In all regression analyses, spike and response statistics were averaged across the trials of a condition and a session, except for the single-cell analysis ofFigure 2. Here, a modified regression model was used in which individual trials entered the regression analysis and, hence, outcomes were not rates
but binomial. Also, because a single cell was analyzed, the catch rate,pc,
became a constant and was therefore ignored for the regression.
The cell type regressor variable CT was only included in the analysis of
Fig-ure 1; in all other analyses, it was left out and the regression model was applied separately to the FS and RS cell populations. While the catch rate term was always included in the regression, different subsets of spike number, fre-quency, and irregularity were used as regressors, depending on the question. The parameters of the mixed effect model were estimated using SAS, pro-cedure glimmix (SAS Institute), using Laplace’s method where possible and maximum subject pseudolikelihood otherwise. Only the fixed-effects
estima-torsbkwere reported.
Model selection was based on the BIC.
Similarly, a regression model for response latency was defined as
L=b0+bi+bij+b1,CT+b2,CVISI+b3,logf+b4,logN
withLindicating the response latency and the other variables analogous to the
aforementioned model.
LFP Oscillations
For LFP analysis, juxtacellularly recorded voltages were band-pass filtered at 4–30 Hz, and a power spectrum was calculated using the Fast Fourier Transform with a Hanning window (size of 0.65 s, 8,192 bins of 1.5 Hz, for fre-quencies between 0 and 12,500 Hz) over a 2 s period before stimulus onset. The power spectrum was calculated separately for individual trials and then averaged within the different response categories (hits, misses, false-posi-tives, correct rejections). To obtain the population spectra for the different
response categories (Figure S5), the power spectra of individual cells were
then averaged.
Integration Window Analysis
To find the window whose activity best predicts the rat’s response, we applied an ROC procedure. Classifiers were spike train statistics (spike rate and
CVISI) calculated on parametrically varied windows anchored to the animal’s
response times. All nanostimulation and catch trials were included in this anal-ysis, but not microstimulation. Windows were locked to the animal’s response, with a variable delay (0 to 200 ms; step size, 12.5 ms) between the window’s end and the response time (longer delays were tested and found to lead to infe-rior performance). Window lengths were between 25 ms and 100 s, with 20% increments. Given that, for nonresponse trials, there was no true time to lock to, 100 pseudorandom virtual nonresponse times were chosen from within the allowed response window (100–1,200 ms after stimulus onset). Then, for each window length and position, and for each cell type and classifier, the choice probability was calculated. This was done by applying the ROC proce-dure to the response trials versus the nonresponse trials (100 instances of each nonresponse trial due to the multiple time sampling), yielding the area under the ROC curve, termed choice probability. Here, another randomization step was applied in that choice probability was calculated another 99 times with the response and nonresponse labels shuffled between trials.
For each window length, the maximal choice probability across window positions was chosen. This led to an upward bias because of noise. To esti-mate the bias, we measured, for each classifier and window length, how far the average shuffled choice probabilities exceeded the expected value for random associations of 0.5. This bias estimate was subtracted from the real
as well as the shuffled data inFigure 6.
SUPPLEMENTAL INFORMATION
Supplemental Information includes six figures and two tables and can
be found with this article online athttp://dx.doi.org/10.1016/j.neuron.2013.
11.032.
ACKNOWLEDGMENTS
We thank Brigitte Geue and Undine Schneeweiss for technical support; and Edith Chorev, Rajnish Rao, and Andrea Burgalossi for comments on the manuscript. This work was supported by the Netherlands Organisation for Scientific Research, the Bernstein Center for Computational Neuroscience, the Humboldt University of Berlin, a German Academic Exchange Service (DAAD) stipend to G.D., the FP7 Biotact EU grant, and a European Research Council Neuro-behavior grant to M.B.
Accepted: November 19, 2013 Published: February 5, 2014
REFERENCES
Abbott, L.F., Varela, J.A., Sen, K., and Nelson, S.B. (1997). Synaptic
depres-sion and cortical gain control. Science275, 220–224.
Adrian, E.D. (1919). The response of human sensory nerves to currents of short
duration. J. Physiol.53, 70–85.
Afraz, S.R., Kiani, R., and Esteky, H. (2006). Microstimulation of inferotemporal
cortex influences face categorization. Nature442, 692–695.
Bonifazi, P., Goldin, M., Picardo, M.A., Jorquera, I., Cattani, A., Bianconi, G., Represa, A., Ben-Ari, Y., and Cossart, R. (2009). GABAergic hub neurons
orchestrate synchrony in developing hippocampal networks. Science326,
1419–1424.
Brecht, M., and Sakmann, B. (2002). Whisker maps of neuronal subclasses of the rat ventral posterior medial thalamus, identified by whole-cell voltage
recording and morphological reconstruction. J. Physiol.538, 495–515.
Brecht, M., Schneider, M., Sakmann, B., and Margrie, T.W. (2004). Whisker movements evoked by stimulation of single pyramidal cells in rat motor cortex.
Nature427, 704–710.
Britten, K.H., Newsome, W.T., Shadlen, M.N., Celebrini, S., and Movshon, J.A. (1996). A relationship between behavioral choice and the visual responses of
neurons in macaque MT. Vis. Neurosci.13, 87–100.
Butovas, S., and Schwarz, C. (2007). Detection psychophysics of intracortical
microstimulation in rat primary somatosensory cortex. Eur. J. Neurosci.25,
Cardin, J.A., Carle´n, M., Meletis, K., Knoblich, U., Zhang, F., Deisseroth, K., Tsai, L.H., and Moore, C.I. (2009). Driving fast-spiking cells induces gamma
rhythm and controls sensory responses. Nature459, 663–667.
Connors, B.W., and Gutnick, M.J. (1990). Intrinsic firing patterns of diverse
neocortical neurons. Trends Neurosci.13, 99–104.
deCharms, R.C., and Merzenich, M.M. (1996). Primary cortical representation
of sounds by the coordination of action-potential timing. Nature381, 610–613.
Engel, A.K., Fries, P., and Singer, W. (2001). Dynamic predictions: oscillations
and synchrony in top-down processing. Nat. Rev. Neurosci.2, 704–716.
Galarreta, M., and Hestrin, S. (1999). A network of fast-spiking cells in the
neocortex connected by electrical synapses. Nature402, 72–75.
Galarreta, M., and Hestrin, S. (2002). Electrical and chemical synapses among parvalbumin fast-spiking GABAergic interneurons in adult mouse neocortex.
Proc. Natl. Acad. Sci. USA99, 12438–12443.
Gibson, J.R., Beierlein, M., and Connors, B.W. (1999). Two networks of
elec-trically coupled inhibitory neurons in neocortex. Nature402, 75–79.
Gray, C.M., and McCormick, D.A. (1996). Chattering cells: superficial pyrami-dal neurons contributing to the generation of synchronous oscillations in the
visual cortex. Science274, 109–113.
Greenberg, D.S., Houweling, A.R., and Kerr, J.N. (2008). Population imaging of
ongoing neuronal activity in the visual cortex of awake rats. Nat. Neurosci.11,
749–751.
Hahnloser, R.H., Kozhevnikov, A.A., and Fee, M.S. (2002). An ultra-sparse code underlies the generation of neural sequences in a songbird. Nature
419, 65–70.
Herfst, L.J., and Brecht, M. (2008). Whisker movements evoked by stimulation
of single motor neurons in the facial nucleus of the rat. J. Neurophysiol.99,
2821–2832.
Houweling, A.R., and Brecht, M. (2008). Behavioural report of single neuron
stimulation in somatosensory cortex. Nature451, 65–68.
Houweling, A.R., Doron, G., Voigt, B.C., Herfst, L.J., and Brecht, M. (2010). Nanostimulation: manipulation of single neuron activity by juxtacellular current
injection. J. Neurophysiol.103, 1696–1704.
Huber, D., Petreanu, L., Ghitani, N., Ranade, S., Hroma´dka, T., Mainen, Z., and Svoboda, K. (2008). Sparse optical microstimulation in barrel cortex drives
learned behaviour in freely moving mice. Nature451, 61–64.
Kapfer, C., Glickfeld, L.L., Atallah, B.V., and Scanziani, M. (2007). Supralinear increase of recurrent inhibition during sparse activity in the somatosensory
cortex. Nat. Neurosci.10, 743–753.
Kwan, A.C., and Dan, Y. (2012). Dissection of cortical microcircuits by
single-neuron stimulation in vivo. Curr. Biol.22, 1459–1467.
Lak, A., Arabzadeh, E., and Diamond, M.E. (2008). Enhanced response of neu-rons in rat somatosensory cortex to stimuli containing temporal noise. Cereb.
Cortex18, 1085–1093.
Li, C.Y., Poo, M.M., and Dan, Y. (2009). Burst spiking of a single cortical neuron
modifies global brain state. Science324, 643–646.
Linkenkaer-Hansen, K., Nikulin, V.V., Palva, S., Ilmoniemi, R.J., and Palva, J.M. (2004). Prestimulus oscillations enhance psychophysical performance
in humans. J. Neurosci.24, 10186–10190.
Luna, R., Herna´ndez, A., Brody, C.D., and Romo, R. (2005). Neural codes for perceptual discrimination in primary somatosensory cortex. Nat. Neurosci.
8, 1210–1219.
Mateo, C., Avermann, M., Gentet, L.J., Zhang, F., Deisseroth, K., and Petersen, C.C. (2011). In vivo optogenetic stimulation of neocortical excitatory
neurons drives brain-state-dependent inhibition. Curr. Biol.21, 1593–1602.
Olshausen, B.A., and Field, D.J. (2004). Sparse coding of sensory inputs. Curr.
Opin. Neurobiol.14, 481–487.
Panzeri, S., Petersen, R.S., Schultz, S.R., Lebedev, M., and Diamond, M.E. (2001). The role of spike timing in the coding of stimulus location in rat
somato-sensory cortex. Neuron29, 769–777.
Panzeri, S., Brunel, N., Logothetis, N.K., and Kayser, C. (2010). Sensory neural
codes using multiplexed temporal scales. Trends Neurosci.33, 111–120.
Papadopoulou, M., Cassenaer, S., Nowotny, T., and Laurent, G. (2011). Normalization for sparse encoding of odors by a wide-field interneuron.
Science332, 721–725.
Roelfsema, P.R., Lamme, V.A.F., and Spekreijse, H. (2004). Synchrony and covariation of firing rates in the primary visual cortex during contour grouping.
Nat. Neurosci.7, 982–991.
Romo, R., Herna´ndez, A., Zainos, A., and Salinas, E. (1998). Somatosensory
discrimination based on cortical microstimulation. Nature392, 387–390.
Salinas, E., Herna´ndez, A., Zainos, A., and Romo, R. (2000). Periodicity and firing rate as candidate neural codes for the frequency of vibrotactile stimuli.
J. Neurosci.20, 5503–5515.
Salzman, C.D., Britten, K.H., and Newsome, W.T. (1990). Cortical
microstimu-lation influences perceptual judgements of motion direction. Nature 346,
174–177.
Schubert, R., Haufe, S., Blankenburg, F., Villringer, A., and Curio, G. (2009). Now you’ll feel it, now you won’t: EEG rhythms predict the effectiveness of
perceptual masking. J. Cogn. Neurosci.21, 2407–2419.
Shadlen, M.N., and Newsome, W.T. (1994). Noise, neural codes and cortical
organization. Curr. Opin. Neurobiol.4, 569–579.
Silberberg, G., and Markram, H. (2007). Disynaptic inhibition between
neocor-tical pyramidal cells mediated by Martinotti cells. Neuron53, 735–746.
Softky, W.R., and Koch, C. (1993). The highly irregular firing of cortical cells is
inconsistent with temporal integration of random EPSPs. J. Neurosci.13,
334–350.
Stu¨ttgen, M.C., and Schwarz, C. (2008). Psychophysical and neurometric
detection performance under stimulus uncertainty. Nat. Neurosci.11, 1091–
1099.
Stu¨ttgen, M.C., and Schwarz, C. (2010). Integration of vibrotactile signals for whisker-related perception in rats is governed by short time constants: comparison of neurometric and psychometric detection performance.
J. Neurosci.30, 2060–2069.
Swadlow, H.A. (2003). Fast-spike interneurons and feedforward inhibition in
awake sensory neocortex. Cereb. Cortex13, 25–32.
Tsodyks, M.V., and Markram, H. (1997). The neural code between neocortical pyramidal neurons depends on neurotransmitter release probability. Proc.
Natl. Acad. Sci. USA94, 719–723.
Uka, T., and DeAngelis, G.C. (2004). Contribution of area MT to stereoscopic depth perception: choice-related response modulations reflect task strategy.
Neuron42, 297–310.
Vallbo, A.B., Olsson, K.A., Westberg, K.G., and Clark, F.J. (1984). Microstimulation of single tactile afferents from the human hand. Sensory
attributes related to unit type and properties of receptive fields. Brain107,
727–749.
Va´zquez, Y., Salinas, E., and Romo, R. (2013). Transformation of the neural code for tactile detection from thalamus to cortex. Proc. Natl. Acad. Sci.
USA110, E2635–E2644.
Voigt, B.C., Brecht, M., and Houweling, A.R. (2008). Behavioral detectability of single-cell stimulation in the ventral posterior medial nucleus of the thalamus.
J. Neurosci.28, 12362–12367.
Wolfe, J., Houweling, A.R., and Brecht, M. (2010). Sparse and powerful cortical
spikes. Curr. Opin. Neurobiol.20, 306–312.
Zhang, F., Wang, L.P., Brauner, M., Liewald, J.F., Kay, K., Watzke, N., Wood, P.G., Bamberg, E., Nagel, G., Gottschalk, A., and Deisseroth, K. (2007).