IMF Country Report No. 13/263
IMF MULTI-COUNTRY REPORT
GERMAN-CENTRAL EUROPEAN SUPPLY CHAIN—
CLUSTER REPORT
IMF staff regularly produces papers covering multilateral issues and cross-country analyses. The following documents have been released and are included in this package:
Staff Report on German-Central European Supply Chain—Cluster Report, prepared byIMF staff and completed on July 1, 2013 for the Executive Board’s consideration on July 11, 2013.
First Background Note—Trade Linkages
Second Background Note—The Evolution of Financial Linkages
Third Background Note—The Role of Fundamentals and PoliciesThe Executive Board met in an informal session, and no decisions were taken at this meeting.
The publication policy for staff reports and other documents allows for the deletion of market-sensitive information.
Copies of this report are available to the public from International Monetary Fund Publication Services
P.O. Box 92780 Washington, D.C. 20090 Telephone: (202) 623-7430 Telefax: (202) 623-7201 E-mail: [email protected] Internet: http://www.imf.org
International Monetary Fund
Washington, D.C.
GERMAN-CENTRAL EUROPEAN SUPPLY CHAIN—
CLUSTER REPORT
EXECUTIVE SUMMARY
Since the 1990s a German-Central European supply chain (GCESC) has evolved, manufacturing goods for export to the rest of the world. Reflecting this, bilateral trade linkages between Germany and the Czech Republic, Hungary, Poland and the Slovak Republic (henceforth CE4) have expanded rapidly.
Supply chain production in CE4 countries has been supported by large inflows of FDI. FDI comprised a much larger share of overall capital inflows to the CE4 than to some comparator European countries. FDI was directed to the manufacturing sectors, in particular, motor vehicles and other transport equipment. Portfolio investment and cross-border bank flows were relatively less important.
Participation in the GCESC has led to technology transfers to CE4 countries and accelerated income convergence. Export growth in knowledge-intensive sectors has been particularly rapid in the CE4. The sophistication of domestic value added
embodied in overall exports has also increased rapidly. Complementarities between supply chain activities and domestic production have led to greater synchronization of the business cycle among GCESC countries.
CE4 policymakers stressed the importance of safeguarding enhanced
competitiveness in knowledge-intensive sectors. As unit labor cost differentials with Germany narrow, the CE4 countries may struggle to sustain their current role in the supply chain. In order to remain part of the GCESC—or branch out into more
specialized export production activities, as some countries in Asia have done—the CE4 countries will need to continually upgrade labor force skills.
The growth of the supply chain has increased the exposure of Germany and the CE4 to final demand outside Europe, to an extent not captured by bilateral trade statistics. Spillovers from aggregate demand and policy actions in the rest of the world are now much larger than before. Conversely, German domestic demand spillovers to the CE4 remain relatively small. Much bilateral trade between Germany and the CE4 is in intermediate goods: final demand in Germany is not the main determinant of CE4 exports to Germany. Correspondingly, German fiscal policies to stimulate or contract domestic demand have a relatively limited impact on CE4 economies.
Balance sheet fundamentals in Germany are a key determinant of the magnitude of shock spillovers to CE4 countries and beyond. Currently, sound fundamentals act as a shock absorber; more leveraged balance sheets and greater sovereign risk in Germany would considerably magnify the regional impact of external shocks. July 1, 2013
GERMAN-CENTRAL EUROPEAN SUPPLY CHAIN CLUSTER REPORT
Approved By
Ranjit Teja
Prepared by Shekhar Aiyar, Bartek Augustyniak, Christian Ebeke, Ehsan Ebrahimy, Selim Elekdag, Nir Klein, Subir Lall and Hongyan Zhao (all EUR) and Dirk Muir (RES).
CONTENTS
INTRODUCTION __________________________________________________________________________________ 3 THE EVOLUTION OF TRADE AND FINANCIAL LINKAGES _______________________________________ 3
A. Trade Linkages __________________________________________________________________________________ 3
B. Financial Linkages _______________________________________________________________________________ 6 MACROECONOMIC CONSEQUENCES AND POLICY IMPLICATIONS ___________________________ 8
A. Business Cycle Synchronization _________________________________________________________________ 8
B. Technology Transfers ____________________________________________________________________________ 8
C. Spillovers to Domestic Production ____________________________________________________________ 10
D. Income Convergence __________________________________________________________________________ 10
E. The Importance of German Balance Sheets ___________________________________________________ 12 KEY CONCLUSIONS _____________________________________________________________________________ 13 FIGURES
1. Bilateral Trade with Germany ____________________________________________________________________ 4
2. Actual Exposure of the CE4 Countries Based on the Recipients’ Final Demand, 2009 ___________ 5
3. Sectoral Contribution to Export Growth, 1995–2009 ____________________________________________ 5
4. Financial Linkages _______________________________________________________________________________ 6
5. Conditional Correlation of Output Gap __________________________________________________________ 8
6. The Change in Foreign and Domestic Value Added in Total Exports, 1995–2009 _____________ 10
7. Income Convergence and the Role of Supply Chains __________________________________________ 10
8. Aggregate Demand Shock ____________________________________________________________________ 11
9. Role of German Balance Sheets in mediating an Aggregate Demand Shock __________________ 12 TABLE
1. Revealed Comparative Advantage (RCA) in Manufacturing _____________________________________ 9
INTRODUCTION
1. In recent decades supply chains—production spread across several countries within a particular region—have arisen in many different parts of the world. The distribution of the manufacturing process over more than one country, with different countries specializing in different stages of production, owes to both a favorable policy environment and technological developments. Global and regional trade agreements have resulted in significant tariff reduction and removal of non-trade barriers, while increased financial liberalization has encouraged foreign direct investment (FDI) supporting the offshoring of production. Technological developments have also played a vital role: falling transportation costs and improvements in communication technologies have
significantly reduced the costs of information exchange and made it easier for firms to coordinate and monitor production in diverse locations.
2. In Europe the German-Central European Supply Chain (GCESC) has expanded rapidly
since the mid-1990s and assumed global importance. Large labor cost differentials together with geographical proximity and cultural similarities have led many German firms to shift large parts of their production to central European countries, most notably the Czech Republic, Hungary, Poland and Slovakia (CE4, hereafter) either by directly investing there or by purchasing intermediate inputs from local firms. The pattern is exemplified by the automobile industry, where increasing
competition in both domestic and foreign markets has triggered a sustained process of outsourcing of manufacturing activities.
3. This report examines the evolution and economic implications of the GCESC. Several questions of policy relevance are discussed. What have been the chief benefits of membership in the GCESC, and how should these best be safeguarded? Have vulnerabilities to external shocks risen as a result of the supply chain? Have demand or policy spillovers within the cluster become more important over time? To answer these questions, the study first documents the pattern of vertical trade integration in the GCESC, and the pattern of international capital flows supporting this integration. The benefits and costs of GCESC membership are then examined empirically along several dimensions. Model simulations are used to examine policy actions and spillovers.
THE EVOLUTION OF TRADE AND FINANCIAL LINKAGES
A. Trade Linkages
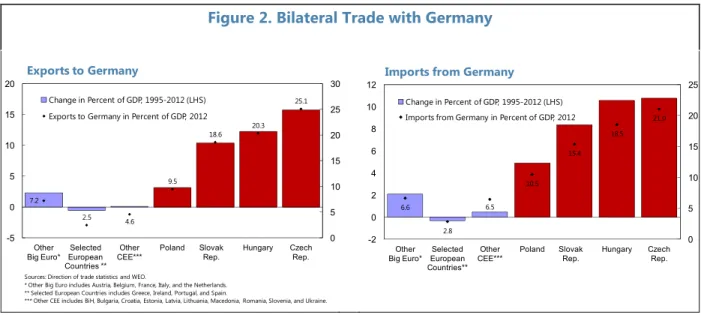
4. The CE4’s trade links with Germany have strengthened considerably since the
mid-1990s, largely reflecting their increased integration into the GCESC. Bilateral trade with Germany grew much faster in CE4 countries than in other European countries (Figure 1). However, there is heterogeneity among the CE4 countries. In particular, Poland, which accounts for more than half of CE4 GDP, is a relatively less open economy than the others, and its trade with Germany has grown more slowly. Similarly the share of German value added embodied in CE4 exports expanded much more rapidly than in comparator countries. Apart from large unit labor cost differentials and
adequate labor skills to support supply chain activities, the CE4’s integration into the GCESC reflects several bilateral advantages vis-à-vis Germany: geographic proximity, cultural similarities, and a similar sectoral structure. Rahman and Zhao (2013) compute an “industrial similarity index” relative to Germany, and show that the CE4 countries had strong similarities with Germany even before they integrated into the GCESC.
5. The growth of the supply chain has substantially increased the exposure of both Germany and the CE4 to final demand outside Europe, to an extent not captured by bilateral
Figure 1. Bilateral Trade with Germany
Sources:DOTS; IMF staff calculations based on the WIOT.
* Other Big Euro includes Austria, Belgium, France, Italy, and the Netherlands. ** Selected European Countries includes Greece, Ireland, Portugal, and Spain.
*** Other CEE includes BiH, Bulgaria, Croatia, Estonia, Latvia, Lithuania, Macedonia, Romania, Slovenia, and Ukraine. 6.6 2.8 6.5 10.5 15.4 18.5 21.0 0 5 10 15 20 25 -2 0 2 4 6 8 10 12 Other Big Euro* EuropeanSelected
Countries** Other
CEE*** Poland Slovak Rep. Hungary Czech Rep.
Change in Percent of GDP, 1995-2012 (LHS) Imports from Germany in Percent of GDP, 2012 Imports from Germany
7.2 2.5 4.6 9.5 18.6 20.3 25.1 0 5 10 15 20 25 30 -5 0 5 10 15 20 Other Big Euro* European Selected
Countries ** Other
CEE*** Poland Slovak Rep. Hungary Czech Rep.
Change in Percent of GDP, 1995-2012 (LHS)
Exports to Germany in Percent of GDP, 2012 Exports to Germany AUT BEL BGR CYP CZE DNK ESP EST FIN FRA GBR GRC HUN IRL ITA LTU LUX LVA MLT NLD POL PRT ROM RUS SVK SVN SWE TUR 0 2 4 6 8 10 12 0 2 4 6 8 10 12 2009 1995
Share of German Value Added in Total Exports
(1995 vs. 2009) 70 59 71 57 83 71 68 58 83 76 8 10 5 9 4 6 5 7 21 31 24 34 13 23 27 34 17 24 0 20 40 60 80 100 120 1995 2009 1995 2009 1995 2009 1995 2009 1995 2009
CZE HUN POL SVK DEU
Other countries' VA German VA Domestic VA Composition of Total Exports
trade statistics. Conventional trade statistics tend to overestimate exposures within a supply chain due to the high prevalence of trade in intermediate goods. The recently released World Input-Output Table (WIOT) permits a detailed decomposition by origin of the value added (VA) embodied in total exports (Background Note 1). Figure 2 compares exposures to countries of final demand (from WIOTS) against more
conventional gross exposures
computed using the IMF’s Direction of Trade statistics (DOTS). Germany’s exposure to the EU under the WIOT (48 percent) is significantly below the implied exposure under DOTS (62 percent) while its exposure to the rest of the world is much higher (33 percent vs. 26 percent). Similarly, the CE4’s exposure to Germany is significantly lower than implied by gross bilateral trade statistics; a substantial fraction of CE4 exports pass through Germany before export outside the EU.
6. CE4 exports grew most rapidly in knowledge-intensive sectors
(Figure 3).1 In Czech Rep., Hungary and Slovakia, these sectors—which include transport and electrical equipment, machinery and chemicals—contributed about 50-60 percent of total export growth in the period 1995-2009. In Poland, their contribution was somewhat lower (40 percent) but still the highest among sectors. Knowledge-intensive sectors also comprise the highest share in the countries’ domestic VA exports (about 30-40 percent).
1 The various sectors are grouped into five main categories: primary and natural resources, services, labor-intensive
manufacturing, capital-intensive manufacturing and knowledge-intensive manufacturing.
0 20 40 60 80 100
CZE HUN POL SVK
Knowledge-intensive manufacturing Capital-intensive manufacturing
Services Labor-intensive manufacturing
Primary and natural resources
Figure 3. Sectoral Contribution to Exports Growth, 1995-2009
(Percent)
Source: IMF staff calculations based on the WIOT.
48.9 52.3 44.7 53.3 50.8 53.5 59.5 66.4 48.2 62.1 21.3 32.4 14.0 25.4 18.1 26.1 15.2 19.5 21.7 12.9 31.0 17.5 22.9 17.5 17.7 11.6 33.5 26.5 4.5 1.6 6.1 2.3 4.7 1.8 3.7 1.1 9.9 6.7 3.5 0.7 4.2 1.5 3.5 1.1 3.8 1.4 8.4 4.7 0 20 40 60 80 100 120 Decomp.
from WIOT DOTS from WIOTDecomp. DOTS from WIOTDecomp. DOTS from WIOTDecomp. DOTS from WIOTDecomp. DOTS CZE HUN POL SVK DEU
Figure 2. Actual Exposure of the CE4 Countries Based on the Recipients' Final Demand, 2009
(Percent)
Other EU Germany Others US China
Bank Claims, FDI Stocks, and Portfolio Positions (Percent of GDP) 0 20 40 60 80 100 120 140 160 180 200 0 20 40 60 80 100 120 140 160 180 200 1995 1998 2001 2004 2007 2010 Portfolio Positions Bank Claims FDI CE4 0 20 40 60 80 100 120 140 160 180 200 0 20 40 60 80 100 120 140 160 180 200 1995 1998 2001 2004 2007 2010 Portfolio Positions Bank Claims FDI SP
Figure 4. Financial Linkages
Breakdown of FDI into Greenfield Projects and M&As
(Percent of GDP) 0 2 4 6 8 10 0 2 4 6 8 10 2003 2005 2007 2009 2011 M&As Greenfield investments CE4 0 2 4 6 8 10 0 2 4 6 8 10 2003 2005 2007 2009 2011 M&As Greenfield investments SP
Cross-Border Bank Claims
(Percent of GDP) 0 10 20 30 40 50 60 70 80 0 10 20 30 40 50 60 70 80 1995 1998 2001 2004 2007 2010 Claims on Banks Claims on non-Banks CE4 0 10 20 30 40 50 60 70 80 0 10 20 30 40 50 60 70 80 1995 1998 2001 2004 2007 2010 Claims on Banks Claims on non-Banks SP
Sources: OECD; BIS (consolidated and locational banking statistics); CPIS; UNCTAD World Investement Report2013; and IMF staff calculations.
B. Financial Linkages
7. The evolution of the GCESC has been supported by large inflows of foreign direct investment (FDI) to CE4 countries. Figure 4 decomposes the stock of inward capital flows into FDI, portfolio flows and other (mainly bank) flows.2 All stocks are scaled by GDP, and for reference
Italy, Portugal and Spain—another group of European countries which globalized rapidly in the run-up to the 2007-08 crisis but have had very different recovery paths (Background Note 2). While FDI and bank flows were the main source of external financing for the CE4, portfolio and bank flows were the main types of external financing for the SP. The pattern of bilateral German claims on the CE4 and SP is broadly similar to the global exposures.
8. Moreover, the FDI inflows into CE4 countries have largely financed greenfield investments (Figure 4). Greenfield investment—as opposed to mergers and acquisitions (M&A) activity—is generally associated with an expansion in productive capacity and therefore growth. Moreover, it is a relatively stable source of external funding, and the least prone to sudden stops and reversals. Notably, much of the FDI directed to the CE4 countries was in the Motor Vehicles and Transport Equipment sectors (Background Note 2), supporting the offshoring of German passenger car production (Box, Background Note 1). 2009 marked the first year in which offshored production outstripped domestic German production of passenger cars.
9. While foreign bank finance has played a large role in the CE4, cross-border bank flows have been less pronounced (albeit still important). The CE4 countries have been reliant on foreign bank financing to roughly the same extent as the SP countries on a consolidated basis, which includes not just cross-border bank flows, but also local lending by resident foreign branches and subsidiaries. But cross-border bank flows to the CE4 countries have been far less pronounced than in the SP (Figure 4). In the run-up to the financial crisis, cross-border claims on the SP countries built-up to a much larger extent than in CE4 countries, and the corresponding deleveraging was also much sharper. Foreign bank lending to the CE4 contained a relatively larger share of local lending by resident banks, which tend to support their lending operations through local deposits and are thus more stable and less prone to sudden reversals. However, there are important differences between CE4 countries; in particular, the share of cross-border bank flows was much larger in Hungary (where the pattern more closely resembled the SP countries).
10. Overall, therefore, it would appear that the external financial linkages supporting the GCESC countries have developed in a sustainable fashion over time. The stock position indicates the predominance of FDI and lending by foreign-owned but locally resident banks. FDI is a relatively stable source of external funding, and holds up better during external crises, as documented by a well-established literature, most recently, Catao and Milesi-Ferretti (2013). FDI was directed to the manufacturing—and in particular, motor vehicles and other transport equipment—sectors, and a substantial amount of this FDI comprised greenfield investments. By way of contrast, the SP attracted a greater share of portfolio and cross-border banking flows, which—with the benefit of hindsight—exacerbated overheating pressures. In general, while FDI flows promoted durable growth in the CE4, non-FDI flows added to macroeconomic and financial imbalances across the SP.
MACROECONOMIC CONSEQUENCES AND POLICY
IMPLICATIONS
A. Business Cycle Synchronization
11. The business cycles of the CE4 countries have
become more synchronized with Germany. The CE4
countries stand out in a ranking of the bilateral conditional correlation of output gaps against Germany.3 The conditional correlation has increased
over time for all the CE4 countries except Hungary (Figure 5), and this is associated with the size of German VA embodied in the countries’ exports. For other CEE countries, the output synchronization seems to have diminished over the time. This result—that greater vertical tradeintegration with Germany contributes to closer business cycle co-movement—is supported by a more formal econometric analysis that attempts to account for endogeneity concerns (see Background Note 1).
B. Technology Transfers
12. There is evidence that participation in the GCESC has led to considerable technology transfers to the CE4 countries. As documented in the previous section, export growth in
knowledge-intensive sectors has been particularly rapid in the CE4 countries. Moreover, the share of these sectors in domestic value added exports has been increasing.
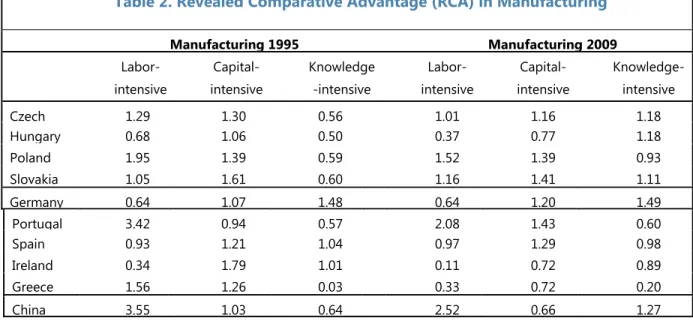
13. Revealed Comparative Advantage (RCA) patterns for the CE4 countries have evolved in
line with such technology transfers.4 Table 1 provides RCA calculations in the manufacturing sectors for the CE4 countries, Germany and some comparator countries. The manufacturing sectors are grouped into labor-intensive, capital-intensive, and knowledge-intensive sectors. The RCA calculations show that with the exception of Poland, all other CE4 countries have largely “caught up” with Germany’s comparative advantage in the knowledge-intensive manufacturing sectors, which
3 The correlation of output gaps is computed using output gaps (for each country and Germany) purged from the
effect of global economic conditions. The resulting output gaps therefore represent idiosyncratic shocks observed in each country. See Background Note 1 for further details.
4 Traditionally, RCA is defined as the proportion of a sector’s exports in a country’s total gross exports relative to the
average share of the same sector’s exports in the world’s total exports. A value higher than one indicates that the country has a comparative advantage in that particular sector. Here RCA is calculated on the basis of domestic VA, as
Source: WEO; and IMF staff estimates.
*Bubbles represent the size of German's Value-Added embodied in countries' i gross exports in 2009.
BGR CZE EST HUN LTU LVA POL ROM SVK SVN -0.6 -0.4 -0.2 0 0.2 0.4 0.6 0.8 1 -0.4 -0.2 0 0.2 0.4
Corr (Y; Y*) over 1995Q1-2000Q4 Figure 5. Conditional Correlation of Output Gap*
C or r ( Y ; Y *) ov er 2 00 1Q 1-200 6Q 4
are a significant part of the German supply chain. While there has been a concomitant loss of comparative advantage in the labor and capital-intensive sectors, even in these sectors the RCA index remains greater than one (except in Hungary). These trends differ from those in some euro area periphery countries, which have lost their comparative advantage in the knowledge-intensive sectors (Ireland and Spain) or retain their comparative disadvantage (Greece and Portugal).
Table 1. Revealed Comparative Advantage (RCA) in Manufacturing
Manufacturing 1995 Manufacturing 2009 Labor-intensive Capital-intensive Knowledge -intensive Labor-intensive Capital-intensive Knowledge-intensive Czech 1.29 1.30 0.56 1.01 1.16 1.18 Hungary 0.68 1.06 0.50 0.37 0.77 1.18 Poland 1.95 1.39 0.59 1.52 1.39 0.93 Slovakia 1.05 1.61 0.60 1.16 1.41 1.11 Germany 0.64 1.07 1.48 0.64 1.20 1.49 Portugal 3.42 0.94 0.57 2.08 1.43 0.60 Spain 0.93 1.21 1.04 0.97 1.29 0.98 Ireland 0.34 1.79 1.01 0.11 0.72 0.89 Greece 1.56 1.26 0.03 0.33 0.72 0.20 China 3.55 1.03 0.64 2.52 0.66 1.27
Source: Rahman and Zhao (2013).
14. Integration into the GCESC has greatly enhanced CE4 competitiveness in
knowledge-intensive sectors. With the progression of income convergence and narrowing of unit labor cost differentials with Germany, the CE4 countries may struggle to sustain their current role in the supply chain and further benefit from the vertical specialization. In addition, other CEE economies have made substantial progress in removing impediments to trade and improving the business
environment, increasing their attractiveness as new potential links in the GCESC. In order to remain part of the GCESC—or indeed, to branch out into more specialized export production activities of their own—the CE4 countries will likely need to continue investing in human capital and upgrading labor skills to cement their comparative advantage in the region. This would facilitate moving up the value chain, as countries in Asia, notably China, are doing.5
5 IMF (2011) documents that China is moving beyond its earlier predominant role as a downstream assembler of
manufactured products, and accounts for a burgeoning share of intermediate inputs into advanced countries’ high technology exports.
C. Spillovers to Domestic Production
15. The increase in foreign value added in CE4 exports appears to have spurred domestic value added (DVA). While the shares of DVA
in gross exports have broadly declined, they have increased significantly in nominal terms and as a percentage of GDP (Figure 6). The increase in domestic VA was positively correlated with the increase in foreign value added (FVA). Importantly, Rahman and Zhao (2013), who examine the relationship between foreign and domestic VA growth across 40 countries during 1995-2008, find econometric evidence that causality runs from growth in FVA to DVA.
16. Thus attracting FVA—as part of integrating into the vertical supply chain—
complements rather than substitutes for domestic production. The existence of the supply chain creates demand for ancillary products and services in host economies. This contributes to an
expansion of the production possibility frontier and spurs overall employment and growth. So policies aimed at improving an economy’s attractiveness for the supply chain are unlikely to come at the expense of domestic industries; instead the latter in general benefit from positive spillovers from supply chain activities.
D. Income Convergence
17. There are several channels through which trade—and supply chains in particular—may
foster growth and income convergence. Trade can stimulate productivity gains, especially if supported by investment that embodies technological transfers with spillovers to other sectors in the economy. It could also foster financial deepening. Moreover, trade can contribute to
specialization in highly productive sectors, which could generate efficiency gains for the economy as a whole.
18. The CE4 economies have generally grown more rapidly than can be explained simply by initial income, suggesting that membership in the GCESC accelerated income convergence. Figure 7 illustrates that over the last two decades income
convergence was broadly prevalent in Europe. Greater technological catch-up, improved
AUT BEL BGR CYP CZE DEU DNK ESP EST FIN FRA GBR GRC HUN IRL ITA LTU LVA MLT NLD POL PRT ROM RUS SVK SVN TURSWE -5 0 5 10 15 20 -10 -5 0 5 10 15 20 25 Th e Ch an ge in D om es tic V A
The Change in Foreign VA
Figure 6. The Change in Foreign and Domestic Value Added in Total Exports, 1995-2009
(Percent of GDP)
Only CE4
Source: IMF staff calculations based on the WIOT.
AUT BEL BGR CZE EST FIN GRC HUN IRL NLD POL PRT ROM RUS SVK SVN ESP SWE GBR y = -7E-07x + 0.0374 R² = 0.28 0.01 0.02 0.03 0.04 0.05 0.06 0.07 re al G D P pe r cap ita g ro w th * rat e ( 19 90 -2 01 0 )
Figure 7. Income Convergence and the Role of Supply Chains (Bubble size is proportional to the share of German foreign value added embodied in countries' exports as percentage of GDP in 2009)
developing countries, mostly from the CEE region, to grow faster than richer economies. But the CE4 countries, with the exception of Hungary, lie above the regression line, implying that, controlling for initial income, they grew faster than average. The importance of the supply chain is confirmed using a more formal econometric approach, in which the beta convergence co-efficient is allowed to vary according to the amount of foreign VA in a country’s exports (see Background Note 1 for further details). Exposure to External Shocks
19. Greater trade openness has increased the vulnerability of both Germany and the individual CE4 countries to global shocks. A six-region version of the IMF’s Global Integrated Monetary and Fiscal (GIMF) modelis calibratedto capture the way in which the evolution of the GCESC has changed the transmission of shocks (Background Note 3).Each region exports and imports both final (consumption and investment) and intermediate goods; thus capturing the changing trade relationship between Germany,
the CE4, and other key trading partners. Figure 8 summarizes the peak impact of a 1 percent aggregate demand (private consumption and investment) shock originating either in Germany, or in the non-European blocks of the model (Emerging Asia, the U.S., and remaining countries). This shock is motivated by the
collapse of world trade during the global financial crisis of 2008-09. It shows the percent deviation of real GDP from the baseline in Germany and in the CE4 region.
20. German domestic demand spillovers to the CE4 have increased over time but remain
relatively small, while greater openness has lessened the domestic impact of a pure domestic demand shock originating in Germany. The CE4 is only slightly more vulnerable to domestic demand shocks in Germany in 2011 than in 1996 (similar to other euro area countries), despite far more developed trade links. This is explained by the supply chain nature of the trade integration: final demand in Germany is not the main determinant of CE4 exports to Germany. Meanwhile, the impact on German GDP of an aggregate demand shock originating within Germany has declined
substantially between 1996 and 2011. Germany’s openness has greatly increased over the period, with the export-to-GDP ratio doubling from 24 percent to around 48 percent. Because Germany is more open in 2011, the economy is characterized by more “leakage”, and therefore a lower
domestic impact multiplier. Note that this simulation of an aggregate shock to domestic demand in Germany is virtually identical to modeling the impact of German policy action—for example fiscal contraction (or stimulus) —on the domestic economy and the CE4 countries. German fiscal policy has less domestic impact now than in the 1990s, due to greater openness, and the impact on the CE4 economies is relatively limited because of the nature of trade linkages. To a much larger extent than before, spillovers from German domestic demand are directed towards trade partners outside Europe, including emerging Asia.
-1.0 -0.9 -0.8 -0.7 -0.6 -0.5 -0.4 -0.3 -0.2 -0.1 0.0 -1.0 -0.9 -0.8 -0.7 -0.6 -0.5 -0.4 -0.3 -0.2 -0.1 0.0
Germany CE4 Euro area Germany CE4 Euro area Origin: Germany Origin: Non-Europe
1996 2011
Figure 8. Aggregate Demand Shock
(Real GDP, percent deviation from baseline)
21. Because the GCESC has become more open, spillovers from the rest of the world are now much larger. In response to non-European demand shocks, real GDP in both Germany and the CE4 dips below baseline by considerably more in 2011 than in 1996. This is because both economies have become more open, and are thus more susceptible to fluctuations in global economic activity. The larger downturns are compounded by indirect effects because intra-European economic activity slows down, acting as an additional drag on growth. Also, the size of the “rest of the world”
(especially emerging Asia) has increased disproportionately over time, and the impact of shocks originating here has increased correspondingly.6 Again, simulating a shock to aggregate demand in
the rest of the world is akin to considering co-ordinated policy action in the rest of the world. Thus a fully co-ordinated non-European fiscal action of a given magnitude (in percent of GDP) would have a much greater impact on both the German and CE4 economies than a purely German fiscal action of the same magnitude.
E. The Importance of German Balance Sheets
22. At present balance sheets in Germany are generally healthy. Low debt-to-GDP ratios prevail in the household, corporate and government sectors (Background Note 3). The country’s safe haven status is reflected in the growing and persistent divergence in yields between Germany and other countries in the region.
23. Model simulations suggest that fundamentals in Germany are an important determinant of the magnitude of shock spillovers to CE4 countries. To assess these linkages, the GIMF model was calibrated to an alternative scenario under which Germany has weaker household, corporate, and sovereign balance sheets (see Background Note 3 for details). As before an aggregate demand shock originating in either Germany or the rest of the world (non-European blocks) is shown in Figure 9. The negative impact on real GDP
triggered by the domestic shock is much larger when balance sheets are more fragile in Germany. A key reason is the stronger financial accelerator.7 This makes the German economy much more
6 Although not captured by the model, increasing exposure to the outside world has been accompanied by
concentration risk in certain sectors such as automobiles. An external shock that had a large differential impact on the automobile sector (such as an energy shock), could have a disproportionately large impact on GCESC countries.
7Weaker corporate balance sheets, for example, would be associated with a larger increase in spreads, and a more
severe decline in investment. The decline in economic activity would in turn further impair balance sheets, thereby triggering a vicious cycle.
-1.4 -1.2 -1.0 -0.8 -0.6 -0.4 -0.2 0.0 -1.4 -1.2 -1.0 -0.8 -0.6 -0.4 -0.2 0.0
Germany CE4 Euro area Germany CE4 Euro area Origin: Germany Origin: Non-Europe
Baseline Fragile
Figure 9. Role of German Balance Sheets in Mediating an Aggregate Demand Shock
(Real GDP, percent deviation from baseline)
sensitive to shocks, a situation which is further exacerbated by corporate credit spreads, the higher stock of government debt and greater share of liquidity constrained households. The larger economic contraction in German is also transmitted across borders, causing more pronounced declines in real GDP in CE4 countries and the rest of the euro area. This wider European slowdown then has feedback effects on the GCESC countries. Relatedly, sensitivity to global shocks in CE4 countries (and other euro area countries) increases very considerably under a scenario of fragile German balance sheets. The implication is that healthy German balance sheets have the
characteristics of a public good: they generate positive spillovers that extend well beyond Germany, serving as a buffer against external shocks for the whole GCESC (and beyond).
KEY CONCLUSIONS
This section summarizes the key conclusions and policy dialogue with GCESC country authorities at a conference in Prague on June 14.
24. Conventional trade statistics are a poor guide to bilateral export exposures for supply chain countries. A value added decomposition shows that CE4 countries’ bilateral exposure to final demand in Germany is much less than that implied by the IMF’s DOT statistics, and its exposure to the rest of the world much greater. For Germany, the exposure to European countries (including the CE4) is substantially lower, and exposure to non-European countries higher. Authorities agreed that the value added decomposition was more useful in examining final exposures than bilateral trade statistics. More generally, for analytical purposes they saw merit in examining the consolidated external position of the supply chain countries vis-à-vis the rest of the world, since this would net out supply chain-related intermediate goods trade..
25. The evolution of the GCESC has been supported by large inflows of foreign direct investment (FDI) to CE4 countries. The pattern of capital inflows differs considerably from many other European comparators—such as SP countries—for whom FDI was less important and portfolio inflows more so. In the CE4 countries greenfield investment—which most directly expands
productive capacity—comprised a much larger share of FDI than mergers and acquisitions. Much of the FDI directed to the CE4 countries was in the transport sector, consistent with the rapid
offshoring of the German automobile industry. The Hungarian authorities noted that FDI inflows to their country not only proved more stable during the global crisis, but tended to finance production, whereas portfolio inflows in the pre-crisis period created an unsustainable consumption boom. There was general acknowledgement that the GCESC had been accompanied by substantial FDI inflows, and that such inflows represented the “best” form of external financing.
26. While foreign bank finance has been important in the CE4, cross-border bank flows have been less pronounced. On a consolidated basis, foreign bank financing in the CE4 since 1995 has been at broadly comparable levels to SP countries. But this includes not just cross-border bank flows but also local lending by foreign-owned but domestically resident subsidiaries. The cross-border component—which tends to be the most prone to sudden stops and reversals—was much larger for the SP, whereas local lending, supported by local deposits, was more pronounced in the
CE4. Participants felt that the distinction between cross-border and locally-supported foreign bank financing was a crucial one. Several authorities also noted that penetration by German banks in the CE4 countries was not commensurate with GCESC activities. They pointed to the “first-mover” advantage enjoyed by Austrian banks in the region, and observed that parent company rather than bank funding was used by at least some large supply chain companies.
27. Participation in the GCESC has led to considerable technology transfers to the CE4 countries. Export growth in knowledge-intensive sectors has been particularly rapid in the CE4 countries. The sophistication of domestic VA embodied in overall exports also appears to have increased rapidly. With the exception of Poland, all other CE4 countries have largely “caught up” with Germany’s comparative advantage in knowledge-intensive manufacturing sectors. There was a lively debate about whether export growth in knowledge intensive sectors – especially automobile production – really represented technology transfer and human capital development, or simply entailed low-skilled assembly jobs within a high tech industry. Publically available data are
insufficiently granular to illuminate this distinction. CE4 participants emphasized that while overall the GCESC has undoubtedly created knowledge spillovers, there is heterogeneity across firms in terms of fostering skills. The Czech representatives pointed to Skoda (owned by Volkswagen) as a good example of a company that develops workers’ technical skills: the firm has its own University. Skoda’s Czech operations have evolved towards producing relatively high value added components. The company now owns subsidiary plants in countries such as China, India and Russia, where final assembly is undertaken for several markets. By contrast, other foreign-owned car plants in the Czech Republic specialize in downstream activities.
28. The increase in foreign value added in CE4 exports appears to have spurred domestic value added. The existence of the supply chain creates demand for ancillary products and services in host economies. This contributes to an expansion of the production possibility frontier and spurs overall employment and growth. The complementarity between supply chain activities and domestic production has led overall to greater synchronization of the business cycle among GCESC countries.
The German authorities in particular emphasized the importance of this finding. Production within a vertically specialized chain is not a “zero sum game”. The potential gains in employment as a result of production spillovers should be kept in mind when considering labor market reforms or during
negotiations between industry and labor unions.
29. Integration into the GCESC has accelerated income convergence. Within a sample of European countries, the CE4 economies have generally grown more rapidly over the last two decades than can be explained simply by initial income levels. This is consistent with the evidence regarding technology transfers, enhanced competitiveness in skill-intensive sectors, and positive spillovers from supply chain activities to domestic production. The authorities agreed that GCESC investment and production activities had played a key role in fostering income convergence.
30. The issue of safeguarding enhanced competitiveness in knowledge-intensive sectors received considerable attention. With the progression of income convergence and narrowing of
the GCESC—or indeed, to branch out into more specialized export production activities of their own—the CE4 countries will likely need to continue investing in human capital and upgrading labor skills to cement their comparative advantage in the region. The aspiration should be to move up the value chain, as countries in Asia, notably China, have done. All the authorities agreed that it was important for downstream countries to gradually move towards more sophisticated activities, although the German authorities pointed out that there was no imminent threat to the position of CE4 countries in the value chain despite narrowing cost differentials. German business surveys show that the CE4 countries remain favored destinations of supply chain investment, due to their skilled labor forces and track record in the relevant industries. As noted above, the Czech authorities highlighted Skoda as a successful example of upstream evolution over time. Participants agreed on the importance of technical training to upgrade labor force skills, and felt that much could be learned from the German model of combining vocational education with business apprenticeships. The Czech authorities are considering a scheme offering tax breaks to companies that provide technical education. The Hungarian and Polish authorities pointed out that skills shortages were linked to the wider demographic problem of ageing populations, which will require policy action across several dimensions.
31. German domestic demand spillovers to the CE4 have increased over time but remain
relatively small. This is explained by the supply chain nature of the trade integration: final demand in Germany is not the main determinant of CE4 exports to Germany. As a corollary, German fiscal policies to stimulate or contract domestic demand have a relatively limited impact on CE4 economies. Meanwhile, the impact on German GDP of an aggregate demand shock originating within Germany has declined substantially, due to Germany’s increasing openness. The Slovak authorities noted that there is potentially some tension between the findings of greater business cycle synchronization, and limited domestic demand spillovers from Germany to the CE4. The ensuing discussion clarified the difference between domestic demand spillovers from Germany (which are relatively small), and demand spillovers from Germany related to the production chain (which are large, but originate in countries to which goods are finally exported). The latter can increase business cycle synchronization between Germany and the CE4.
32. Because the GCESC countries have become more open, spillovers from the rest of the world are now much larger. In response to non-European demand shocks, real GDP in both Germany and the CE4 dips below baseline by considerably more in 2011 than in 1996. The larger downturns are compounded by indirect effects because intra-European economic activity slows down, acting as an additional drag on growth. A fully co-ordinated non-European fiscal action of a given magnitude (in percent of GDP) would have a much greater impact on both the German and CE4 economies than a purely German fiscal action of the same magnitude. Authorities agreed that exposure to external shocks had increased substantially with the evolution of the GCESC, and that this represents a key policy challenge going forward. The Hungarian authorities furthermore pointed out that the small size of some of the CE4 countries relative to supply chain firms can be a concern in this context: Nokia’s loss of market share after the financial crisis had a large impact on Hungary’s exports. Participants agreed that diversification of export markets and product lines could help reduce
rate in adjusting to external shocks. Polish, Hungarian and Czech authorities held that a flexible exchange rate provided an important buffer against volatile external demand. But the Slovak
authorities argued that flexible exchange rates were not very helpful in 2008-09, against a background of collapsing external demand. They also noted that a fixed exchange rate reduces currency risk within
the supply chain. Slovakia has enjoyed vigorous growth in exports and GDP under the euro.
33. Balance sheet fundamentals in Germany are an important determinant of the
magnitude of shock spillovers to CE4 countries. At present balance sheets in Germany are generally healthy. Low debt-to-GDP ratios prevail in the household, corporate and government sectors, and the country is regarded by investors as a safe haven. Simulations suggest more leveraged balance sheets and greater sovereign risk in Germany would considerably magnify the impact of external shocks. Thus healthy German balance sheets have the characteristics of a public good: they generate positive spillovers that extend well beyond Germany, serving as a buffer against external shocks for the whole GCESC (and beyond). CE4 participants broadly agreed on the
advantages of the supply chain being anchored by a country with strong fundamentals and low sovereign risk.
GERMAN-CENTRAL EUROPEAN SUPPLY CHAIN—CLUSTER
REPORT—FIRST BACKGROUND NOTE—TRADE LINKAGES
Prepared By B. Augustyniak, C. Ebeke, N. Klein and H. Zhao (All EUR)
INTRODUCTION ___________________________________________________________________________ 3
THE GERMAN-CENTRAL EUROPEAN SUPPLY CHAIN ___________________________________ 5
A. Trends in CE4 Trade Linkages with Germany _____________________________________________ 5
B. Shortcomings of Traditional Trade Statistics _____________________________________________ 7
C. Decomposition of Gross Exports into Domestic and Foreign Value Added ______________ 8
D. The Evolution of Domestic and Foreign Value Added Exports ___________________________ 9
E. Countries’ Export Exposure Based on Final Demand ___________________________________ 12
THE EFFECTS OF THE GERMAN-CENTRAL EUROPEAN SUPPLY CHAIN _______________ 15
A. Technology Transfer ___________________________________________________________________ 15
B. Business Cycles Synchronization _______________________________________________________ 17
C. Income Convergence ___________________________________________________________________ 19
CONCLUDING REMARKS ________________________________________________________________ 21
BOX
1.The Automobile Industry ________________________________________________________________ 13
FIGURES
1. Trade Volumes and Output_______________________________________________________________ 3
2. Bilateral Trade with Germany _____________________________________________________________ 6
3. CE4’s Bilateral Trade with Major Global Players __________________________________________ 7
4. Correlation Between Exports and Imports from Germany (1995–2012) __________________ 8
5. Decomposition of Gross Exports into Value Added Exports ______________________________ 9
6. Composition of Total Exports ____________________________________________________________ 9
7. The Share of Domestic Value Added in Total Gross Exports ____________________________ 10
CONTENTS
TRADE LINKAGES
8. The Change in Foreign and Domestic Value Added in Total Exports, 1995–2009 ______ 10
9. The Share of German Value Added in Total Exports (1995 vs. 2009) ___________________ 11
10. Sectoral Contribution to Exports Growth, 1995–2009 _________________________________ 11
11. Knowledge-Intensive Sectors: The Change in the Domestic and Foreign Value
Added, 1995–2009 ________________________________________________________________________ 11
12. Actual Exposure of the CE-4 Countries Based on the Recipients’ Final Demand, 2009 12
13. Conditional Correlation of Output Gaps ______________________________________________ 17
14. Income Convergence and the Role of Supply Chains _________________________________ 19
TABLES
1. Supply Chain-Related Activities ________________________________________________________ 10
2. Revealed Comparative Advantage (RCA) in Manufacturing ____________________________ 16
REFERENCES _____________________________________________________________________________ 22
ANNEXES
1. The World Input-Output Table _________________________________________________________ 26
2. Decomposition Methodology __________________________________________________________ 27
3. Classification of Merchandise and Services Exports ____________________________________ 31
4. Business Cycle Synchronization ________________________________________________________ 32
5. Income Convergence ___________________________________________________________________ 34
APPENDIX TABLES
1. Business Cycles Synchronization and Its Determinants _________________________________ 33
2. Supply Chains and Income Convergence _______________________________________________ 35
INTRODUCTION
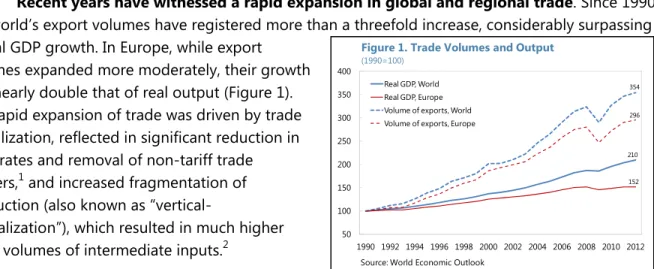
1. Recent years have witnessed a rapid expansion in global and regional trade. Since 1990, the world’s export volumes have registered more than a threefold increase, considerably surpassing global GDP growth. In Europe, while export
volumes expanded more moderately, their growth was nearly double that of real output (Figure 1). The rapid expansion of trade was driven by trade liberalization, reflected in significant reduction in tariff rates and removal of non-tariff trade barriers,1 and increased fragmentation of
production (also known as
“vertical-specialization”), which resulted in much higher trade volumes of intermediate inputs.2
2. The increase in vertical specialization has emerged in response to challenges from increased competition and new opportunities from stronger globalization. Firms have chosen to outsource or shift part of the production process to different locations to exploit efficiency gains, including from differences in wages, productivity, business laws, and taxation.3 Vertical specialization
has been driven by several factors, some related to the reduction of trade costs, including transportation and tariffs (Feenstra, 1997, Miroudot and Ragoussis, 2009), and improvements in communication technology (e.g. the internet), which significantly reduced the costs of information exchange and made it easier for firms to coordinate and monitor production in diverse locations (Hummels et al., 2001).4 As documented in background paper #2, increased financial liberalization,
which encouraged Foreign Direct Investment (FDI), and therefore allowed firms to shift production offshore more easily, also played an important role. Some studies, including Hummels et al. (1998), also suggest that the development of supply chains was in fact needed because goods production today requires more steps than in the past, therefore requiring multiple areas of specialization.
3. Vertical specialization has led to new trade patterns, in which advanced and emerging markets normally play different roles (Riad et al. 2012). Advanced economies tend to be
upstream in the supply chain using relatively limited foreign content in their exports, while emerging
1 In Europe, for instance, the accession to the EU’s single market was accompanied by elimination of impediments for
internal movement of goods and services.
2 Today, more than half of world manufactured imports are intermediates goods and more than 70 percent of world
services imports are intermediates services (OECD, 2012).
3 Numerous empirical studies, using different definitions, data sources and methodologies, find robust evidence of
the growing importance of vertical integration. See Koopman et al. (2011) for an extensive literature survey.
4 Miroudotand Ragoussis (2009), for instance, found that a reduction of 10 percent in distance-related trade costs is
associated with an increase of 9 percent in vertical trade.
210 152 354 296 50 100 150 200 250 300 350 400 1990 1992 1994 1996 1998 2000 2002 2004 2006 2008 2010 2012 Real GDP, World Real GDP, Europe Volume of exports, World Volume of exports, Europe
Figure 1. Trade Volumes and Output
(1990=100)
markets are normally located in the downstream segment of the production chain.5 In Asia, for
instance, Japanese companies have located a large part of the “downstream” production process in the automobile and electronic industries in South East Asian economies, including China, (Koopman et al., 2008), 6 while, in North America, US companies use plants in Mexico for manufactured goods
assembly (“Maquiladoras”, Hummels et al. 1998).
4. In Europe, the emergence of vertical specialization has been particularly evident among German firms (Sinn, 2003, 2006). Proximity to Germany, cultural similarities, and relatively high labor costs differentials7 have led many German firms to shift large parts of their production to
central and eastern European (CEE) countries, most notably in the Czech Republic, Hungary, Poland and Slovakia (CE4, hereafter) either by directly investing there or by purchasing intermediate inputs from local firms.8 This pattern is particularly evident in the automobile industry where increased
competition in both domestic and foreign markets triggered a rapid process of international outsourcing of manufacturing activities (Box).
5. Against this background, the primary objective of this chapter is to look at the CE4’s integration into the supply chain with the aim of assessing the magnitude and effects of this process. In particular, the chapter focuses on the following main questions:
To what extent have the CE4’s bilateral trade links with Germany changed over time, and do they differ from the trends observed in other European countries?
What is the CE4’s role in the German-Central European Supply Chain (GCESC) and which are the main sectors that participate in the GCESC?
How has integration into the GCESC affected the CE4 countries both individually and as a group?
6. Evaluating recent trends in the CE4’s trade linkages with Germany would shed light on the benefits and challenges of the integration process. While closer integration into the GCESC should lead to positive spillovers in terms of productivity gains (including from technology transfer) and external competitiveness, thereby engendering faster economic development and income
5 Countries upstream normally produce the raw materials or intangibles involved at the beginning of the production
process (e.g., research, design), while countries downstream do the assembly of processed products or specialize in customer services (OECD, 2012).
6 Koopman et al. (2008) show that, on average, foreign companies contribute 80 percent or more of the VA
embodied in Chinese exports of computers, and office telecom equipment.
7 Sinn (2006) points to the excessive wages growth in Germany as one of the main factors for the fragmentation of
production.
8 According to a survey by Cologne Institute for Business Research (IW, 2002), by 2002, close to 60 percent of the
growth, it could in principle pose some challenges going forward. Higher concentration of trade could also imply that the CE4’s dependency on the German economy has increased with
ramifications for business cycle co-movement and vulnerabilities to shocks. Moreover, sustaining a country’s role in the supply chain and continuing to derive the associated benefits could involve policy effort. Policies taken by the CE4 members should ultimately aim to safeguard the benefits of the GCESC while mitigating any risks related to greater exposure to the German economy.
7. This chapter is structured as follows: The next section provides some stylized facts on recent trends in Germany’s bilateral trade links with the CE4, and, in light of challenges related to the interpretation of trade statistics in the context of supply chains, it looks at a decomposition of exports into domestic and foreign value added (VA) and assesses how they have changed over time. This section also evaluates Germany’s and the CE4’s exposure to other countries based on their final consumption and compares it to the exposure under the commonly used gross bilateral trade statistics published in the IMF Direction of Trade Statistics (DOTS). The following section examines the effects of the GCESC on the CE4 countries, with a particular focus on technology transfer, business cycles synchronization, and income convergence. The final section provides concluding remarks.
THE GERMAN-CENTRAL EUROPEAN SUPPLY CHAIN
A. Trends in CE4 Trade Linkages with Germany
8. The CE4’s trade links with Germany have strengthened considerably since the
mid-1990s, largely reflecting their increased integration into the GCESC (Figure 2). Between 1995 and 2011, the CE4’s imports from Germany grew by 8½ percent of GDP on average (cumulative basis), with Czech Republic leading the way (10½ percent of GDP), while exports to Germany increased sharply by nearly 10 percent of GDP on average. Consequently, Germany has become the main trading partner (with the largest export and imports as a share of GDP) of all the CE4 countries.
9. Compared with other countries, including CEE economies, the CE4 exhibits the
strongest trade linkages with Germany. The CE4’s average imports from Germany stood in 2012 at 16 percent of GDP, which, apart from Austria–which traditionally has a high German import content–is well above other European countries. Similarly, the average of the CE4’s exports to Germany in 2012 stood at 18 percent of GDP, behind only the Netherlands (22 percent of GDP). A closer look at the sectoral level suggests that knowledge-intensive sectors, particularly transport and electrical equipment, account for the CE4’s largest bilateral trade with Germany. As documented in the next section, the increased links in these sectors have led to the transfer of technology, which in turn has translated to sizeable gains in terms of comparative advantage.
10. While trends are similar, the CE4 is not a homogenous group (Figure 2). Poland’s trade linkages with Germany (as a share of GDP) are significantly less than those in other CE4 countries, largely due to Poland’s large GDP (Poland’s GDP is about 54 percent of the CE4’s GDP) and higher
7.2 2.5 4.6 9.5 18.6 20.3 25.1 0 5 10 15 20 25 30 -5 0 5 10 15 20 Other Big Euro* European Selected
Countries ** Other
CEE*** Poland Slovak Rep. Hungary Czech Rep. Change in Percent of GDP, 1995-2012 (LHS)
Exports to Germany in Percent of GDP, 2012 Exports to Germany
Sources: Direction of trade statistics and WEO.
* Other Big Euro includes Austria, Belgium, France, Italy, and the Netherlands. ** Selected European Countries includes Greece, Ireland, Portugal, and Spain.
*** Other CEE includes BiH, Bulgaria, Croatia, Estonia, Latvia, Lithuania, Macedonia, Romania, Slovenia, and Ukraine.
6.6 2.8 6.5 10.5 15.4 18.5 21.0 0 5 10 15 20 25 -2 0 2 4 6 8 10 12 Other Big Euro* Selected European Countries** Other CEE*** Poland Slovak Rep. Hungary Czech Rep. Change in Percent of GDP, 1995-2012 (LHS)
Imports from Germany in Percent of GDP, 2012 Imports from Germany
share of domestic demand, which mechanically dampens the magnitude of the trade intensity with Germany as compared to other CE4 economies. In this regard, although Poland’s openness has increased in recent years, it remains a relatively closed economy with the sum of overall imports and exports at 74 percent of GDP (compared to an average of 157 percent of GDP in rest of the CE4 countries).
Figure 2. Bilateral Trade with Germany
11. The importance of Germany as a major trading hub for the CE4 is illustrated in Figure 3. The thickness of the arrows represents the share of imports (exports) relative to recipient (exporter) GDP and the bubble size indicates the country’s total imports (exports) to GDP. The charts clearly show that, among the major global players, Germany is the largest trading partner for the CE4. For Czech Rep, Hungary, and Slovakia, imports from Germany are between 15 to 21 percent of the countries’ GDP while exports to Germany amount to 16 to 24 percent of GDP. For Poland, Germany’s exports and imports shares are somewhat lower, due to Poland’s higher GDP level and less dependence on external trade, yet with exports and imports at 10-11 percent of GDP, Germany remains Poland’s major trading partner.
Figure 3. CE4’s Bilateral Trade with Major Global Players
Imports to CE4 Exports from CE4
* Source: Direction of Trade statistics and WEO. * The arrows point to the receiving country.
* Line thickness indicates imports (exports) values relative to recipient’s (exporter) GDP. * The bubble size is proportional to the country’s total imports (exports) to GDP.
12. The CE4’s high degree of integration into the supply chain reflects a host of factors. Beyond the geographic proximity to Germany, cultural similarities, and high unit labor cost differentials,9 the countries share a similar sectoral structure, which suggests that they have
adequate labor skills to support the GCESC.10 In this context, Rahman and Zhao (2013) computed
the industrial similarity index relative to Germany. They showed that the CE4 countries had strong similarities with Germany even before they integrated into the supply chain.
B. Shortcomings of Traditional Trade Statistics
13. Vertical specialization networks have created challenges for interpreting official trade statistics. Trade statistics are usually measured in gross terms, which include both intermediate and final goods. In supply chain-related activities, particularly when imported intermediates are re-exported after some processing, export figures tend to be inflated and do not adequately reflect the countries’ domestic VA, which matters most for domestic employment and economic growth.
9 The average exchange rate-adjusted unit labor cost differential between the German manufacturing sector and that
in the CE4 during 1995-2009 ranged between 35 percent (Poland) and 58 percent (Hungary).
10Among others, these variables were found to have a significant contribution to the share foreign VA in countries’
14. The shortcomings of trade statistics in supply chain-integrated countries are
illustrated in the high and positive correlation of the CE4 countries’ import from and exports to Germany (Figure 4). This is in contrast to
much lower correlations for other countries vis-à-vis Germany. This may owe partly to high business cycles synchronization, but also suggests that a large part of the CE4’s exports to Germany contains German intermediates, which were imported and then processed in the CE4 as part of the fragmented production process. The high correlation may also suggest that the share of the CE4’s foreign VA in these products is relatively high.
C. Decomposition of Gross Exports into Domestic and Foreign Value
Added
15. To evaluate the CE4’s role in the GCESC, we decompose gross exports into VA exports using the newly released World Input-Output Table (WIOT). We follow the Hummels et al. (2001) measure of vertical specialization by looking at the import content of production for exports. This measure was used in several studies, including Chen et al (2005), Johnson and Noguera (2012), Koopman et al. (2011), and more recently, in Rahman and Zhao (2013), and is different from the definition used in earlier studies such as Feenstra and Hanson (1996), which mainly focused on documenting trends in outsourcing, usually defined as the imported input shares of gross output or of material inputs.11
16. The analysis builds on the conceptual framework developed by Koopman et al. (2011).
It decomposes gross exports into five main categories depending on the location of VA and stage of production (Figure 5). These include: (1) domestic VA (DVA) in final goods, (2) DVA in intermediate goods not processed for further exports, (3) DVA in intermediate goods processed for exports to third countries, (4) DVA exported to another country but returns back to the original country for exports to a third country, and (5) foreign VA (FVA) used as input into exports.
11 The WIOT provides an annual time series for 1995-2009 for 35 sectors and covers forty countries, including all EU
27 countries and 13 other major advanced and emerging economies (see details in Annex 1).
-0.4 -0.2 0 0.2 0.4 0.6 0.8 1 Other Big Euro* EuropeanSelected
Countries** Other
CEE*** Poland Slovak Rep. Hungary Czech Rep.
Sources: Direction of trade statistics and WEO.
* Other Big Euro includes Austria, Belgium, France, Italy, and the Netherlands. ** Selected European Countries includes Greece, Ireland, Portugal, and Spain.
*** Other CEE includes BiH, Bulgaria, Croatia, Estonia, Latvia, Lithuania, Macedonia, Romania, Slovenia, and Ukraine. .
Figure 4. Correlation between Exports and Imports from Germany (1995-2012)
Figure 5. Decomposition of Gross Exports into Value Added Exports
Source: Koopman et al. (2011), and Rahman and Zhao (2013).
17. The decomposition of the five-category VA is computed for manufacturing and
services exports respectively (Annex 2). Components (1)-(4) measure the value of exports that are created domestically. Components (1)-(2) reflect the countries’ stand-alone exports, i.e. outside the supply chain, while components (3)-(5) indicate supply chain-related exports. These have two components: upstream (components (3)-(4)), which include DVA that is processed for further exports, and downstream (component (5)). A large share of FVA in total exports would generally indicate that a country is a downstream participant in the supply chain, usually specializing in processing and assembly functions.
D. The Evolution of Domestic and Foreign Value Added Exports
18. Over the last 15 years, the share of FVAin the exports of CE4 countries and Germany has increased considerably (Figure 6). Among the CE4 countries, Hungary registered the sharpest increase (14 percentage points) bringing the share of FVA in exports to the highest level (43 percent), while Poland, which continues to maintain a relatively high share of domestic value exports, registered the smallest increase in FVA. The share of German VA in the CE4’s exports increased by about 2 percentage points, with the exception of
Gross Exports DVA FVA Exported as final goods (1) Exported as intermediates not processed for further exports (2) Exported as intermediates processed
for re-export to third countries (3) Exported as intermediates that return to home countries (4) Other countries’ DVA as intermediates (5) 70 59 71 57 83 71 68 58 83 76 8 10 5 9 4 6 5 7 21 31 24 34 13 23 27 34 17 24 0 20 40 60 80 100 120 1995 2009 1995 2009 1995 2009 1995 2009 1995 2009
CZE HUN POL SVK DEU
Other countries' VA German VA Domestic VA Figure 6. Composition of Total Exports
(Percent)
Hungary (4 percentage points). Beyond higher German VA that is embodied in the CE4’s exports, the increased integration into the GCESC has also led to:
Higher intermediates from other countries (captured by “other countries’ VA”) to support the GCESC’s related activities, and;
Increased intermediates that are exported by the CE4 to Germany for further processing (Table 1).
Table 1. Supply Chain-Related Activities
Intermediates from DEU embodied in the CE4’s exports (Percent of total CE4’s exports)*
Intermediates from CE4 embodied in DEU’s exports (Percent of total CE4’s exports)*
1995 2009 1995 2009
CZE 8.45 9.75 5.53 5.82
HUN 5.31 8.52 3.09 3.77
POL 4.08 6.07 5.77 5.59
SVK 4.63 7.20 3.68 4.20
*The calculation of intermediates includes only the countries’ domestic value added.
19. The counterpart to the increasing share of FVA in exports is a substantial secular decline in the share of DVA (Figure 7). A closer look at the evolution of the shares over time suggests that the lion’s share of the decline in DVA occurred during the 1995-2002 period, while, during the “boom years” (2003-2008), it contracted only moderately until it reached a trough in 2008. In 2009, however, the share of DVA increased by about 4-5 percentage points on average, suggesting perhaps that supply chain-related activities were adversely affected by the global financial crisis, in part due to high exchange rate volatility, thus leading companies to consolidate their operations and perhaps switch back to domestic suppliers. This is consistent with the OECD’s findings regarding the decline in the length
of the value chains during 2008-09 (OECD, 2012). AUT
BEL BGR CYP CZE DEU DNK ESP EST FIN FRA GBR GRC HUN IRL ITA LTU LVA MLT NLD POL PRT ROM RUS SVK SVN TURSWE -5 0 5 10 15 20 -10 -5 0 5 10 15 20 25 Th e Cha ng e in D om es tic V A
The Change in Foreign VA
Figure 8. The Change in Foreign and Domestic Value Added in Total Exports, 1995-2009
(Percent of GDP)
Only CE4
Source: IMF staff calculations based on the WIOT.
50 55 60 65 70 75 80 85 1995 1997 1999 2001 2003 2005 2007 2009
Czech Rep. Hungary Poland Slovakia Germany
Figure 7. The Share of Domestic Value Added in Total Gross Exports (Percent)
20. While the shares of DVA in gross exports have broadly declined, they have increased significantly in nominal terms and as a percentage of GDP (Figure 8).
Between 1995-2009, Hungary, Germany, Poland, and Czech Rep., registered an increase of 14, 10½, 8 and 5½ percentage points of GDP, respectively, while Slovakia recorded the smallest increase (1 percentage point of GDP). The increase in domestic VA was positively correlated with the increase in FVA. In this regard, Rahman and Zhao (2013), who examine the relationship between foreign and domestic VA growth across 40 countries during 1995-2008, found a positive and significant link. Moreover, they find econometric
evidence that causality runs from growth in FVA to DVA. In other words FVA is not a substitute to domestic VA but tends to complement the production process and spur overall employment and growth.
21. The increase in FVA in the CE4 is related to the German VA increase in both nominal and relative terms. In this regard, the CE4 group stands out when comparing the share of the German VA to that in other European countries; they are the only countries that recorded a significant increase in German VA as a share of total exports (Figure 9).
22. The sectoral decomposition shows that the knowledge-intensive sectors (transport and electrical equipment, machinery and chemicals) made the largest contribution to export growth in the period 1995-2009 (Figure 10).12 In Czech Rep., Hungary and
Slovakia, these sectors contributed