2011 FUEL CELL
TECHNOLOGIES
MARKET REPORT
Authors
This report was a collaborative effort by staff of the Breakthrough Technologies Institute, Inc., in Washington, DC.
Acknowledgement
The authors relied upon the hard work and valuable contributions of many men and women in government and in the fuel cell industry. The authors especially wish to thank Sunita Satyapal and the staff of the US Department of Energy’s Fuel Cell Technologies Program for their support and guidance. The authors also wish to thank Rachel Gelman of the National Renewable Energy Laboratory and the many others who made this report possible.
Contents
List of Figures ...v
List of Tables ...vi
List of Acronyms ...vii
Introduction ...1
Financial Data ...3
Cost Reduction ...3
Revenues, Assets, and R&D Expenses ... 4
Venture Capital and Private Equity ... 6
Shipments ... 9
Government Policy, Standards, and Regulation ... 12
Applications and Market Assessment ...14
Materials Handling ...14
Stationary Power ...16
Prime Power ... 17
Micro Combined Heat and Power... 21
Backup and Remote Power ... 23
Transportation ...24
Light Duty Vehicles ... 25
Fuel Cell Buses ... 27
Other Transportation Applications ... 28
Hydrogen Infrastructure and Delivery...30
Energy Storage ... 32 Military ...34 Portable/Micro ... 35 New studies in 2011 ...36 Intellectual Property ...38 Spotlight on Germany ... 40
Appendix I: Company Profiles ...43
Public Companies ...43
Ballard Power Systems, Inc. ...43
Ceramic Fuel Cells Limited...44
FuelCell Energy, Inc. ...45
Hydrogenics Corporation ... 47 ITM Power ...48 Panasonic ...49 Plug Power ...49 SFC Energy AG ...50 Toshiba ... 52 UTC Power ... 53 Private Companies ...54 Bloom Energy...54 ClearEdge Power ...54
Horizon Fuel Cell Technologies ...56
IdaTech ... 57
Microcell Corporation ...58
Nedstack ...59
Nuvera Fuel Cells ...59
Oorja Protonics ...60
ReliOn, Inc. ... 61
Ultra Electronics, AMI ...62
Auto Manufacturers ...63
Daimler AG ...63
General Motors ...64
Honda ...65
Hyundai Motor Company ...66
List of Figures
Figure 1: Projected Fuel Cell Transportation System Costs per kW, Assuming High Volume Production
(500,000 units per year) ...3
Figure 2: Projected Fuel Cell Transportation System Costs per kW Across a Range of Manufacturing Volumes, 2007 and 2011 ...3
Figure 3: FuelCell Energy Cost Reduction ... 4
Figure 4: Worldwide Venture Capital (VC), Private Equity (PE), Over-the-Counter (OTC), and Private Investment in Public Equities (PIPE) Investments in fuel cell companies (2009 – 2011) ... 6
Figure 5: US Venture Capital (VC), Private Equity (PE), Over-the-Counter (OTC), and Private Investment in Public Equities (PIPE) Investments in fuel cell companies (2009 – 2011) ... 6
Figure 6: Fuel Cell Systems Shipped by Application, World Markets: 2008-2011... 9
Figure 7: MW of Fuel Cells Shipped by Application, World Markets: 2008-2011 ... 9
Figure 8: Fuel Cell Systems Shipped by Application, Manufactured in North America and Asia: 2008-2011 ...10
Figure 9: Fuel Cell Systems and MWs Shipped by Country of Manufacture: 2008-2011 ...10
Figure 10: Fuel Cell Systems Shipped by Application, Manufactured in Europe: 2008-2011 . ... 11
Figure 11: Cost Reduction Pathways for FCEVs ... 25
Figure 12: Toyota FCV-R concept vehicle ... 25
Figure 13: Mercedes F125! concept vehicle ...26
Figure 14: CHIC fuel cell bus in London ... 27
Figure 15: Vision Motors’ Tyrano fuel cell electric truck ...28
Figure 16: A customer fills up on hydrogen derived from renewable biogas at the Orange County Sanitation District , Fountain Valley, CA ... 31
Figure 17: Sage Mill refueling station, SC ... 32
Figure 18: Block Diagram of Ramea Island Wind to Hydrogen System. ...33
Figure 19: US Patent and Trademark Office Clean Energy Patent Awards By Sector, 2002-2011 ...38
Figure 21: Fuel Cell Patents by Country (Top Ten) and by Region ...39
Figure 20: Top Ten US Patent and Trademark Office Fuel Cell Patent Assignees, 2002-2011 ...39
Figure 22: NOW Sees Hydrogen Playing a Key Role in Germany’s Energy Future ... 40
Table 1: Gross Revenues and Cost of Revenue for Select Public Fuel Cell Companies ... 4
Table 2: R&D Expenditures for Select Public Fuel Cell Companies ...5
Table 3: Total Assets and Liabilities for Select Public Fuel Cell Companies...5
(Thousands USD, unless footnoted) ...5
Table 4: Top Ten Disclosed Venture Capital and Private Equity Investors in Fuel Cells and Hydrogen, By Company and By Country (2011) ...7
Table 5: Top Ten Venture Capital and Private Equity Investors in Fuel Cells and Hydrogen, By Company and By Country (Cumulative 1/1/2000 – 12/31/2011) ...8
Table 6: Commercially Available Materials Handling Fuel Cells 2011 ...14
Table 7: Notable Plug Power 2011 GenDrive® Sales ... 15
Table 8: Commercially Available Stationary Fuel Cells 2011 ...16
Table 9: Summary of Bloom Energy US Projects 2011 ... 17
Table 10: Summary of UTC Power US Projects 2011...18
Table 11: Summary of FuelCell Energy Projects 2011 ...19
Table 12: Summary of FuelCell Energy Federal Agency Funding Awards 2011 ...19
Table 13: Summary of ClearEdge Power US Projects 2011 ... 21
Table 14: Summary of Ceramic Fuel Cells Limited International Sales 2011... 22
Table 15: Commercially Available Fuel Cells for Transportation 2011 ...24
Table 16: Commercially Available Hydrogen Fueling Systems 2011 ...30
Table 17: US Military Fuel Cell Projects Funded in 2011 ... 35
Table 18: Commercially Available Portable and Micro Fuel Cells 2011 ... 35
Table 19: Percentage Fuel-Consumption Reduction (mi/gal gasoline equivalent or MPGGE) by 2045, Compared to 2010 Gasoline Conventional Powertrain ... 37
List of Tables
APU Auxiliary power unit mpg Miles per gallon ARRA American Recovery and Reinvestment
Act
MW Megawatt
CEP Clean Energy Partnership nm Nanometer
CFCL Ceramic Fuel Cells Limited NOW National Organization for Hydrogen, Germany
CHP Combined heat and power OEM Original Equipment
Manufacturers CHIC Clean Hydrogen in European Cities
Project
OTC Over the counter (investment)
CO2 Carbon dioxide PAFC Phosphoric acid fuel cell
DLA Defense Logistics Agency PE Private equity
DoD Department of Defense PEM Proton exchange membrane
DOE Department of Energy PIPE Private investment in public equities
DFC Direct Fuel Cell PV Photovoltaic
DMFC Direct methanol fuel cell R&D Research and development
FCE FuelCell Energy RV Recreational vehicle
FCEV Fuel cell electric vehicle SECA Solid State Energy Conversion Alliance
gge Gallon gasoline equivalent SGIP Self-Generation Incentive Program
GM General Motors SOFC Solid oxide fuel cell
H2I Hawaii Hydrogen Initiative TGC The Gas Company
K2 K2 Pure Solutions UAV Unmanned aerial vehicle
kg Kilogram UK Uniter Kingdom
km/h Kilometer per hour US United States
kW Kilowatt VC Venture capital
kWh Kilowatt-hour W Watt
MCFC Molten carbonate fuel cell Wh Watt-hour
m-CHP Micro-combined heat and power
List of Acronyms
Introduction
Fuel cells are electrochemical devices that combine hydrogen and oxygen to produce electricity, water, and heat. Unlike batteries, fuel cells continuously generate electricity, as long as a source of fuel is supplied. Fuel cells do not burn fuel, making the process quiet, pollution-free and two to three times more efficient than combustion. A fuel cell system can be a truly zero-emission source of electricity, when the hydrogen is produced from non-polluting sources.
There are three main markets for fuel cell technology: stationary power, transportation power, and portable power. Stationary power includes any application in which the fuel cells are operated at a fixed location, either for primary or for backup power, or for combined heat and power (CHP). Transportation applications include motive power for cars, buses, and other fuel cell electric vehicles (FCEV), specialty vehicles, materials handling vehicles (e.g. forklifts) and auxiliary power units (APUs) for highway and off-road vehicles. Portable power applications use fuel cells that are not permanently installed or fuel cells in a portable device. This report provides an overview of trends in the fuel cell industry and markets, including product shipments, market development, and corporate performance in 2011. Trends include:
• Commercial markets expanded significantly, especially in the materials handling industry, where more than 3,000 fuel cell forklifts were either deployed or on order in the United States at the end of 2011.
• ReliOn and Plug Power were both named to Deloitte’s Technology Fast 500, a ranking of the fastest growing technology, media, telecommunications, life sciences and clean technology companies – both public and private – in the United States and Canada.
• The use of power purchase agreements in the stationary market continued to increase, enabling customers to purchase fuel cell power and heat without owning the fuel cell itself.
• New, independent studies highlighted the key role hydrogen should play in balancing the grid of the future, quantified the benefits of federal research support for
Notable in 2011
Total, worldwide fuel cell shipments grew 37.5% between 2010 and 2011 and 214% between 2008 and 2011. Venture capital and private equity investments in fuel cells and hydrogen increased worldwide by 276% between 2010 and 2011. Venture capital and private equity investments in US fuel cell companies grew by 553.5% during the same period. A UTC Power fuel cell on a transit bus in California surpassed 10,000 operating hours in real-world service with its original cell stacks and no cell replacements. Vision Motors provided the world’s first fuel cell plug-in hybrid class 8 and terminal tractor trucks to the ports of Long Beach and Los Angeles. A report by the Energy Department concluded that, in the long term, fuel cell electric vehicles offer the greatest potential to displace petroleum consumption in the transportation sector, and they can do so at a competitive cost.
FuelCell Energy secured a 70 MW order from POSCO Power in South Korea, the largest order ever received by the company.
fuel cells and hydrogen, and affirmed that fuel cells in the transportation sector provide the best opportunity in the long term to reduce petroleum consumption and greenhouse gas emissions.
• There was increased interest in Europe to use hydrogen and fuel cells for grid-scale energy storage, primarily to balance the intermittent and volatile nature of renewable power sources, such as wind and solar.
• California continued to build hydrogen stations for FCEVs, with two new public access hydrogen stations commissioned in 2011. As of the date of this report,
California had nine public access stations, fourteen private access stations, and fourteen additional stations that were either funded or in development.
• Fuel cells continue to receive far more patents than other renewable energy technologies, with fuel cells receiving more than 950 patents in 2011 and solar receiving the second greatest number of patents, at roughly 550. However, Asia appears to be overtaking North America and, in particular, Japan appears to be overtaking the United States in terms of fuel cell patents issued. If this trend continues, it suggests that North America and the United States may cede leadership in the fuel cell industry to Asia and Japan, similar to what has occurred in other high technology industries.
Fuel cell technologies have made great progress in meeting cost reduction goals, system longevity and durability. However, progress on cost reduction for both fuel cells and hydrogen must continue, and the availability of public hydrogen fueling stations must substantially increase, especially stations that provide hydrogen produced from renewable sources. Performance and durability of fuel cells also must continue to improve, especially for transportation applications. Public awareness of hydrogen and fuel cells remains low, requiring further outreach and education from the industry. Finally, safety regulations and product standards in many countries need to be revised to reflect current
experience and to ensure better harmonization.
The world’s first “trigeneration” fuel cell facility opened in California, producing electricity, heat, and hydrogen from bio-gas produced at the Orange County Sanitation District's wastewater treatment plant in Fountain Valley. The fuel cell produces 250 kW of electricity and enough hydrogen to supply up to 50 FCEVs per day.
A plant opened in Germany that uses wind power to produce hydrogen through a 500 kW electrolyzer. The hydrogen is then co-fired with biogas to balance short term fluctuations in the wind power and also is used as fuel for hydrogen vehicles.
The Delaware Public Service Commission approved a plan whereby Bloom Energy will install 30 MW of fuel cells at two Delmarva Power substations and open a manufacturing facility at a former Chrysler plant.
Financial Data
This section provides information regarding fuel cell cost reduction as well as revenues, cost of revenue, and other key data for selected publicly traded fuel cell companies that have fuel cells as their primary business. The focus is on public companies because many private companies do not release financial information. Finally, this section discusses venture capital, private equity, and other investment activity within the industry.
Fuel cell companies continued to operate with significant though in some cases declining losses. Several companies are on the road to profitability, reached through aggressive cost cutting and increased economies of scale due to commercial sale of products.
Cost Reduction
Fuel cell costs continue to decline significantly for light duty vehicles, with projected volume costs reduced more than 80% since 2002 and 30% since 2008, according to the DOE.1 Platinum content has been reduced by a factor of five and is currently at less than 0.2g/kilowatt (kW), with a DOE target of 0.125g/kW. Fuel cell durability has more than doubled.
As shown in Figure 1, the projected cost per kW of a transportation fuel cell system dropped to under $50/kW for the first time in 2011. More than half of this cost is for balance of plant, not the fuel cell itself. Moreover, compared with 2007, the projected transportation system cost per kW in 2011 is
significantly lower than it was in 2007 across a wide range of annual production rates. (See Figure 2). Ballard Power Systems reported that it decreased the cost of its materials handling fuel cell stacks by 55% since 2008. Ballard supplies its stacks primarily to Plug Power, which integrates the fuel cells
systems into various materials handling vehicles.
Similar cost reductions are being realized with stationary fuel cells. For large stationary, UTC Power reports a nearly 50% cost reduction for its PureCell Model 400 in 2011 as compared with 2009.2 FuelCell Energy has reduced costs from nearly $10,000/kW in 2003 to roughly $3,000/kW in 2011 (see Figure 3).3
Regarding small stationary fuel cells, ReliOn reported that it is achieving a 40% cost reduction with each new generation of a typical 4-kW fuel cell installed outdoors with hydrogen
storage.4 On April 1, 2011, Tokyo Gas introduced its 2011 model year residential fuel cell for the
Figure 2: Projected Fuel Cell Transportation System Costs per kW Across a Range of Manufacturing Volumes, 2007 and 2011. Source: DOE
Figure 1: Projected Fuel Cell Transportation System Costs per kW, Assuming High Volume Production (500,000 units per year). Source: DOE
ENE-FARM program, achieving a 30% manufacturing cost reduction compared with the previous model. The customer price was reduced by 21% to 2.76 million yen (roughly $34,000 US dollars).5
The cost for producing and dispensing hydrogen also continues to decline. For distributed production, the projected cost of hydrogen (dispensed and untaxed) through natural gas reforming is now below $4 per gallon gasoline equivalent (gge), within DOE’s target
range of $2-$4/gge.6 The projected cost of hydrogen (dispensed and untaxed) through electrolysis and bio-derived liquids is now around $6/gge, down from nearly $8/gge in 2006.
Revenues, Assets, and R&D Expenses
Fuel cell companies derive revenue from the sale of fuel cells and related equipment (such as hydrogen generators), support and maintenance contracts, and from contract research and development. A recent trend, especially in the large stationary market segment, is for companies to derive revenue through the sale of electricity and in some cases waste heat. This is typically accomplished through a power purchase agreement, whereby the end user agrees to purchase the electricity and/or heat generated by the fuel cell for a period of years, often at a fixed rate. The fuel cell company maintains ownership of the fuel cell and provides maintenance and support.
Tables 1 through 3 provide financial data for select public companies. These companies were selected because fuel cells are their primary product, and because they are traded on major stock exchanges. IdaTech was included in previous editions of this report but has been removed because it is no longer a publicly traded company.
As shown in Table 1, gross revenues of publicly traded fuel cell companies continue to increase. At
the same time, however, the cost of revenue also tends to be increasing, although in some cases the difference between gross revenues and cost of revenues is declining, reflecting improved prospects for profitability.
Table 1: Gross Revenues and Cost of Revenue for Select Public Fuel Cell Companies
(Thousands USD except where noted)
North American Companies
2011 2010 2009
Gross
Revenues RevenueCost of RevenuesGross RevenueCost of RevenuesGross RevenueCost of
Ballard Power Systems 76,009 62,124 65,019 54,887 46,722 40,795
FuelCell Energy 1 122,570 135,180 69,777 88,430 88,016 118,027
Hydrogenics Corp. 23,832 18,344 20,930 15,504 18,841 15,113
Plug Power 27,626 36,901 19,473 29,482 12,293 19,680
TOTALS (USD) 250,037 252,550 175,199 188,303 165,872 193,615 Other Companies
Ceramic Fuel Cells Ltd 2 3 3,681 29,142 2,033 21,940 1,679 48,667
Ceres Power 2 4 692 17,702 786 14,543 952 10,734
SFC Energy AG 5 15,425 10,056 13,330 9,288 11,687 8,493
1 Year ends October 31 2 Year ends June 30 3 $AUS Thousands 4 £ Thousands 5 € Thousands
Figure 3: FuelCell Energy Cost Reduction. Source: FuelCell Energy.
Table 2: R&D Expenditures for Select Public Fuel Cell Companies (Thousands USD, unless footnoted)
North American
Companies 2011 2010 2009
Ballard Power Systems 21,623 23,766 26,628
FuelCell Energy 1 7,830 10,370 10,994
Hydrogenics Corp. 2,934 3,445 5,219
Plug Power 5,656 12,901 16,324
TOTALS (USD) 16,420 50,528 59,165
Other Companies
Ceramic Fuel Cells
Limited 2 3 15,127 10,257 9,861
Ceres Power 2 4 12,869 9,907 6,308
SFC Energy AG 5 2,537 1,891 1,507
1 Period ending October 31 2 Period ending June 30 3 $AUS Thousands 4 £
Thousands 5 € Thousands
As seen in Table 2, most companies continue to show decreases in R&D expenditures in 2011 over 2010. This continues the trend, as discussed in previous editions of this report, of companies focusing increasingly on product development and manufacturing, rather than R&D.
Table 3 shows that some companies increased assets between 2010 and 2011, while others saw asset reductions. At the same time, most companies showed increases in liabilities over the same period. This continues a general trend cited in previous editions of this report.
Table 3: Total Assets and Liabilities for Select Public Fuel Cell Companies
(Thousands USD, unless footnoted)
North American Companies
2011 2010 2009
Assets Liabilities Assets Liabilities Assets Liabilities
Ballard Power Systems 165,290 69,970 189,788 61,913 195,348 36,428 FuelCell Energy 1 183,630 137,224 150,529 66,136 162,688 56,420 Hydrogenics Corp. 31,061 18,309 31,473 13,937 36,808 18,244 Plug Power 55,656 26,620 59,177 16,264 164,185 75,915 TOTALS 436,049 247,661 430,967 158,160 559,029 188,091 Other Companies Ceramic Fuel Cells Limited 2 3 42,785 9,250 33,275 7,229 50,941 2,451 Ceres Power 2 4 33,873 6,465 47,054 6,437 27,081 5,688 SFC Energy AG 5 48,782 11,994 46,312 4,591 50,442 4,581
1 Period ending October 31 2 Period ending June 30 3 $AUS Thousands 4 £
Venture Capital and Private
Equity
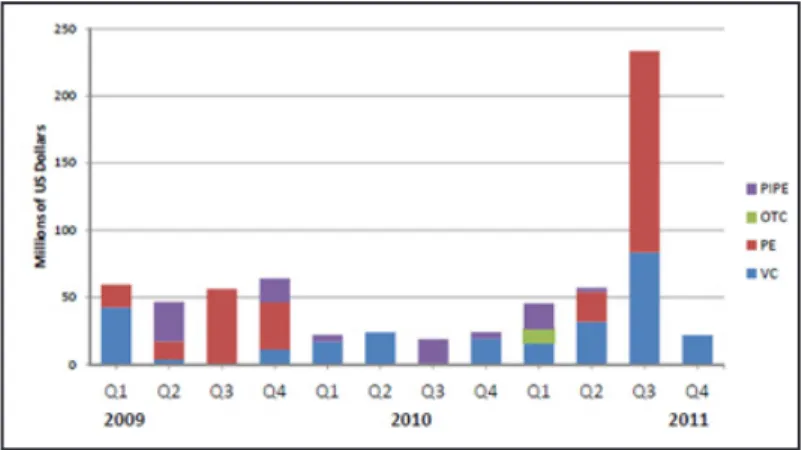
Cumulative global investment in fuel cells and hydrogen totaled roughly $731.9 million between 2009 and 2011.1 The vast majority of these investments ($671.4 million) were in fuel cell companies. Figure 4 provides a breakdown by quarter and by investment type.
The $731.9 million invested between 2009 and 2011 represents an increase of nearly $102 million over the total fuel cell and hydrogen investment between 2008 and 2010, as reported in the 2010 edition of this report.7 Moreover, global venture capital and private equity investments in hydrogen and fuel cells nearly quadrupled between 2010 and 2011 – rising from $86.5 million to $325.2 million.
Much of the growth between 2010 and 2011 is due to $150 million in fuel cell private equity investments made in a US company or companies recorded in the third quarter of 2011. This was by far the most invested in fuel cells in any single
quarter between 2006 and 2011. However, even if this $150 million is excluded from the 2011 total, global private equity and venture capital investment doubled between 2010 and 2011, suggesting broad growth in investment activity.
Venture capital and private equity investment in US fuel cell companies totaled $389.4 million between 2009 and 2011, more than half of the global total. Moreover, venture capital and private equity investment in US companies grew by more than six fold between 2010 and 2011, rising from $42.8 million to $279.7 million. If the $150 million investment in the third quarter of 2011 is excluded, venture capital and private equity investment in US companies tripled between 2010 and 2011, again suggesting broad growth in investment activity.
Figure 4: Worldwide Venture Capital (VC), Private Equity (PE), Over-the-Counter (OTC), and Private Investment in Public Equities (PIPE) Investments in fuel cell companies (2009 – 2011) Source: Breakthrough Technologies Institute using data from Bloomberg New Energy Finance
Figure 5: US Venture Capital (VC), Private Equity (PE), Over-the-Counter (OTC), and Private Investment in Public Equities (PIPE) Investments in fuel cell companies (2009 – 2011) Source: Breakthrough Technologies Institute using data from Bloomberg New Energy Finance
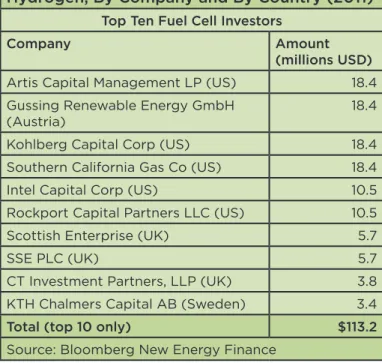
Table 4: Top Ten Disclosed Venture Capital and Private Equity Investors in Fuel Cells and Hydrogen, By Company and By Country (2011)
Top Ten Fuel Cell Investors
Company Amount
(millions USD)
Artis Capital Management LP (US) 18.4 Gussing Renewable Energy GmbH
(Austria) 18.4
Kohlberg Capital Corp (US) 18.4 Southern California Gas Co (US) 18.4
Intel Capital Corp (US) 10.5
Rockport Capital Partners LLC (US) 10.5
Scottish Enterprise (UK) 5.7
SSE PLC (UK) 5.7
CT Investment Partners, LLP (UK) 3.8 KTH Chalmers Capital AB (Sweden) 3.4
Total (top 10 only) $113.2
Source: Bloomberg New Energy Finance The growth in investment activity is
reflected in Table 4, which shows the top ten disclosed venture capital and private equity investors in fuel cells and hydrogen in 2011. The total amount of private equity and venture capital investment for the top ten investors is nearly three times greater in 2011 ($113.2 million) than it was in 2010 ($36.9 million), as reported in the 2010 edition of this report. Moreover, with the exception of Intel Capital Corporation, all of the top ten investors shown in the table are new to the list in 2011, suggesting that the industry is attracting both new capital and new sources of that capital.
Table 5 shows the top ten global investors in fuel cells and hydrogen between 2000 and 2011, as well as the
countries with the highest level of investment during that period. Kleiner Perkins Caufield & Byers, a US firm, made the greatest cumulative investment during the period, followed by the World Gold Council, a United Kingdom (UK) firm. In aggregate, US investors made the greatest cumulative investment during the period, $815 million, followed by UK investors at $320.5 million. US and UK investors collectively comprised six of the top ten largest investors in the sector.
Table 5: Top Ten Venture Capital and Private Equity Investors in Fuel Cells and Hydrogen, By Company and By Country (Cumulative 1/1/2000 – 12/31/2011)
Top Ten Fuel Cell Investors Top Ten Countries with Highest Levels of Private Investment in Fuel Cells
Company Amount
(millions USD) Country Total All VC and PE Investment (millions USD)
Kleiner Perkins Caufield & Byers (US) 66.4 US 815.0
World Gold Council (UK) 60.4 UK 320.5
Carbonics Capital Corp (US) 58.1 Canada 154.0
Investec (South Africa) 57.1 Germany 98.1
Chrysalix Energy LP (Canada) 53.2 South Africa 57.1
Mobius Venture Capital (US) 51.5 Singapore 50.0
EnerTek Singapore Ptd Ltd (Singapore) 50.0 Australia 46.5
Rolls Royce Plc (UK) 50.0 Sweden 33.2
Jolimont Ventures (Australia) 45.5 Switzerland 31.1
Meditor Capital Management (UK) 36.7 Netherlands 29.1
Subtotal (top 10 only) $528.9 Subtotal
(top 10) $1,634.6
TOTAL (All Companies and Countries) 1,828.5
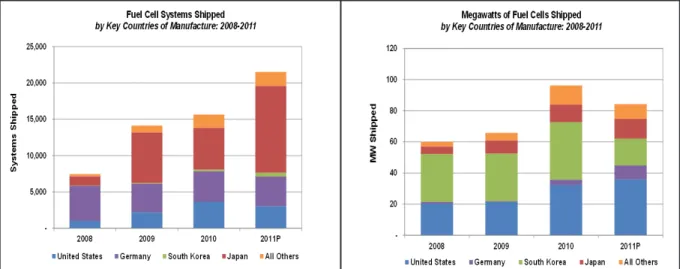
Shipments
The total number of fuel cell systems shipped continued to increase in 2011. As shown in Figure 6, total global shipments across all applications grew from roughly 16,000 units in 2010 to roughly 22,000 units in 2011, a 37.5% increase. Between 2008 and 2011, total global shipments increased from about 7,000 units to 22,000 units, a 214% increase. There also is a steady increase in MWs shipped for most of the period, but a slight decline between 2010 and 2011, primarily in the stationary market (See Figure 7). This is because the substantial growth in stationary unit shipments, as shown in Figure 6, is primarily attributable to residential units, which typically produce a few kilowatts of power each, a small fraction of the output of large stationary units. In other words, total stationary shipments in 2011 comprised a greater proportion of residential units than the total stationary shipments in 2010. This accounts for the increase in the number of units and the decrease in the MW shipped
between 2010 and 2011. Similarly, portable MWs shipped each year total substantially less than 1 MW, even though there are a significant number of portable units sold each year.
The location of manufacture for fuel cell systems shows a trend toward increased
manufacturing activity in Asia as compared with North America. As shown in Figure 8, fuel cell manufacturing in North America increased substantially between 2008 and 2010, with growth in all three market segments (portable, transportation, stationary). In 2011, however, total units manufactured in North America declined to about 3,100 units, as compared with 3,600 units in 2010. The declines were in the stationary and portable market segments, with transportation showing a significant increase, due to increasing shipments for materials handling equipment.
Figure 6: Fuel Cell Systems Shipped by Application, World Markets: 2008-2011. Source: Pike Research8
Figure 7: MW of Fuel Cells Shipped by Application, World Markets: 2008-2011. Source: Pike Research.
In Asia, the trend between 2008 and 2011 has been a generally steady and sharp increase, rising from roughly 1,600 units in 2008 to roughly 12,500 units in 2011. All of the growth has been in the stationary market, primarily due to Japan’s residential fuel cell program.
Figure 9: Fuel Cell Systems and MWs Shipped by Country of Manufacture: 2008-2011. Source: Pike Research.
A breakdown of shipments by country of manufacture further reveals this trend. As shown in Figure 9, Japan experienced the greatest growth between 2008 and 2011 in terms of unit shipments. The United States also experienced growth between 2008 and 2010, but unit shipments declined 16 % between 2010 and 2011. Germany’s unit shipments remained relatively constant during the period.
Figure 8: Fuel Cell Systems Shipped by Application, Manufactured in North America and Asia: 2008-2011. Source: Pike Research.
In terms of MW shipped, the United States experienced steady growth between 2008 and 2011, largely because of increased sales of large stationary fuel cells. Japan also experienced growth, but its total MW shipped is less than the United States because of Japan’s focus on the small stationary market. South Korea is notable for its substantial MW shipments, largely due to the manufacturing and sales agreement between FuelCell Energy and Posco Power. Germany significantly expanded MWs shipped between 2010 and 2011, much of which is attributable to the transportation market segment.
Finally, the number of units
manufactured in Europe remained steady between 2008 and 2011, with a roughly 2% increase between 2010 and 2011 (see Figure 10). Most of the shipments were for transportation applications, although the number of stationary shipments continues to
Figure 10: Fuel Cell Systems Shipped by Application, Manufactured in Europe: 2008-2011. Source: Pike Research.
rise, exceeding 1,500 units in 2011.
Government Policy, Standards, and Regulation
Enacted in 2009, the American Recovery and Reinvestment Act (ARRA) was a significant driver of fuel cell sales in 2010, providing $41.9 million through DOE and attracting $54 million in cost share. In 2011, much of the ARRA funding had been spent, but there was significant activity at the state level.
California enacted AB 14, which creates a Clean Energy Upgrade Program to subsidize property owners who borrow from financial institutions to install distributed generation renewable energy sources or energy or water efficiency improvements. The bill was intended to provide an alternative to the state’s PACE program, which permits local governments and utility districts to provide property owners with up-front financing to install renewable energy (including fuel cells), or to make water or energy efficiency improvements.
In September 2011, the California Public Utilities Commission (CPUC) modified the
Self-Generation Incentive Program (SGIP), including changing eligibility criteria, incentive amounts, and payment structures. SGIP funding is now based upon greenhouse gas (GHG) emissions reductions and a wide range of technologies are eligible, including fuel cells. The CPUC decision also extended the SGIP program until January 1, 2016.
The Connecticut Clean Energy Fund (which became part of the Clean Energy Finance and Investment Authority in July 2011) created the Alpha Program to fund development and testing of emerging clean energy technologies. Companies may apply for a total of $200,000 divided into two phases: a phase 1 grant of up to $50,000 for engineering design and
development and a Phase 2 loan of up to $150,000 for prototyping. The grant requires a 25% funding match and the loan requires a one-third match. Eligible projects include fuel cells and hydrogen production.
Connecticut also authorized municipalities to exempt “Class I” renewable energy projects from paying building permit fees. Class I renewable energy projects include energy derived from fuel cells.
In May 2011, Indiana enacted legislation creating the Clean Energy Portfolio Standard (CPS), also known as the Comprehensive Hoosier Option to Incentivize Cleaner Energy (CHOICE) program. The program sets a voluntary goal of 10% clean energy by 2025, based on 2010 levels. Participation in CPS is open only to public utilities, which must meet renewable generation targets to receive incentives. These targets begin at 4% in 2013 and escalate to 10% in 2025.
Missouri enacted legislation that exempts qualified plug-in electric drive vehicles from state motor vehicle emissions inspection. A qualified plug-in electric drive vehicle is defined as a vehicle that, among other things, “can operate solely on electric power and is capable of recharging its battery from an on-board generation source and an off-board electricity source.” Missouri already exempts hydrogen powered vehicles from the emissions inspection
requirement.
Missouri also amended its Enterprise Zone program to create “renewable energy generation zones,” enabling local governments to reduce real property taxes for up to 25 years for renewable energy projects. Targeted industries include the renewably-powered fuel cell industry.
As of 2011, Nevada requires local governments to establish a parking program for qualified alternative fuel vehicles, enabling free parking at certain times and places. The state also authorized the use of qualified alternative fuel vehicles in high-occupancy vehicle lanes, regardless of the actual occupancy of the vehicle. A “qualified alternative fuel vehicle” may include a FCEV.
The New York State Energy Research and Development Authority (NYSERDA) announced an incentive program for large and small fuel cell installations. For large fuel cells (greater than 25 kW), the basic incentive is $1,000 per kW up to $200,000 per project, with additional incentives available for fuel cells serving essential public services (police, fire, health care, etc.) and for projects with an annual capacity factor of 50% or more. For small fuel cells, the incentive is up to $50,000, with a performance incentive of up to $20,000 per year for three years. Total program funding is $21.6 million, which will be available through 2015 unless exhausted earlier.
Other highlights include:
• Delaware enacted legislation to permit energy from Delaware-manufactured fuel cells to meet part of Delmarva Power and Light’s renewable energy production requirements. The fuel cells must be capable of being powered by renewable fuels, which includes natural gas.
• Ohio amended its alternative fuels transportation grant program to add natural gas, liquefied petroleum gas or propane, hydrogen, electricity, and any fuel that DOE determines to be substantially not petroleum.
• Rhode Island enacted a feed-in tariff (FIT) for new distributed renewable energy generation. The FIT seeks an aggregate capacity of 40 MW by the end of 2014 and includes fuel cell projects that are less than or equal to 1 MW and that use renewable fuels. • The federal tax credit for hydrogen fueling stations was reduced from a maximum of
Table 6: Commercially Available Materials Handling Fuel Cells 2011
Manufacturer Product
Name Type Output
H2Logic H2Drive PEM ~10 kW Hydrogenics HyPX Power
Packs hybridPEM / 8–12 kW Nuvera PowerEdge CS25, CM25, CM32, RL25 PEM 25–31 kW PowerFlow PFV-5 PEM 5 kW
Oorja Protonics OorjaPac DMFC 5 kW Plug Power GenDrive
Series 1000 PEM 8–10 kW GenDrive
Series 2000 PEM 8–10 kW GenDrive
Series 3000 PEM 1.8–3.2 kW $200,000 to a maximum of $30,000 per station, consistent with other alternative fuel infrastructure.
Applications and Market Assessment
Materials Handling
Materials handling continues to be a leading market for transport-related fuel cells. Large warehouses have found that fuel cells provide both an attractive alternative to battery-powered vehicles and an effective range extender for batteries. As a battery replacement, fuel cells provide nearly continuous operations (refueling takes less than five minutes), provide a continuous level of power (batteries lose power as charge levels decrease), and eliminate the need for battery changing facilities that use valuable warehouse space. As a range extender, fuel cells help maintain a constant state of charge, thus reducing or eliminating the need for battery recharging or replacement. The result is that the materials handling market provides
a clear business case for fuel cell applications.
Many reports and analyses include materials handling within the transportation market segment for fuel cells. However, because materials handling is a niche application that
operates primarily on private property, and because it is one of the first commercial applications for fuel cells, we have broken it out separately in this report. Table 6 provides a list of commercially available materials handling fuel cells in 2011. Manufacturers of materials handling equipment have developed dozens of models using these fuel cells for motive power.
Currently, the United States is by far the world leader in fuel cell-powered forklift
deployments, with more than 3,000 fuel cell forklifts either deployed or on order as of the end of 2011. By comparison, deployments in Europe total about 33 units. Government funding through ARRA was a catalyst in the United States for many early fuel cell forklift deployments. Plug Power is one of the leading companies in this market, offering a range of products that replace batteries on existing materials handling equipment, including forklifts, pallet trucks, tow tractors, and counterbalance trucks. In 2011, Plug Power announced the next generation of its GenDrive® fuel cell products for electric lift trucks and committed to purchase a
minimum of 3,250 fuel cell stacks by the end of 2012 from Ballard Power Systems. Ballard is the exclusive supplier of fuel cell stacks for Plug Power’s GenDrive™ systems and Plug Power is the exclusive systems integrator for Ballard’s fuel cell stacks in the materials handling
Table 7: Notable Plug Power 2011 GenDrive® Sales Customer # of
Units Type Location of Deployment
Procter and Gamble 200+ Lift trucks California, Louisiana, North Carolina Central Grocers 11 Lift trucks Additional order for
distribution center fleet in Joliet, IL, for total of 231 Kroger Co. 161 4 sit down counterbalanced
trucks, 42 reach trucks and 115 pallet trucks
Food distribution center in Compton, CA
Sysco Corporation 315 mix of class-1 units for sit down counterbalanced trucks, class-2 units for reach trucks and class-3 units for rider pallet jacks
Boston, MA (160), Long Island, NY (42), and San Antonio, TX (113)
Coca-Cola
Refreshments 37 Lift trucks 250,000 sq. ft. bottling and distribution center in San Leandro, CA
WinCo Foods 184 93 pallet jacks; 38 stand-up counterbalance trucks; and 53 European-style moving mast lift trucks
800,000 sq. ft. grocery distribution center in Modesto, CA
over 2010.
Plug Power also announced its intent to partner with Axane, an Air Liquide subsidiary, to better penetrate the European forklift market, which the company estimates to include an installed base of 2,000,000 forklifts and 325,000 annual unit sales. Under the partnership, Plug Power will continue manufacturing in the United States and Axane will provide sales and distribution support.
Finally, Plug Power was listed on Deloitte’s Technology Fast 500TM, a ranking of the 500 fastest growing technology, media, telecommunications, life sciences and clean technology companies in North America. The rankings were based upon revenue growth between 2006 and 2010, during which period Plug Power grew 149 %.
Table 7 shows major sales for Plug Power in 2011.
Oorja Protonics offers direct methanol fuel cells (DMFCs) as range extenders for battery-powered vehicles. In 2011, Oorja received the TiECON 50 award, which recognizes world leading technology startup companies. More than 1,600 companies were screened on a variety of criteria, including business model, customer references, number of users, executive team, prior experience of founders, intellectual property, and funding status.
Oorja also received a follow-on order from Martin-Brower for its Stockton, California, facility and provided 24 OorjaPac Model III fuel cell systems to EARP Distribution, converting EARP’s entire fleet. Similarly, Oorja installed 20 units at Golden State Foods in Lemont, Illinois,
units to Baldor Specialty Foods. In Europe, the European Union launched the HyLIFT-DEMO project to conduct a two-year demonstration of at least 30 fuel cell-powered forklifts and hydrogen refueling at three end-user sites throughout Europe. The goal is to bring a commercially viable product to market by 2013. The project is co-funded by the European Joint Undertaking for Fuel Cells and Hydrogen. H2 Logic, a Danish company and a partner in HyLIFT-DEMO, introduced two hydrogen fuel cell systems for forklifts. The first is a battery replacement product, similar to Plug Power’s GenDrive. The second is a range extender, similar to the product offered by Oorja Protonics.
Stationary Power
Stationary fuel cells cover a number of market segments, including megawatt-scale prime power plants, uninterruptable power supplies, and CHP. They come in a variety of types, including molten carbonate fuel cell (MCFC), solid oxide fuel cell (SOFC), phosphoric acid fuel cell (PAFC), and low and high temperature proton exchange membrane (PEM). They also generally exceed all other market segments in terms of annual megawatts shipped, with US companies such as FuelCell Energy, UTC Power, and more recently Bloom Energy accounting for the dominant share of shipped capacity. Table 8 provides a list of commercially available stationary
Table 8: Commercially Available Stationary Fuel Cells 2011 Prime Power and mCHP
Manufacturer Product Name Type Output
Ballard FCgen-1300 PEM 2 – 11 kW
CLEARgen PEM Multiples of 500 kW
Bloom Energy ES-5400 SOFC 100 kW
ES-5700 SOFC 200 kW
Ceramic Fuel
Cells BlueGenGennex SOFC 2 kWSOFC 1 kW
ClearEdge
Power ClearEdge 5ClearEdge Plus PEMPEM 5 kW5 – 25 kW
ENEOS CellTech ENE-FARM PEM 250 – 700 W
FuelCell Energy DFC 300 MCFC 300 kW
DFC 1500 MCFC 1,400 kW
DFC 3000 MCFC 2,800 kW
Heliocentris
Fuel Cells AG Nexa 1200 PEM 1.2 kW
Horizon GreenHub Powerbox PEM 500 W – 2 kW
Hydrogenics HyPM Rack PEM Multiples of 10, 20,
and 30 kW
FCXR System PEM 150 kW
Panasonic ENE-FARM PEM 250 – 700 W
Toshiba ENE-FARM PEM 250 – 700 W
UTC Power PureCell Model 400 PAFC 400 kW
Backup and Remote Power
Manufacturer Product Name Type Output
Altergy Systems Freedom Power System PEM 5 – 30 kW
Ballard FCgen 1020A CS PEM 1.5 – 3.6 kW
ClearEdge
Power ClearEdge CP PEM 10 kW
Dantherm
Power DBX 2000DBX 5000 PEMPEM 1.7 kW 5 kW
Horizon H-100 PEM 100 W
H-1000 PEM 1 kW
H-3000 PEM 3 kW
H-5000 PEM 5 kW
MiniPak PEM 100 W
Hydrogenics HyPM XR Power Modules PEM 4, 8, and 12 kW
IdaTech ElectraGen H2-I PEM 2.5 - 5 kW
ElectraGen ME PEM 2.5 - 5 kW
Microcell MGEN 1000 PEM 1 kW
MGEN 3000 PEM 3 kW
MGEN 5000 PEM 5 kW
ReliOn E-200 PEM 175 W
E-1100/E-1100v PEM 1.1 kW
E-2500 PEM 2.5 kW
T-1000 PEM 600 W – 1.2 kW
fuel cells as of 2011. Prime Power
The market for fuel cells as prime power is growing, although government support is still critical to help offset first costs. Fuel cells are providing clean, reliable power for commercial buildings, retail stores, multi-family residential buildings, and many other facilities. Fuel cells also are increasingly generating electricity from renewable fuel sources, such bio-gas produced as a by-product of wastewater treatment.
In 2011, fuel cell companies continued to cut costs and increase their geographic reach and partnerships. Companies also expanded the use of power purchase agreements, whereby customers agree to purchase the electricity generated by a fuel cell without purchasing the fuel cell itself. This has many advantages for customers, including the ability to lock-in rates and to use waste heat produced by the fuel cell.
In 2011, Bloom Energy announced that it expanded its manufacturing facility in Sunnyvale, California, increasing the company’s footprint by four times and creating more than 1,000 new jobs. The company announced that it grew 525% over the previous four years, and that it will open a manufacturing facility at a former Chrysler plant in Delaware and install two clusters of fuel cell units at Delmarva Power substations. Bloom further announced a deal with AT&T, whereby it will install fuel cells at eleven AT&T sites in California, totaling 7.5 MW of power. Bloom also introduced Bloom Electronssm, a power purchase arrangement that allows
customers to lock in their electricity rates for 10 years, delivering fixed, predictable costs with no initial investment. Bloom manages and maintains the systems on the customers’ sites and the customers pay only for the electricity consumed. The Power Purchase Agreement can
Table 9: Summary of Bloom Energy US Projects 2011 Location Capacity Notes
Kaiser Permanente, CA 4 MW Seven facilities in California
NTT America, San Jose, CA 500 kW Will use biogas (gas generated by decomposing organic material) produced at a California dairy farm Sharks Ice, San Jose, CA 300 kW Practice rink for the San Jose Sharks hockey team AT&T, CA 7.5 MW 11 sites - Corona, Fontana, Hayward, Pasadena,
Redwood City, Rialto, San Bernardino, San Diego, San Jose, and San Ramon, CA
Fireman’s Fund, Novato, CA 600 kW Fireman's Fund said it anticipates a return on investment plus $1.5 million in the next 10 years Ratkovich Co., Alhambra, CA 500 kW For an office park
Red Lion Energy Center, DE 13.5 MW Planned project for a fuel cell-powered, grid-tied, base-loaded generating station
Washington Gas, Springfield VA 200 kW First Bloom installation on the US east coast Owens Corning, Compton, CA 400 kW Power for a roofing and asphalt plant
save customers up to 20 percent on electricity costs, according to Bloom.
UTC Power secured sales from repeat customers and achieved 200,000 operating hours with its PureCell® Model 400. In May 2011, a 500-unit apartment community on Roosevelt Island in New York City became the first residential building in the State of New York to be powered and heated by a 400 kW fuel cell from UTC Power. The project was supported by $1.2 million in financial incentives from NYSERDA. In February 2011, the company announced that Cox Communications installed four, 400 kW fuel cells at Cox facilities in San Diego and Rancho Santa Margarita, California. Also in 2011, UTC Power selected Newmark Energy Solutions, LLC as an exclusive distributor of its fuel cells to commercial real estate markets across the United
States.
FuelCell Energy continued to secure international orders and funding for research and development (See Table 11). The world’s largest fuel cell park is now operating in Daegu City, South Korea, providing 11.2 MW of power using four FuelCell Energy Direct Fuel Cell (DFC3000) power plants. In May 2011, FuelCell Energy secured an order from POSCO Power in South Korea for 70 MW for the South Korean market. This was the largest order ever received by FuelCell Energy, nearly doubling product sales and enabling continuation of an annual production rate of 55 MW, according to the company. The first shipment of a 2.8 MW unit was completed in October 2011, and monthly shipments are expected through October 2013. POSCO Power also purchased a unit for Indonesia and plans to expand the market into Thailand, Malaysia, and Singapore.
In December 2011, FuelCell Energy signed a partnership agreement with Abengoa S.A. Under the agreement, Abengoa will install a 300 kW unit at its headquarters in Seville, Spain, and will manufacture and market units targeting renewable biogas markets in Europe and Latin America. Abengoa also will develop a fuel processing system to enable FuelCell Energy units
Table 10: Summary of UTC Power US Projects 2011
Location Capacity Notes
Cox Communications, San Diego
and Rancho Santa Margarita, CA 1.2 MW (two 400 kW units at two facilities) Powered by a blend of biogas and natural gas University of Connecticut 400 kW Will supply energy, heat, and cooling to all
of the buildings on the Depot campus Whole Foods, Fairfield, CT 400 kW Second Whole Foods in CT to receive a
UTC fuel cell, fourth in US.
Octagon, Roosevelt Island, NY 400 kW Provides electricity, heat, and hot water to LEED certified 500-unit apartment complex Hamden High School, Hamden,
CT 400 kW Will provide 90% of the electricity needs and byproduct thermal energy will be used to heat the school and swimming pool
Table 11: Summary of FuelCell Energy Projects 2011
Location Capacity Notes
California State University, San
Bernardino, CA 1.4 MW Will be owned by Southern California Edison Company Central Connecticut State University,
New Britian, CT 1.4 MW Sold to Greenwood Energy
London, England 300 kW Will be installed in a 250,000 square foot, mixed-use redevelopment project by the Crown Estate POSCO Power, South Korea 70 MW 2.8 MW have already been shipped
Water Park Resort, Jakarta, Indonesia 300 kW Sold to POSCO Power
to operate using liquid biofuels.
FuelCell Energy received several government contract awards in 2011, including funding from the Solid State Energy Conversion Alliance (SECA) to develop a solid oxide fuel cell module operating on coal syngas and to evaluate the use of its fuel cells to capture
Table 12: Summary of FuelCell Energy Federal Agency Funding Awards 2011
Agency/Project Amount Partners/Notes
DOE /SECA - To build and operate a scalable 60-kW SOFC module fueled by coal syngas
$11.7 million (cost-share, with $8.2 million funded by DOE)
Versa Power Systems
DOE - To demonstrate advanced
biogas de-sulfurization technology $1.6 million TDA Research DOE - To evaluate the use of its DFC®
to capture carbon dioxide (CO2) from coal-fired power plants
$3 million Three-year project for system design, cost analysis, and long-term testing of a multi-kilowatt DFC stack DOE - To further develop and
demonstrate a method for separating and compressing hydrogen using solid-state electrochemical hydrogen separation and compression (EHSC) technology
$1 million Two-year project
EPA - To evaluate the effectiveness of DFC®s to efficiently separate CO2 from the emissions of industrial operations such as refineries, cement kilns and pulp and paper mills.
$100,000 Successful results may lead to a demonstration project
carbon dioxide (CO2) from coal-fired power plants (See Table 12).
Ballard Power Systems announced several big projects and sales, including 1.25 MW of its FCgen®1300 fuel cells to Real Time Engineering PTE Ltd. (RTE). RTE intends to produce a 1 MW distributed power generator for deployment in Singapore. The company is also partnering with GS Platech to demonstrate waste-to-energy power generation using fuel cells and hydrogen produced from processing of municipal solid waste. The system will operate at a GS Platech pilot plant in Cheongsong, South Korea.
power and heat to the Toyota’s sales and marketing headquarters in Torrance,
California. Ballard’s CLEARgen™ fuel cell system will use hydrogen produced by steam-reformation of renewable biogas generated at a landfill and will provide power to a number of locations on the 125-acre, multi-building campus, including Toyota and Lexus headquarters, a data center, and an employee fitness center.
Other 2011 stationary power highlights include:
• Nedstack delivered a 1 MW PEM fuel cell power plant to a chlorine plant in Antwerp, Belgium. The fuel cell will use byproduct hydrogen from the chlorine plant.
• A Nedstack PEM system recently completed 10,000 hours of operation with a 5 % performance loss at the end of the period. The stacks operate under industrial conditions, including exposure to air contaminants, multiple start-stop cycles, and emergency shut downs. The company expects the fuel cell system to last a total of 20,000 hours or more.
• Connecticut Transit was awarded $5,702,298 from the Federal Transit Administration (FTA) to install a stationary fuel cell at its New Haven Division Bus Maintenance Facility.
• The University of California, Davis, broke ground on the 8,000-square-foot Jess S. Jackson Sustainable Winery Building, which will be the first self-sustainable, zero-carbon teaching and research facility in the world. The building will sequester CO2 captured from all fermentation and convert it into calcium carbonate, or chalk, which will be given to a plasterboard company. The building also will produce chilled water using solar electricity panels, generate hydrogen by electrolysis, and enable nighttime energy using a hydrogen fuel cell.
• VTT Technical Research Centre of Finland built a system that uses a single 10 kW planar SOFC stack to produce grid electricity from natural gas. According to VTT, this is the first time that a 10 kW power class planar SOFC fuel stack has been operated as part of a complete fuel cell system.
• The South Korean Ministry of the Knowledge Economy issued the final ruling
providing the funding mechanism for new and renewable (NRE) power sources under the county’s Renewable Portfolio Standard (RPS). Power produced from fuel cells will receive a premium price compared with power produced from other NRE power sources, thus recognizing the environmental advantages and high capacity factor of fuel cells.
• POSCO Power completed construction of its fuel cell stack manufacturing plant in the city of Pohang, South Korea. The facility now has the capacity to produce 100 MW of molten carbonate fuel cell stacks annually. In addition, the plant has a 2.4 MW fuel cell power plant, a research and development center, and a POSCO fuel cell gallery/show
room.
Micro Combined Heat and Power
An important component of the stationary prime power market is micro combined heat and power (mCHP). mCHP allows residences and small business to generate their own power and to use excess thermal energy from the fuel cell for heating and other purposes.
As highlighted in the 2010 edition of this report, much of the activity in this segment is in Japan, where mCHP products are marketed under the ENE-FARM brand. In 2011, there were increased orders for the ENE-FARM residential fuel cell, due in part to the earthquake, tsunami, and nuclear catastrophe. The Japanese government set aside funding sufficient to subsidize 8,000 residential fuel cells in fiscal year 2011, which ends in March 2012. Although the total subsidy allocation was roughly 60% greater than the previous year, it had been exhausted by July 2011. According to media reports, Osaka Gas sold roughly 1,300 fuel cells between March and June 2011, and Tokyo Gas Co. sold more than 4,000 fuel cells between April and July 2011. At the same time, retail prices were falling. Tokyo Gas and Panasonic introduced a new ENE-FARM fuel cell that costs roughly 20% less than previous models.
In the United States, ClearEdge Power added two new products to its portfolio. The ClearEdge Plus is modular and flexible protected load system that is designed to provide continuous power to a range of commercial applications. ClearEdge CP is a triple
redundant base load system designed for customers that require mission critical power for their data and telecommunication needs.
The company received a competitive award from DOE’s Pacific Northwest National Laboratory (PNNL) and is installing 15 fuel cell systems at different businesses in
California and Oregon. ClearEdge also received $1 million from Southern California Gas to help develop its CHP stationary fuel cell for home and businesses in California. ClearEdge Power became the first fuel cell manufacturer to be awarded the Korean Gas Safety Corporation’s (KGS) internationally recognized safety certification, which is mandatory to market fuel cells in Korea, and is recognized throughout Asia, including China, Japan, Thailand, Hong Kong, Singapore, Australia, Russia, and parts of Europe. ClearEdge also
Table 13: Summary of ClearEdge Power US Projects 2011 Location Capacity Notes
Cambrian Center, San Jose, CA 20 kW Provides CHP to a senior and disabled adult housing facility Irvine Unified School District
(IUSD), Irvine, CA 60 kW Woodbridge High School and University High School, each receiving six fuel cells Portland Community College,
Portland, OR 10 kW Will be used as part of PCC’s comprehensive alternative energy curriculum Palace Hotel, Long Beach, CA 10 kW Two units, combined with solar panels, will provide almost
all the property’s electric demand on-site Stone Edge Farm, Sonoma
County, CA 5 kW Provides CHP to the winery’s estate and vineyard Universal Studios, Hollywood, 20 kW Provides power and hot water to Universal production
announced plans to expand its market to New York.
In Australia, Ceramic Fuel Cells Limited’s (CFCL) sold hundreds of units in 2011 and signed distribution agreements with companies in the United Kingdom, the Netherlands, Australia, Germany, and Austria. The company’s BlueGen® mCHP product received final product and factory accreditation in the UK, enabling BlueGen customers to benefit from the UK government’s feed in tariff. BlueGen also won the Microgeneration UK 2011 Technical Innovation Award at the Microgeneration UK 2011 conference in London. Microgeneration UK 2011 brings together policymakers, investors, suppliers, and
customers in the UK microgeneration industry.
In Australia, BlueGen was certified by the Australian Gas Association (AGA) for installation as a gas appliance. Finally, CFCL signed a Manufacturing Services Memorandum of
Understanding (MoU) with Jabil Circuit, Inc. to scale up the manufacturing of CFCL’s
Table 14: Summary of Ceramic Fuel Cells Limited International Sales 2011 Customer # of units
(and type) Notes
Zestiq B.V. 100 BlueGen For small commercial and residential customers in the Netherlands
E.ON UK 105 BlueGen Addition to previous order of 41 fuel cells
Sanevo Lizenz-GmbH & Co. 100 BlueGen Initial order for 100 units to be delivered in the first year, with a target minimum order of 500 units for delivery in the second year and a target of 2000 units in third Ausgrid 25 BlueGen To be installed in homes in Newcastle as part of Ausgrid’s
‘Smart Grid, Smart City’ project
EWE 200 Gennex
modules German Government formally approved funding for an order of up to 200 modules for Gebrüder Bruns Heiztechnik GmbH to integrate and deliver to EWE. EWE will then install the units in homes in the Lower Saxony region in northern Germany
Eneco, Liander, GasTerra
and Amsterdam Smart City 1 BlueGen Installed at a 17th century canal house office building “De Groene Bocht“ in the center of Amsterdam Gennex fuel cell module and BlueGen systems.
Other 2011 mCHP highlights include:
• Wärtsilä and Versa Power Systems (VPS) entered into a cooperative agreement to develop and integrate Versa Power’s SOFC technology into Wärtsilä CHP and power products for the distributed energy and marine markets.
• Ceres Power Holdings obtained CE safety approval for its wall-mounted fuel cell CHP product, which will be used in field trials under the residential CHP program with British Gas.
• Topsøe Fuel Cell of Denmark signed a MoU with South Korean company SK Holdings to work together on the commercialization of fuel cells for residential applications as well as larger stationary units for Asian markets.
up to several hundred kilowatts. Backup and Remote Power
The backup and remote power market continued to be dominated in 2011 by US companies, primarily for the telecommunications market.
IdaTech announced the availability of Bio-HydroPlus renewable fuel, a mixture of bio-methanol and de-ionized water, which can be used to power its backup power fuel cell systems. T-Mobile® installed an IdaTech ElectraGen™ ME Fuel Cell System on its network in California, and is using Bio-HydroPlus fuel to power the system. IdaTech’s ElectraGen® ME fuel cell system also provided power for cellular phone coverage during the United Nations Climate Change Conference (COP 17) held in Durban, South Africa.
ReliOn announced that is has deployed more than 3.9 MW of its fuel cell systems at approximately 1,350 customer sites globally. The company’s E-2500 fuel cell system was designated a “Hot Product” by the Association of Public Safety Communications Officials (APCO) and was awarded third place in the Green Telecom & Smart Energy Solutions, Applications and Hardware category of the annual Emerging Technology (E-Tech) Awards. The E-Tech awards are given by CTIA, the industry association for the wireless telecommunications industry.
ReliOn was also ranked number 148 on Deloitte’s Technology Fast 500TM, a ranking
of the 500 fastest growing technology, media, telecommunications, life sciences and clean technology companies in North America. The rankings were based upon revenue growth between 2006 and 2010, during which period ReliOn grew 695 percent. ReliOn also entered into a partnership with HOPPECKE, a German manufacturer of industrial batteries, to market ReliOn’s fuel cell products under the HOPPECKE brand for backup power solutions throughout Europe, the Middle East, and Africa.
Altergy Systems’ Freedom Product achieved 5 million operational hours in
telecommunications and other applications worldwide. The company announced significant new projects, including providing telecom power in Jamaica and for the Union Pacific Railroad. Altergy also continued to expand its unique remote and indoor lighting applications, providing fuel cell lighting for various Hollywood award ceremonies and for the final lift off of the space shuttles Endeavour and Atlantis. Altergy’s fuel cell lighting system was named the Grand Award Winner for the “Most Innovative Product” at the Rental Equipment Register’s awards and took the top prize in the “Light Towers” category. The Innovative Product Award was established to honor “excellence in new product development in the equipment rental industry.”
Ballard Power Systems, through its Dantherm Power arm, signed a collaboration
agreement with Delta Power Solutions (India) to market fuel cell-powered backup power systems for the India telecommunications sector as well as commercial uninterruptable power supply (UPS) systems for data centers, industrial power solutions and distributed power generation. Delta ordered 30 Dantherm DBX2000 fuel cell systems to be installed at sites of a major telecom service provider in India. Dantherm Power will also supply a 150-kW fuel cell generator to Anglo American Platinum Limited for deployment at one of
Anglo American Platinum’s mining operations in South Africa.
SFC Energy AG introduced several new products in 2011, including the EMILYCube 2500 – a portable charging station that combines a 100 W fuel cell with a Li-ion battery – and the EFOY COMFORT line power generators for mobile homes, sailing yachts and holiday cabins. The company is also working with Ensol Systems to integrate its EFOY Pro fuel cells into chemical injection, air compression, and independent power packages for oil and gas pipelines and facilities isolated from the grid.
UPS Systems, a supplier of several manufacturers’ fuel cell systems, provided fuel cells to power telemetry and television equipment, camera equipment, and a weather monitoring station.
Other significant applications include:
• ACAL Energy will install its first FlowCath® fuel cell technology system to provide backup power for an environmental remediation plant.
• Meiningen, Germany began operating a new emergency power supply system based on Heliocentris Energy Solution AG’s Nexa 1200 fuel cells.
• CommScope, Inc. will supply its hydrogen fuel cell system to the Society of Cable Telecommunications Engineers (SCTE), providing 64 hours of backup power to the data center.
• AFC Energy and N2telligence GmbH will to develop alkaline fuel cells for fire protection.
Transportation
The transportation market segment includes a wide range of applications, such as light and heavy duty vehicles, buses, small aircraft, and ships (materials handling is covered in a separate section of this report). Several large automakers continue to pursue fuel cells for light duty vehicle applications, with commercialization expected by 2015. The number of fuel cell buses continues to increase, in terms of both quantity and the number of countries where they are being deployed. The military has had particular success with fuel cells for unmanned aerial vehicles
(UAVs).
Fuel cells for transportation are exclusively PEM fuel cells. In most applications, the fuel cells are coupled with a battery or other energy storage device. In this configuration, the fuel cell provides either prime power or power to the battery, which is the prime power source. Table 15 shows
Table 15: Commercially Available Fuel Cells for Transportation 2011
Manufacturer Product Name Type Output
Ballard FCvelocity-HD6 PEM 75 and 150 kW Hydrogenics HyPM HD
Modules PEM 4, 8, 12, 16, 33, and 100 kW Nuvera Andromeda
Fuel Cell Stack PEM 100 kW HDL-82 Power
Module PEM 82 kW
the commercially available fuel cells for transportation in 2011. Light Duty Vehicles
Fuel cell electric vehicles (FCEVs) have many advantages over conventional fuel and battery-powered vehicles. They have no tailpipe emissions and, if hydrogen is produced from renewable sources, can provide truly emission-free mobility. Unlike battery vehicles, their range is comparable to existing gasoline vehicles and they can be refueled in
minutes. Although they are expensive and are available only in limited markets, several major automakers remain committed to producing commercial quantities by 2015. The increased volume, coupled with continued technology improvements, is expected to result in significant price reductions.
In July 2011, President Obama announced an agreement with thirteen major automakers to increase average fuel economy to 54.5 miles per gallon for cars and light-duty trucks by Model Year 2025. FCEVs were cited as important to achieving the new fuel economy standard. Rules to implement the agreement will be proposed by the US Environmental Protection Agency and the Department of Transportation.
As shown in Figure 11, DOE is seeking to reduce lifecycle costs of light duty vehicles roughly in half, from 53 cents per mile in 2010 to 28 cents per mile in 2020. The cost reduction is expected to result from increased volume manufacturing and technology improvements in both fuel cells and hydrogen production and storage. Automakers continue to improve and test fuel cell
vehicles. General Motors (GM) delivered 16 fuel cell Equinox vehicles to the US military as part of the Hawaii Hydrogen Initiative (H2I). Under this initiative, GM and 11 partners are seeking to make hydrogen-powered vehicles and a fueling infrastructure a reality in Hawaii by 2015, including installing up to 25 hydrogen stations in and around Oahu by the end of this decade.
Toyota delivered two of its FCHV-adv fuel cell vehicles to the town of Hempstead, New York and announced it would place more than 100 FCHV-adv vehicles with universities, private companies, and government agencies in both California and New York over the next three
years. Toyota’s FCHV-adv vehicles also were Figure 12: Toyota FCV-R concept vehicle Figure 11: Cost Reduction Pathways for FCEVs. Source: DOE
deployed with All Nippon Airways Co., Ltd. and Welcome-Home Limousine Taxi Service at Narita Airport in Tokyo, Japan. The vehicles will be used to transport passengers returning to Japan from Europe and the US. At the Tokyo Motor Show, Toyota unveiled its latest FCEV, the FCV-R Concept, which will achieve a range of approximately 700 km (430 miles). The company announced a commercial launch date of 2015 for the vehicle. In January 2011, Mercedes-Benz drove its
F-CELL B-Class vehicles on the F-CELL World Drive, a 125-day journey through four continents, 14 countries, and a wide range of climates and driving conditions. An F CELL also is now working as a “follow me” vehicle at the Stuttgart airport in Germany. At the 2011 Frankfurt
Auto Show, Mercedes-Benz unveiled its F125! concept car, which includes its F-CELL plug-in hybrid technology, boosting the range to around 620 miles with a fuel economy estimated at 105 mpg.
Hyundai Motor Group introduced two new FCEVs in 2011 - its third generation, the
Tucson ix FCEV, which has a range of more than 400 miles and a gasoline equivalent fuel efficiency of more than 70 miles per gallon. Hyundai tested 50 of the Tucson ix FCEVs in 2011 in South Korea and announced plans to make a limited supply of the vehicle in 2012 and begin mass production in 2015 (Hyundai previously announced a goal of manufacturing 10,000 FCEVs in 2015.) The other vehicle, the Blue2 fuel cell concept vehicle, debuted at the Seoul Motor Show.
Hyundai also reinforced its commitment to bring its FCEVs and related infrastructure to Nordic countries, signing a MoU with stakeholders from Sweden, Denmark, Norway, and Iceland, as well as one with the City of Copenhagen, H2 Logic, and Hydrogen Link. Honda joined Clean Energy Partnership (CEP), Europe’s leading FCEV and hydrogen infrastructure demonstration project and provided two FCX Clarity FCEVs to the project. Honda also announced plans to introduce an electric power outlet-equipped FCX Clarity FCEV by the end of March 2012.
Other light duty highlights for 2011 include:
• A study by Germany’s H2Mobility concluded that FCEVs are market ready and the best electric option for larger vehicles and longer trips.9
• Hydrogen Transport for European Cities (HyTEC) announced that it will deploy fifteen Intelligent Energy/Lotus London fuel cell taxi cabs. The cabs will help serve the 2012 Olympics.
• Intelligent Energy’s fuel cell scooter achieved Whole Vehicle Type Approval (WVTA) and is approved for production and sale within Europe.