An Unsupervised Channel-Selection Method for
SSVEP-based BCI Systems
Ethan Webster
∗, Hadi Habibzadeh
∗, James J. S. Norton
†, Theresa M. Vaughan
†, Tolga Soyata
∗ ∗Department of Electrical and Computer Engineering, SUNY Albany, Albany, NY 12203
†National Center for Adaptive Neurotechnologies, David Axelrod Institute, Albany, NY 12208
{ewebster, hhabibzadeh, tsoyata}@albany.edu,
{norton, vaughan}@neurotechcenter.org
Abstract—Brain-computer interface (BCI)-based systems have been successfully implemented as a communication tool for people with motor deficits that obstruct normal communication. The accuracy of the algorithms used for determining user-selected commands directly impact their practicality to the user. These algorithms are divided into two principal categories, supervised and unsupervised. While the former achieves higher accuracy, the latter is useful when training is not practical for the user.
In this paper, we introduce an unsupervised algorithm for steady-state visual evoked potential (SSVEP)-based BCIs, which works in three steps: (i) it selects multiple sets of EEG (electroen-cephalogram) channels, followed by (ii) existing feature extraction methods applied to each one of these channel sets. As its final step, (iii) it combines the extracted features from these channel sets by performing a majority vote, yielding a classification. We evaluate the information transfer rate (ITR) attained using our proposed method on a database of 35 subjects using three different (CCA, FBCCA, MSI) feature extraction methods in step (ii). We compare these results to existing methods in the literature that use a single channel set without a majority vote. The proposed method indicates an improvement in at least 7 subjects using any of the three feature extraction methods.
Index Terms—Brain-computer interface (BCI); canonical cor-relation analysis (CCA); electroencephalography (EEG); filter bank canonical correlation analysis (FBCCA); minimum energy combination (MEC); multivariate synchronization index (MSI); steady-state visual evoked potential (SSVEP).
I. INTRODUCTION
Brain-computer interface (BCI) systems provide a direct link between a person and a computer. This creates an alternative communication channel for people with severe motor deficits such as locked-in syndrome [1] and may also have applications for people without disabilities [2]–[4]. The underlying premise of a BCI is that electroencephalography (EEG)—or some other neuroimaging technology—is used to measure the user’s brain activity in (near) real-time. This brain activity is analyzed to determine the user’s intended actions and a computer or robotic system is used to replace voluntary muscle activity as a means of communication and/or control. Repetitive visual stimulation is one well-established method for eliciting brain signals for use in a BCI [5]–[7]. For example, when a user attends a light source flashing at 12 Hz (a stimulus), a strong EEG signal can be observed at that same frequency (as well as at harmonic frequencies [i.e., 24Hz, 36Hz, etc.]) as the stimulus. This frequency-specific response in the EEG activity is called the steady-state visual evoked potential (SSVEP). Critically, when multiple stimuli
are present, the stimulus the user attends to elicits the strongest SSVEP [8]. This can be recognized using signal processing methods, which allows the user to make a selection; for example, in a BCI speller [9] application, different stimuli
can be associated with differentletters, which forms the basis of a communication device that allows a person spell words through SSVEP.
When developing an SSVEP-based BCI, one challenge is to decide how many electrodes to record EEG from and where to place these electrodes on the scalp. SSVEPs, for example, are predominantly observed over the occipital region of the scalp [10]. The performance of the signal processing system and subsequently the BCI will be lower if one attempts to measure SSVEPs using electrodes over other regions. Thus, this decision—known as channel selection—can have a sig-nificant impact on the overall performance of the BCI. The two general strategies for channel selection are supervised and unsupervised channel selection. While the former results in higher performance (e.g., accuracy or ITR) [11], it requires the collection of data from the user to determine the best set of channels before they can use the BCI, which may render the BCI system less practical.
In unsupervised channel selection, the set of electrodes used are chosen without collecting any additional data. These channels are often chosen based ona priori knowledge, such as previous research on the scalp distribution of the SSVEP. While unsupervised channel selection often results in lower performance, it doesn’t require the collection of data from each user to determine the best set of EEG channels. This means that the BCI can be set up faster, which is particularly advantageous in clinical settings, where time with a participant may be limited.
One limitation of both strategies is that they assume that the best set of electrodes is time invariant (i.e., stays the same). It is possible, however, that due to factors such as participant movements or transient artifacts in specific electrodes that the best set of electrodes changes with time. To circumvent some of these disadvantages, randomization of electrodes is investigated in [12], in which the data is selected from a random set of electrode to reduce the dependency on single electrode failures. Here, we present an unsupervised channel selection method that relaxes the assumption that the best set of electrodes is time invariant. Our method achieves this by simultaneously considering multiple different sets of
×64 SPATIAL/ TEMPORAL FILTERING SPECTRAL FILTERING FEATURE EXTRACTION (c) SIGNAL PROCESSING e.g., N
(a) STIMULATION (b) DATA ACQUISITION (d) CONTROL/FEEDBACK
DEVICE SOCIAL UEMCO_ VISUAL FEEDBACK AUDIO FEEDBACK ×NH TEMPLATE SIGNAL CLASSIFIER ×NC FILTERED SIGNAL A 8/0 B 9/0.5 C 10/1 D 11/1.5 E 12/0 F 13/0.5 G 14/1 H 15/1.5 I 8.2/0.5 J 9.2/1 K 10.2/1.5 L 11.2/0 M 12.2/0.5 N 13.2/1 O 14.2/1.5 P 15.2/0 Q 8.4/1 R 9.4/1.5 S 10.4/0 T 11.4/0.5 U 12.4/1 V 13.4/1.5 W 14.4/0 X 15.4/0.5 Y 8.6/1.5 Z 9.6/0 0 10.6/0.5 1 11.6/1 2 12.6/1.5 3 13.6/0 4 14.6/0.5 5 15.6/1 6 8.8/0 7 9.8/0.5 8 10.8/1 9 11.8/1.5 12.8/0 , 13.8/0.5 . 14.8/1 ← 15.8/1.5
␣
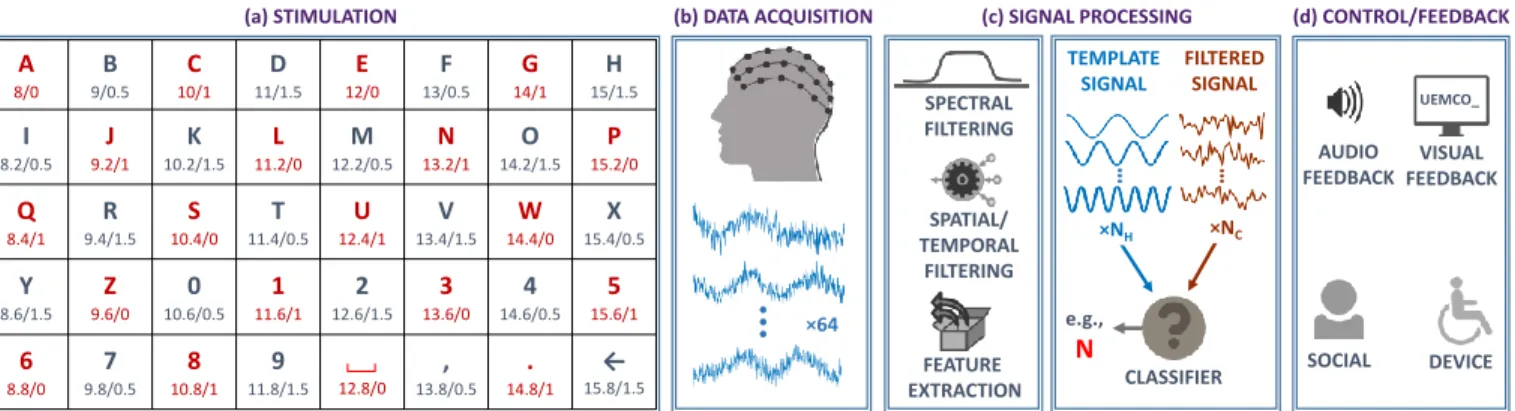
Fig. 1. A review of the BCI speller architecture. Thestimulationcomponent is a5×8matrix that is displayed on a conventional monitor. This figure shows the frequency (f, in Hertz) and phase (φ, inπradians) assigned to each letter (using an “f/φ” format). For example, the letter “N” is presented on a tile flickering at 13.2 Hz with the delay ofπradians. In the actual implementation, tiles assigned to each letter are uniformly separated by a blank space. The data acquisitioncomponent collects EEG data using 64 electrodes, although we only use a subset of them in our analysis.Signal processingmethods are used to filter and extract features from raw EEG signals that can be used for classification. In our case, this process consists of finding an amount of correlation between filtered signals and a template signal to assign a class to the signal. The classification result is then fed back to the user and their environment.
electrodes at each time interval. Data from each of these sets are independently processed and a final selection is made using a majority vote.
The rest of this paper is organized as follows. Section II provides a review of the BCI speller system used to generate the SSVEP dataset used in our analysis. Section III details the signal processing methods used for our channel selection method. Section IV presents experimental results that evaluate the performance of our proposed work. Finally, Section V concludes our paper and includes additional remarks.
II. BCI SPELLER ANDBENCHMARKDATASET The performance of any SSVEP-based BCI—represented graphically in Figure 1—is based on the design of multiple systems that work together to elicit brain activity (stimulation
system), measure that brain activity (data acquisitionsystem), process the acquired data (signal processingsystem), and then provide feedback to the user (control/feedback system). These systems are connected to together in a closed-loop and each system is itself comprised of multiple components. Here, we briefly introduce each of the systems and provide an overview of the cue-guided, SSVEP-based BCI speller system used by Wang et al. [13] to generate the benchmark dataset that we use in our study.
A. Stimulation
SSVEPs are elicited by an external stimulus and manifest themselves as voltages (more specifically voltage differences) between electrodes. Thus, a stimulation system is a necessary part of any SSSVEP-based BCI. Stimulation systems may be developed using different types of light sources including computer screens or light emitting diodes. In order to elicit an SSVEP, however, this lighting system must flash at a constant rate (between 1–100Hz). Factors such as the number of stimuli, the frequency of the flashes in each of these stimuli, and even the color of the stimuli can all have an affect on the overall performance of the BCI.
As shown in Figure 1a, the target stimuli (flashing lights) are presented on a computer monitor (23.6-inch LCD dis-play). There were 40 stimuli in total, each flashing at a unique frequency (fi ∈ {8.0,8.2,8.4, ...,15.6,15.8}) with neighboring stimuli having different phases (using phases
φ ∈ {0,0.5π, π,1.5π}). These differences in both frequency and phase are termed joint frequency and phase modulation (JFPM) by Wang et al. in [13].
B. Data Acquisition
In SSVEP-based BCIs, the signal acquisition system is com-prised of a set of electrodes (i.e., sensors, usually small metal discs), analog filters, an amplifier, and an analog-to-digital converter. Electrodes measure weak (in the µV range) neural signals from the surface of the scalp. Multiple electrodes (1 to 512 electrode channels [not including ground and reference electrodes]) are often used to measure neural signals from multiple locations. These small signals from the scalp are then filtered (to remove nuisance signals) and amplified (to prepare them for digitization). Finally, the signals are digitized so that they can be further processed using a computer.
The data acquisition system (see Figure 1b) includes 64 electrodes positioned over the scalp according to an extended 10/20 system [14]. The Synamps2 EEG system (Neuroscan®, Inc.) was used to record EEG data, which was digitally sampled at 1 kHz. A notch filter was applied at 50 Hz to remove power-line interference.
C. Signal Processing
The signal processing system then takes these digital signals and processes them in multiple steps. First, the signals are preprocessed to reduce noise or eliminate transient artifacts. Then features—numerical representations of the data—are extracted. Finally, a classifier uses these features to create a mapping from the EEG data to class labels (e.g., recognized letters in the case of a BCI speller).
The data was first preprocessed by downsampling the data from 1 kHz to 250 Hz. The CCA and FBCCA methods were
used to extract features (see Section III-C1 and III-C2). Signal classification was done with the maximum feature classifier, which selects the target index corresponding to the maximum correlation between a template signal and an EEG signal. Refer to Figure 1c for a depiction of the signal processing stage.
D. Control and Feedback
The last system involved in SSVEP-based BCIs is the feedback system. The purpose of the feedback system is to update the user on how the BCI is interpreting their brain activity. This may include auditory sounds, changes to the a visual user interface, or even the movements of a unmanned aerial vehicle. This information then allows the user to change their behavior (attend to a new stimulus) and start the process of using the BCI over again.
The control and feedback stage (Figure 1d) of the BCI speller consists of a cue (i.e., alphanumeric character) being displayed on the monitor first, then the estimated target is displayed after the classifier makes a decision. The estimated target is recorded for analysis.
E. Benchmark Dataset
The benchmark dataset is comprised of experimental data collected from 35 participants. Each of the participants was asked to complete a cue guided target selection task. A cue was first displayed on the screen and then the user was asked to gaze at that character (i.e., the target). This data was recorded in 6 s epochs (i.e., trials). The cue was displayed for 0.5 s, the participant was given 5 s to gaze at the target, and then the subject was given 0.5 s to rest their eyes. Six blocks of data were collected, each including data obtained from 40 trials, where each of the trials involved the cue of one of the 40 stimuli.
III. METHODS
Here we detail the signal processing techniques we used to evaluate our majority vote channel selection method.
A. Preprocessing
A bandpass filter is applied to raw signals to remove the unwanted frequency components that do not contribute to the classification results, but preserve the harmonics of the SSVEP [6], [15]. We applied a zero-phase 7–90 Hz Butter-worth infinite impulse response (IIR) filter of order 20 to EEG signals. The first cut-off frequency is set to 7 Hz, which is the lowest target frequency. The second cut-off frequency is set to 90 Hz to include the fifth harmonic of the maximum stimulation frequency (fmax×5<90).
B. Channel Selection
1) Standard Methods: Standard channel selection is per-formed by using a fixed set of 9 electrodes in the occipital region, which is the visual processing region of the brain; therefore, this region has the highest information content relevant to SSVEP.
2) Our Method: In our method, we generate multiple sets of electrodes from a pool of 10 electrodes. In each set {E1, E2, . . . , EV}, 3 electrodes are fixed (Oz, O1, and O2), however, the other 7 (PO3, PO4, PO5, PO6, POz, CB1, CB2) are used to generate a random population of 5 electrodes. The combination of 3 fixed electrodes and 5 random electrodes generate a total of 8 electrodes to form each set. The 3 fixed electrodes are from the most central occipital electrode channels: Oz, O1, and O2 (previous research has confirmed that these three channels normally have the strongest SSVEP for healthy subjects [16]).
For example, {Oz, O1, O2, PO3, PO4, PO5, PO6, POz}
denotes a valid set, conforming to all aforementioned rules for our selection.
Equation 1 formulates the total number of unique combina-tions that can be generated using our methodology,
V = Q!
K!(Q−K)! = 7!
5!(2)! = 21, (1)
whereQis the pool ofrandomelectrodes andKis the number of selected electrodes fromQ.
C. Feature Extraction
We chose three well-known multichannel feature extraction methods to evaluate our majority voting scheme; namely, CCA [5], FBCCA [6], and MSI [7].
All three of these feature extraction methods involve finding a measure of correlation between template signals and EEG signals. These template signals are defined as:
Yi= sin(2π·fi·t) cos(2π·fi·t) .. . sin(2π·Nh·fi·t) cos(2π·Nh·fi·t) , t= 1 Fs , 2 Fs , . . . ,Nt Fs , (2)
wherefi is the SSVEP stimulation frequency to model,Fs is the sampling frequency of the SSVEP data,Nhis the number of harmonics to consider (Nh = 5 in this study), Nt is the number of signal samples, andt is the vector of time points. A reference signal is found for N stimulation frequencies as
Y ∈Y1, Y2, . . . , YNf.
1) CCA: For SSVEP detection, CCA [5] is a statistical method that finds an optimal linear combination to maximize the correlation between a set of template signals (Y) and multichannel EEG signals.
Let X ∈RNc×Nt be a multichannel EEG signal and Y ∈ RNm×Nt be a corresponding reference signal, whereN
cis the number of electrode channels used for analysis andNm= 2Nh. The weights Wx and Wy are found in order to achieve the maximum correlation between x=XTW
x and y=YTWy. These weights are found by solving the following problem:
max Wx,Wy ρ(x, y) = W T x ·XYT ·Wy q WT x ·XXT ·Wx·WyT ·Y YT ·Wy . (3)
A solution to (3) is found using the singular value decompo-sition (SVD) of
Ω =CXX−1/2·CXY ·C
−1/2
Y Y , (4)
where C is the correlation matrix of X and Y, detailed in (7). The singular values ρ1, ρ2, . . . , ρM of matrix Ω are the canonical coefficients (M is the smaller ofNc andNm). The maximum canonical coefficients correspond to the maximum correlation between X andY,thusκi= ˆρi=ρmax are used as features forN stimulus frequencies.
2) FBCCA: FBCCA [6] extends CCA [5] by combining the maximum CCA coefficients from multiple frequency sub-bands of EEG. These sub-sub-bands of EEG are extracted using a filter bank. The maximum coefficients ρˆ1
i,ρˆ2i, . . . ,ρˆ Ns i are combined according to [6]: ¯ ρi= Ns X n=1 w(n)·( ˆρni) 2 , (5)
wherenis the index of Ns sub-bands and
w(n) =n−a+b, n∈[1,2, . . . , Ns]. (6) The parametersaandbcan be determined using a grid search, and were set to 1.25 and 0.25, respectively (according to previous research [6]). The weighted coefficientsκi = ¯ρi are used as features for N stimulus frequencies.
3) MSI: MSI is a measure of synchronization between two signals [7]. In this method, the correlation matrix betweenX
andY is found as:
C= CXX CXY CY X CY Y . (7)
To reduce autocorrelation within X andY (which can cause false detections of SSVEP), the correlation matrix is whitened using the following linear transformation (zero-phase compo-nent or ZCA whitening [17]):
U = " CXX−1/2 0 0 CY Y−1/2 # . (8)
The whitened correlation matrix is calculated as
C0=U CUT. (9)
The eigenvaluesλ1, λ2, . . . , λG (where G=Nc+Nm) ofC0 are then normalized according to
λ0k =
λk
tr(C0). (10)
Finally, the synchronization index is:
β = 1 + PP
k=1λ0klog(λ0k)
log(G) . (11)
The synchronization indexes calculated for N stimulus fre-quencies κi=βi are used as features.
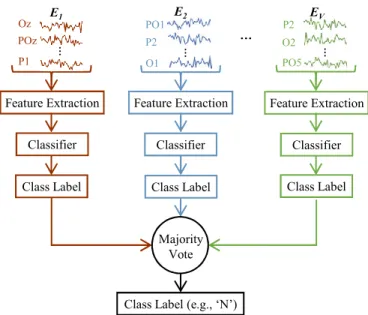
E1 E2 EV ⋮ ⋮ ⋮ P2 PO1 O1 O2 P2 PO5 Oz POz P1 ⋮ Feature Extraction Classifier Feature Extraction Classifier Feature Extraction Classifier
Class Label Class Label Class Label
Class Label (e.g., ‘N’) Majority
Vote
Fig. 2. Majority vote classification process for our channel selection method. Each of the electrode channel combinations{E1, E2, . . . EV}is fed into a
classifier, and the majority vote of the class labels output by these classifiers is the final classification result. For example, one combination includes the signals from channels{Oz, POz,. . ., P1}, and the classifier uses these signals to estimate a class labelLn, n∈[1,2, . . . , V]. This class label is added to
a pool ofV votes, and the majority is chosen as the estimated target.
D. Classification
The third and final signal processing step is classification. The features are used by the classifier to assign a class label (a number) between 1 and N to the filtered signals. Here, we review the maximum feature classification method used by [5]–[7] and describe our majority voting classification method to combine the classification results obtained using the signals from multiple sets of EEG electrode channels.
1) Maximum Feature Classification: The maximum feature method uses the maximum feature extracted usingN template signals for classification (this is referred to as the original
classifier hereafter). The target frequency is estimated as
ˆ
ftarget= max
i κi, i= 1,2, . . . , N, (12) where κi are the features extracted from the N template signals corresponding to each of the target stimulus frequen-cies. The numeric index of the estimated target frequency is the class label output by the maximum feature classifier
(L1, L2, . . . , LN).
2) Majority Voting Classification: Majority voting is a method for combining the outputs of multiple classifiers [18]. For example, consider three classifiers for use in an SSVEP-based BCI: one using CCA, another using FBCCA, and a third using MSI for feature extraction. For a given target, each classifier outputs a class label(L1, L2, L3). The majority vote
is the class label occurring the most frequently in that set. We use majority voting to combine the outputs of multiple classifiers, each using a different electrode set (but the same feature extraction method).
0 1 2 3 4 5 Time Window (s) 0 20 40 60 80 100 120
ITR (bits/min) MV-FBCCA
FBCCA MV-CCA CCA MV-MSI MSI
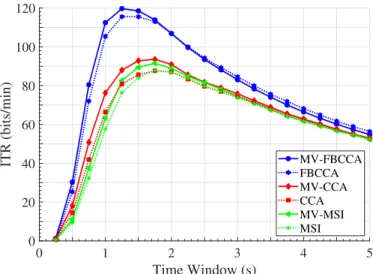
Fig. 3. Average ITR for majority vote classifiers and original classifiers, calculated for all subjects and trial blocks.
The enumeration of these sets was found using the function
combnk in MATLAB® [19]. For a given target, each of the
classifiers corresponding to a single electrode combination out-puts a class label. The final classification result is determined as the majority vote of the 21 labels (see Figure 2).
IV. EXPERIMENTALRESULTS ANDINSIGHTS
A. Experimental Setup
The algorithms explained in Section III were implemented using MATLAB®[19]. The built-incanoncorrandeigare the
principal functions used for the CCA and MSI algorithms, respectively. The scripts were run remotely on an Oracle® Linux Server (Release 7.5) powered by two Intel® Xeon® E5-2680 v4 processors, 256 GB of memory, and two Nvidia® Tesla® K80 GPUs with driver version 396.26.
B. Performance Evaluation
The performance metric used in this study is the information transfer rate (ITR) [20], which was calculated for each subject on a per-trial basis. The formula for ITR is
R= log2N+P·log2P+ (1−P) log2 1−P
N−1, (13)
where R is the ITR (bits/target) and P is the target classi-fication accuracy for a single subject. The ITR (bits/min) is calculated asR·60/T, whereT is the total classification time in seconds, and is equal to the gaze shifting time added to the stimulation time needed for a classification. In this analysis, the time required for a subject to shift their gaze to a symbol following the cue was assumed to be 0.55 s. The size of the EEG signal time interval (∆t) used for classification was ranged from 0.25 s to 5 s in 0.25 s intervals.
C. Results
The classification results from the majority vote classifier and the original classifier were found for each of the three
TABLE I
SIGNIFICANCE OF PER-SUBJECTITRDIFFERENCES BETWEEN MAJORITY VOTE(MV)CLASSIFIERS AND ORIGINAL CLASSIFIERS. TWO-SIDED SIGN TESTS WERE USED TO DETERMINE SIGNIFICANCE AT THE5% LEVEL
FBCCA vs MV-FBCCA CCA vs MV-CCA MSI vs MV-MSI Significantly Improved 7 10 7 No Significant Change 25 19 26 Significantly Reduced 3 6 2
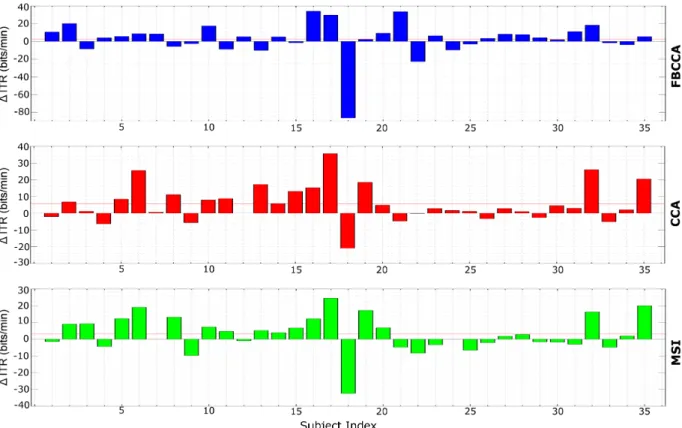
feature extraction methods under study (a total of six unique methods). The majority vote classifiers are denoted as MV-CCA, MV-FBMV-CCA, and MV-MSI (MV for majority vote). The average ITR for all classifiers is shown in Figure 3. These results show that the average ITR of the majority vote classifiers is≈4% higher than that of the standard classifiers. Figure 4 depicts individual differences in performance be-tween the majority vote classifiers and the standard classifiers. Refer to Table I for significance test results of these differ-ences. The statistical distribution of ITR among test subjects is shown in Figure 5. Outliers are data points that fall outside the inner fence of 1.5×IQR, where the interquartile range (IQR) is the likely range of variation.
The Lilliefors test for normality [21] was applied to the per-trial ITR distribution for each subject, and it indicated that these distributions were not normal at the 5% significance level. Therefore, to evaluate the significance of the ITR differ-ences between the majority vote classifiers and the original classifiers for each subject, two-sided sign tests were used to calculate the p-value of these difference distributions. The
p-values of these tests were used to determine whether the majority vote channel selection method significantly improved or decreased the ITR distribution for each subject. We report this improvement or reduction as significant if p <0.05. No significant change is reported if the per-subject ITR distribu-tion was not significantly improved or reduced. The results for this individual analysis are shown in Table I.
The differences in cumulative ITR between the majority vote classifiers and original classifiers are evaluated using paired t-tests, to determine if the majority vote channel se-lection method significantly improves overall ITR. When all subjects are included in analysis, the only classifier showing a significant improvement is CCA, with p <0.01. Because the performance for subject 18 can be considered as a signif-icant outlier, the paired t-tests were also performed with the exclusion of that subject. This provides values ofp <0.05for FBCCA andp <0.01for MSI.
V. DISCUSSION ANDCONCLUSION
In situations when a patient needs access to a BCI system and there is not adequate time for finding optimal electrode channel selections, the proposed majority vote channel selec-tion method can prove useful by utilizing the informaselec-tion from
Fig. 4. Individual differences in ITR between majority vote FBCCA (MV-FBCCA) and original FBCCA methods (top), MV-CCA and original CCA methods (middle), and MV-MSI and original MSI methods (bottom). The red lines indicate the average ITR difference.
MV-FBCCA
FBCCA MV-CCA CCA MV-MSI
MSI 50 100 150 200 ITR (bits/min)
Fig. 5. Subject ITR distributions for each of the classifiers under study. The whiskers show the extreme accuracies excluding outliers. Outliers are shown as individual “+” marks. Boundaries are determined by the 25th and 75th percentiles.
a large set of possible electrode channel combinations rather than a single combination chosena priori. It could also benefit people with neurological diseases that significantly alter scalp distributions of EEG signals. One of the next steps in this research is to test our channel selection method on a dataset
of EEG signals taken from people with these types of diseases. As we observed with the performance of some test sub-jects, notably subject 18, the method fails in cases when maximum features extracted from the majority of electrode combinations consistently produce the same wrong result. Our hypothesis is that a soft voting process like a random forest would improve the worst cases observed for our majority vote classifier without negatively impacting the best cases. An implementation of this would involve applying weights to the maximum features extracted from the multiple electrode combinations. Another possibility to enhance the performance of our method is increasing the number of electrode channel combinations. This will be the topic of future research.
In this paper, we proposed a majority vote classifier based on a new channel selection method for SSVEP-based BCIs that does not require calibration data or optimization, and our evaluation using a benchmark dataset shows that this new method can significantly outperform thea priorichannel selection method when using CCA for feature extraction.
REFERENCES
[1] J. R. Wolpaw, R. S. Bedlack, D. J. Reda, R. J. Ringer, P. G. Banks, T. M. Vaughan, S. M. Heckman, L. M. McCane, C. S. Carmack, S. Winden, D. J. McFarland, E. W. Sellers, H. Shi, T. Paine, D. S. Higgins, A. C. Lo, H. S. Patwa, K. J. Hill, G. D. Huang, and R. L. Ruff, “Independent home use of a brain-computer interface by people with amyotrophic lateral sclerosis,” Neurology, 2018. [Online]. Available: http://n.neurology.org/content/early/2018/06/27/WNL.0000000000005812
[2] A. Nourmohammadi, M. Jafari, and T. O. Zander, “A survey on unmanned aerial vehicle remote control using brain-computer interface,” IEEE Transactions on Human-Machine Systems, vol. 48, no. 4, pp. 337– 348, Aug 2018.
[3] T. Xu, Y. Zhou, Z. Wang, and Y. Peng, “Learning Emotions EEG-based Recognition and Brain Activity: A Survey Study on BCI for Intelligent Tutoring System,” Procedia Computer Science, vol. 130, pp. 376 – 382, 2018, the 9th International Conference on Ambient Systems, Networks and Technologies (ANT 2018) / The 8th International Conference on Sustainable Energy Information Technology (SEIT-2018) / Affiliated Workshops. [Online]. Available: http://www.sciencedirect.com/science/article/pii/S1877050918304095 [4] B. Kerous, F. Skola, and F. Liarokapis, “EEG-based BCI and video
games: a progress report,” Virtual Reality, vol. 22, no. 2, pp. 119–135, Jun 2018. [Online]. Available: https://doi.org/10.1007/s10055-017-0328-x
[5] Z. Lin, C. Zhang, W. Wu, and X. Gao, “Frequency recognition based on canonical correlation analysis for SSVEP-based BCIs,”IEEE transac-tions on biomedical engineering, vol. 53, no. 12, pp. 2610–2614, 2006. [6] X. Chen, Y. Wang, S. Gao, T.-P. Jung, and X. Gao, “Filter bank canonical correlation analysis for implementing a high-speed SSVEP-based brain– computer interface,”Journal of neural engineering, vol. 12, no. 4, p. 046008, 2015.
[7] Y. Zhang, P. Xu, K. Cheng, and D. Yao, “Multivariate synchronization index for frequency recognition of SSVEP-based brain-computer interface,” Journal of Neuroscience Methods, vol. 221, pp. 32 – 40, 2014. [Online]. Available: http://www.sciencedirect.com/science/article/pii/S0165027013002677 [8] S. Morgan, J. Hansen, and S. Hillyard, “Selective attention to stimulus
location modulates the steady-state visual evoked potential,”Proceedings of the National Academy of Sciences, vol. 93, no. 10, pp. 4770–4774, 1996.
[9] X. Chen, Y. Wang, M. Nakanishi, X. Gao, T.-P. Jung, and S. Gao, “High-speed spelling with a noninvasive brain–computer interface,” Proceedings of the national academy of sciences, vol. 112, no. 44, pp. E6058–E6067, 2015.
[10] Z. Wu, Y. Lai, Y. Xia, D. Wu, and D. Yao, “Stimulator selection in SSVEP-based BCI,”Medical Engineering & Physics, vol. 30, no. 8, pp. 1079–1088, oct 2008.
[11] L. Meng, J. Jin, and X. Wang, “A comparison of three electrode channels selection methods applied to SSVEP BCI,” in2011 4th International Conference on Biomedical Engineering and Informatics (BMEI). IEEE, oct 2011.
[12] S. Sun, C. Zhang, and Y. Lu, “The random electrode selection ensemble for EEG signal classification,” Pattern Recognition, vol. 41, no. 5, pp. 1663 – 1675, 2008. [Online]. Available: http://www.sciencedirect.com/science/article/pii/S0031320307004864 [13] Y. Wang, X. Chen, X. Gao, and S. Gao, “A benchmark dataset for
SSVEP-based brain–computer interfaces,”IEEE Transactions on Neural Systems and Rehabilitation Engineering, vol. 25, no. 10, pp. 1746–1752, 2017.
[14] V. Jurcak, D. Tsuzuki, and I. Dan, “10/20, 10/10, and 10/5 systems revis-ited: their validity as relative head-surface-based positioning systems,” Neuroimage, vol. 34, no. 4, pp. 1600–1611, 2007.
[15] G. Bin, X. Gao, Z. Yan, B. Hong, and S. Gao, “An online multi-channel ssvep-based braincomputer interface using a canonical correlation analysis method,” Journal of Neural Engineering, vol. 6, no. 4, p. 046002, 2009. [Online]. Available: http://stacks.iop.org/1741-2552/6/i=4/a=046002
[16] S. Parini, L. Maggi, A. C. Turconi, and G. Andreoni, “A Robust and Self-Paced BCI System Based on a Four Class SSVEP Paradigm: Algorithms and Protocols for a High-Transfer-Rate Direct Brain Com-munication,”Computational Intelligence and Neuroscience, vol. 2009, pp. 767 – 791, 2009.
[17] A. Kessy, A. Lewin, and K. Strimmer, “Optimal whitening and decor-relation,”The American Statistician, 12 2015.
[18] S. Tulyakov, S. Jaeger, V. Govindaraju, and D. Doermann,Review of Classifier Combination Methods. Berlin, Heidelberg: Springer Berlin Heidelberg, 2008, pp. 361–386.
[19] MATLAB,version 9.2.0.556344 (R2017a). Natick, Massachusetts: The MathWorks Inc., 2017.
[20] J. R. Wolpaw, H. Ramoser, D. J. McFarland, and G. Pfurtscheller, “EEG-based communication: improved accuracy by response verification,”
IEEE Transactions on Rehabilitation Engineering, vol. 6, no. 3, pp. 326–333, Sep 1998.
[21] H. W. Lilliefors, “On the Kolmogorov-Smirnov Test for Normality with Mean and Variance Unknown,” Journal of the American Statistical Association, vol. 62, no. 318, pp. 399–402, 1967. [Online]. Available: http://www.jstor.org/stable/2283970