Am. J. Hum. Genet. 70:1152–1171, 2002
1152
Reduced-Median-Network Analysis of Complete Mitochondrial DNA
Coding-Region Sequences for the Major African, Asian,
and European Haplogroups
Corinna Herrnstadt,
1Joanna L. Elson,
3Eoin Fahy,
1Gwen Preston,
1Douglass M. Turnbull,
3Christen Anderson,
1Soumitra S. Ghosh,
1Jerrold M. Olefsky,
2M. Flint Beal,
4,*Robert E. Davis,
1,†and Neil Howell
1,51MitoKor and2Veterans Administration Medical Center, San Diego;3Department of Neurology, University of Newcastle upon Tyne, Newcastle
upon Tyne;4Department of Neurology, Massachusetts General Hospital, Harvard Medical School, Boston; and5Department of Radiation
Oncology, University of Texas Medical Branch, Galveston
The evolution of the human mitochondrial genome is characterized by the emergence of ethnically distinct lineages or haplogroups. Nine European, seven Asian (including Native American), and three African mitochondrial DNA (mtDNA) haplogroups have been identified previously on the basis of the presence or absence of a relatively small number of restriction-enzyme recognition sites or on the basis of nucleotide sequences of the D-loop region. We have used reduced-median-network approaches to analyze 560 complete European, Asian, and African mtDNA coding-region sequences from unrelated individuals to develop a more complete understanding of sequence diversity both within and between haplogroups. A total of 497 haplogroup-associated polymorphisms were identified, 323 (65%) of which were associated with one haplogroup and 174 (35%) of which were associated with two or more haplogroups. Approximately one-half of these polymorphisms are reported for the first time here. Our results confirm and substantially extend the phylogenetic relationships among mitochondrial genomes described elsewhere from the major human ethnic groups. Another important result is that there were numerous instances both of parallel mutations at the same site and of reversion (i.e., homoplasy). It is likely that homoplasy in the coding region will confound evolutionary analysis of small sequence sets. By a linkage-disequilibrium approach, additional evidence for the absence of human mtDNA recombination is presented here.
Introduction
The first complete sequence of human mtDNA, the Cam-bridge reference sequence (CRS), was published in 1981 (Anderson et al. 1981) and has recently been revised (the revised CRS is herein termed the “rCRS”) (Andrews et al. 1999). Variations in the mtDNA sequence have been analyzed in human populations, both in terms of evo-lution and population dispersals and in terms of the role that mtDNA mutations play in human disease (Torroni et al. 1996; Howell 1999; Wallace et al. 1999; Ingman et al. 2000). However, the generation of comprehensive and unambiguous phylogenetic data, especially for the mtDNA coding regions, is limited by the availability of a relatively small number of polymorphisms that have Received November 27, 2001; accepted for publication January 30, 2002; electronically published April 5, 2002.
Address for correspondence and reprints: Dr. Corinna Herrnstadt, MitoKor, 11494 Sorrento Valley Road, San Diego, CA 92121. E-mail: herrnstadtc@mitokor.com
* Present affiliation: Department of Neurology, Cornell Medical Center, New York.
† Present affiliation: Acadia Pharmaceuticals, San Diego.
䉷2002 by The American Society of Human Genetics. All rights reserved. 0002-9297/2002/7005-0008$15.00
been identified on the basis of the presence or absence of restriction-enzyme recognition sites (Torroni et al. 1996; Wallace et al. 1999). Alternatively, sequences from the first hypervariable segment of the rapidly evolving noncoding control region, or D-loop, have been used to establish phylogenetic networks of European mtDNA sequences (Richards et al. 1996, 1998), and a combi-nation of both methods was recently used for a com-parative analysis (Macaulay et al. 1999). Reliance on hypervariable control-region sequences, however, is not without controversy, particularly because of the effects that homoplasy and saturation have at sites with high mutation rates (e.g., see Howell et al. 1996).
Only recently have complete mtDNA sequences been analyzed (Ingman et al. 2000; Finnila¨ et al. 2001; Maca-Meyer et al. 2001; Torroni et al. 2001b). One view is that these studies marked the beginning of the mito-chondrial population-genomics era (Hedges 2000), but the amount of data for mtDNA polymorphisms in di-verse human populations is still limited. We report here complete mtDNA coding sequences from 560 unrelated individuals that were collected from U.S. and U.K. pop-ulations. All nine European haplogroups (435 individ-ual mtDNA sequences), the three African haplogroups
Herrnstadt et al.: Network Analysis of mtDNA Haplogroups 1153
(56 sequences), and five major Asian haplogroups (69 sequences) were analyzed using reduced median net-works (Bandelt et al. 1995). In this initial analysis of these mtDNA sequences, we focus on haplogroup-specific and haplogroup-associated polymorphisms because of their fundamental importance in studies of human evolution, phylogeography, and population genetics (e.g., see Richards et al. 1996, 1998, 2000; Finnila¨ et al. 2001).
It should be noted that the mtDNA sequences ana-lyzed here were not derived from a single geographical or ethnic population, so it is not possible to derive con-clusions about the population demographics and phy-logeography of modern humans. Instead, our interest lies more in understanding (1) the processes (i.e., mu-tation, segregation, and selection) that determine hu-man mtDNA evolution and (2) the role that mtDNA-sequence changes play in human disease. As one ex-ample of the complexities of the second issue, there are several reports that have identified pathogenic mtDNA-sequence changes, but those changes are more likely to be pathogenically benign polymorphisms that are as-sociated with particular mtDNA haplogroups (e.g., see Lin et al. 1992; Chagnon et al. 1999). There are several reports of diseases that are preferentially associated with an mtDNA haplogroup (e.g., see Chinnery et al. 2000; Ruiz-Pesini et al. 2000), and it is thus becoming im-portant, for multiple reasons, to extend our understand-ing of mtDNA haplogroups.
Subjects, Material, and Methods
Subjects and DNA Samples
Blood samples and frozen brain samples were col-lected from maternally unrelated individuals (as deter-mined from family-history information) in the United States and the United Kingdom after institutional review board approval and informed consent. We have here included the 64 European and 2 African mtDNA se-quences that were previously analyzed for recombina-tion (Elson et al. 2001). The U.S. and U.K. samples were from the general population, and the individuals in-cluded normal controls, patients with type 2 diabetes, and patients with neurodegenerative disorders (e.g., Alz-heimer disease [AD] or Parkinson disease). The sole ex-ception is that sequence 104 is the mtDNA from the CCL2 HeLa cell culture, and the complete sequence, including noncoding control region, is described else-where (Herrnstadt et al., in press).
Total cellular DNA was prepared from either white blood cells or frozen brain tissue, by homogenization and cell lysis at 37⬚C for 12 h in “TE” buffer (i.e., 10 mM Tris-HCl, pH 7.5; 1 mM EDTA) that contained proteinase K (400 mg/ml) and 1% SDS. This step was
followed by phenol:chloroform:isoamyl alcohol (50: 48:2) and chloroform:isoamyl alcohol (24:1) extrac-tions. Alternatively, mitochondria were isolated from frozen brain tissue, and mtDNA was extracted as de-scribed elsewhere (Mecocci et al. 1994). DNA concen-trations were determined by UV absorption.
DNA Sequencing
The majority (89%) of the mtDNA genome sequences were determined by a largely automated approach at MitoKor, in San Diego. The mtDNA was amplified in 68 fragments, each ∼550 bp in length and with 50% overlap between neighboring fragments. PCR primers were 16–26 nt in length and were designed to be com-plementary to the light and heavy strands of the rCRS (Andrews et al. 1999). All liquid handling was per-formed by a Biorobot 9600 (Qiagen). PCR amplifica-tions were set up in triplicate, each containing 25–50 ng total cellular DNA or 1 ng mtDNA, 100 ng each of the forward and reverse primers, and 12.5 ml of TaqPCR Master Mix (Qiagen) in a reaction volume of 25ml. After denaturation at 95⬚C for 2 min, amplification was per-formed for 30 three-step cycles of 95⬚C for 10 s, 60⬚C for 10 s, and 72⬚C for 1 min, followed by 72⬚C for 4 min and cooling to 4⬚C. Triplicate reactions were pooled and purified with the QIAquick 96 PCR Purification Kit (Qiagen). Sequencing reactions were performed with 3 ml of PCR product, forward or reverse PCR primer, and BigDyeTerminator chemistry (PE Applied Biosystems). Sequencing reactions were manually purified using Cen-tri-Sep 96 plates (Princeton Separations). Electrophoresis and base “calling” were performed using a 3700 DNA Analyzer (PE Applied Biosystems).
Sequencing of mtDNA by the University of Newcastle group entailed PCR amplification of 28 overlapping mtDNA fragments that were then sequenced in both forward and reverse directions by use of BigDyeTermina-tor chemistry (PE Applied Biosystems). Electrophoresis, sequence analysis, and comparison to the rCRS were performed using a Model 377 DNA Sequencing System and Sequence Navigator plus Factura software (PE Ap-plied Biosystems). The manual sequencing approach used by the University of Texas Medical Branch group involved PCR amplification of∼300 bp of partially over-lapping mtDNA segments, by use of a total of 66 primers andTaqpolymerase; ligation of each amplified segment into M13 vector; transformation; and selection of re-combinant colonies, by use of standard protocols. Pu-rified single-stranded phagemid DNA was sequenced us-ing a standard dideoxy-chain–termination protocol, [a35S]-dATP, universal M13 primers, and high-resolution polyacrylamide gradient gels.
1154 Am. J. Hum. Genet. 70:1152–1171, 2002 Sequence Analysis and Quality Control
Sequence data for the PCR fragments produced by the automated setup at MitoKor were built into contiguous mtDNA sequences by use of extensive modifications of the source code for the CAP software (see the EMBnet Web site) (Thompson et al. 1994). These sequences were then aligned with the rCRS (Andrews et al. 1999) by use of publicly available software (Pearson et al. 1990; programs are available from David Hudson, University of Virginia, P.O. Box 9025, Charlottesville, Virginia 22906-9025) that had been modified to identify mtDNA nucleotide substitutions. The PCR primers were de-signed to provide∼50% overlap between neighbors (the primer sequences are not included in the sequence anal-ysis). Therefore, because both strands of mtDNA are sequenced, each base pair is sequenced up to four times to provide a high degree of quality control. We estimate that 97% of the sites in the mtDNA sequences that we studied produced unambiguous results in three or four of the sequencing reactions and that only 3% of the bases were called with two sequencing reactions. Any mtDNA region for which there was sequence informa-tion from only one reacinforma-tion was resequenced. Addiinforma-tional quality-control measures included the following:
1. For 13 individuals, the same mtDNA was se-quenced and analyzed twice in a blinded, independent fashion, and perfect agreement for the entire mtDNA sequence was obtained for all of these paired analyses. 2. In 28 experiments, mtDNA sequences for the same individual have been determined from either two dif-ferent tissues or two difdif-ferent regions of the brain. In all these instances, sequence agreement was perfect. Therefore, we believe that the degree of accuracy of the sequences reported here is very high. The most serious limitation is that heteroplasmy (i.e., the presence of two or more mtDNA genotypes in a DNA sample) at a site could not be detected because the sequencing software calls only the majority base. Visual examination of the electropherograms that included ambiguous base calls did not reveal any instances of heteroplasmy, but it is clear that a comprehensive and sensitive assessment of heteroplasmy was beyond the technical boundaries of our sequencing approach.
Evolutionary Analysis of Sequences
It is now recognized that standard phylogenetic meth-ods that are based on bifurcating trees, such as maxi-mum-parsimony (MP) analysis, are not best suited for analysis at the intraspecific level (Posada and Crandall 2001). Such confounding phenomena as homoplasy, extant ancestral sequences, and multifurcations (“star” phylogenies) are especially acute for human mtDNA
sequences. Therefore, mtDNA gene genealogies were constructed using reduced-median-network approaches (available in the Network 3.1 program, from the Fluxus Engineering Web site) (Bandelt et al. 1995). All nucleotide substitutions are indicated relative to the rCRS, and they are designated by two letters bracketing a number (e.g., A750G): the first letter denotes the L-strand nucleotide in the rCRS sequence, the number denotes the nucleotide position, and the second letter denotes the non-rCRS al-lele. In addition, substitutions limited to the outgroup sequence are not shown in the networks. (Further details are presented in the appropriate subsections of “Results.”) Recombination/Linkage Disequilibrium(LD)Analysis
LD values for pairs of mtDNA sites were calculated using both the r2 and d measures as described in our previous study (Elson et al. 2001). LD values as a func-tion of the shortest distance between sites within the circular mitochondrial genome were then derived as Pearson correlation coefficients. The statistical signifi-cance of the correlation coefficients was determined with the randomization approach that was used in the pre-vious reports (Awadalla et al. 1999; Elson et al. 2001). As in our previous study, data sets were randomized 5,000 times.
Results
The mtDNA-Sequence Set and Haplogroup-Associated Polymorphisms
We have assembled and analyzed complete mtDNA coding-region sequences for 560 maternally unrelated individuals of European, African, and Asian descent. In these analyses, the coding region spans nucleotide po-sitions 577–16023, and it includes a small number of intergenic noncoding-spacer base pairs. The coding-re-gion sequences for these 560 mtDNA sequences are pub-lished at the MitoKor Web site.
These sequences were initially assigned to haplo-groups by use of the polymorphisms that have previously been reported (table 1). Only two of these sequences (mtDNA sequences 327 and 536, the latter of which is described in “The Asian mtDNA Network,” below) could not be assigned unambiguously to one of the major haplogroups. The distributions of mtDNA haplogroups, among 435 sequences of European origin that were col-lected in the United States and United Kingdom, were as follows: 52.0%, for haplogroup H (np226); 3.2%, for haplogroup I (np14); 7.6%, for haplogroup J (np33); 10.8%, for haplogroup K (np47); 10.6%, for haplogroup T (np46); 9.7%, for haplogroup U (np42); 1.8%, for haplogroup V (np8); 1.8%, for haplogroup W (np8); and 2.5%, for haplogroup X
Herrnstadt et al.: Network Analysis of mtDNA Haplogroups 1155
Table 1
Previously Established Haplogroup-Specific Polymorphisms
Haplogroup Nucleotide Substitution(s) Reference(s)
A A663G Torroni et al. (1992)
B 9-bp deletiona, T16519Cb Torroni et al. (1992)
C A13263G Torroni et al. (1992)
D C2092T, C5178A, C8414T Torroni et al. (1992), Torroni and Wallace (1994)
E G7598A Torroni et al. (1994b)
H 7028C, 14766C Torroni and Wallace (1994), Macaulay et al. (1999)
H1 G3010A Finnila¨ et al. (2001)
H2 1438A, 4769A Finnila¨ et al. (2001)
I G1719A, G8251A, T10238C Torroni et al. (1996), Macaulay et al. (1999) J T4216C, A12612G, G13708A Torroni et al. (1994a), Macaulay et al. (1999)
J1 G3010A Finnila¨ et al. (2001)
J2 C7476T, G15257A Finnila¨ et al. (2001)
K A1811G, G9055A, A12308G, G12372A Torroni et al. (1996), Macaulay et al. (1999), Finnila¨ et al. (2001)
L T10873C Quintana-Murci et al. (1999)
L1 G2758A, C3594T, T10810C Chen et al. (1995)
L1a C4312T Macaulay et al. (1999)
L1b T2352C Rando et al. (1998)
L1c A9072G, A12810G Rando et al. (1998)
L2 C3594T Chen et al. (1995)
L2a A13803G Chen et al. (2000)
L2b A4158G Chen et al. (2000)
L3 3594C Wallace et al. (1999)
L3b G8616A, A11002G Quintana-Murci et al. (1999), Chen et al. (2000)
L3d T8618C Rando et al. (1998)
L3e T2352C Rando et al. (1998)
M C10400T, T10873C Torroni et al. (1993), Quintana-Murci et al. (1999)
T G709A, G1888A, A4917G, T10463C, G13368A, G14905A, A15607G, G15928A
Torroni et al. (1996), Macaulay et al. (1999), Finnila¨ et al. (2001)
T1 C12633A Finnila¨ et al. (2001)
T2 A11812G, A14233G Finnila¨ et al. (2001)
U A12308G, G12372A Torroni et al. (1996), Macaulay et al. (1999)
U2 A1811G, G9055A, A12308G, G12372A Finnila¨ et al. (2001)
U4 A1811G, T4646C, C11332T Macaulay et al. (1999), Finnila¨ et al. (2001)
U5 T3197C Macaulay et al. (1999)
U5a A7768G Finnila¨ et al. (2001)
U5a1 A14793G Finnila¨ et al. (2001)
U5b A5656Gc Finnila¨ et al. (2001)
U6 G7805A, T14179C Maca-Meyer et al. (2001)
V G4580A, C15904T Torroni et al. (1996), Macaulay et al. (1999)
W G709A, T1243C, G8251A, G8994A Torroni et al. (1996), Finnila¨ et al. (2001) X T6221C, G1719A, T14470C Macaulay et al. (1999), Finnila¨ et al. (2001)
NOTE.—All polymorphisms are located in mtDNA coding regions unless otherwise indicated.
a Between COII and tRNALys(noncoding spacer). b Located at nucleotide position 16519 (control region). c Located at nucleotide position 5656 (noncoding spacer).
(np11). These proportions differ from those in surveys of European populations (Torroni et al. 1996; Wallace et al. 1999) in that our data set has higher proportions of mtDNA from haplogroups H and K, as well as un-derrepresentation of mtDNA sequences from haplo-groups J, U, and V. The reasons for these frequency differences are unknown. No mtDNA from European haplogroup Z (Finnila¨ et al. 2001) was found among the sequences from the individuals of European descent whom we studied. It has recently been shown by the same investigators (Meinila¨ et al. 2001) that haplogroup
Z probably represents an Asian contribution to the Eu-ropean mtDNA gene pool, because these mtDNA se-quences carry the polymorphisms that are associated with haplogroup C of superhaplogroup M.
mtDNA samples from Asian haplogroups A–E and African haplogroups L1, L2, and L3 mtDNA sequences were obtained from 69 Asian or Hispanic individuals and from 56 African American individuals, respectively. All except one of these individuals were from the United States (one L1 haplotype was collected in the United Kingdom).
1156 Am. J. Hum. Genet. 70:1152–1171, 2002 Mitochondrial gene genealogies were constructed
us-ing reduced-median-network analysis (Bandelt et al. 1995). We chose to weight all nucleotide positions, in-cluding site 10398, equally (see the different approach of Finnila¨ et al. 2001). The outgroup used for the Asian and European networks is an mtDNA sequence from haplogroup L3e (sample 216 from the African network), which is the most recent common ancestor to these ma-jor sequence groups. No outgroup was used for the Af-rican network, because the mtDNA sequence for the chimpanzee, representing the closest living evolutionary relative to humans, is too divergent for meaningful anal-ysis (e.g., see Posada and Crandall 2001).
In the present analysis, we focus on haplogroup-as-sociated mtDNA polymorphisms in the coding region. As the initial step in the analysis, a haplogroup-associ-ated polymorphism was defined as a sequence change that occurs in at least two members from one branch of the same haplogroup. Prior to the construction of in-dividual networks, we determined that our entire data set of 560 mtDNA sequences contained 636 sequence changes that occurred in the coding regions of at least two individuals. Of these changes, 139 were eliminated from the present analysis because they were present only in a single mtDNA in each of two or more haplogroups and therefore do not produce any phylogenetic signal. Overall, therefore, the data reported here encompass 497 haplogroup-associated polymorphisms in the mtDNA coding region, 323 of which are limited to a single hap-logroup and 174 of which are found in two or more haplogroups (table 2).
At one extreme, some of these 497 polymorphisms occur in all mtDNA sequences within a haplogroup but not in mtDNA sequences from other haplogroups. These are haplogroup-defining polymorphisms, of which sev-eral key examples are listed in table 1, and many more are displayed within the networks in figures 1–4. There are other polymorphisms that occur only in a subset of mtDNA sequences and that define a subcluster of the haplogroup. Within this group, some of these polymor-phisms have arisen once during evolution and are as-sociated only with the subcluster; these can be termed “haplogroup specific.” However, we have observed a large group of polymorphisms that are associated with mtDNA sequences from two or more haplogroups. In some cases, these are “old” polymorphisms that have arisen once and that are related by descent in two or more haplogroups. For example, a polymorphism at nu-cleotide position 4216 occurred in the common ancestor to sister haplogroups J and T. In other instances, the same polymorphism has arisen independently (i.e., ho-moplasy) in two or more haplogroups, in each of which it is associated with a subcluster of sequences. Network analysis also indicates that some polymorphisms have arisen more than once within the same haplogroup.
Of the total of 497 polymorphisms, 235—almost one-half—are novel (underlined nucleotide positions in figs. 1–4). That is, to the best of our knowledge, none of these 235 polymorphisms have been reported in the scientific literature or at the Mitomap Web site. In ad-dition, it is worth noting that nucleotide positions listed at Mitomap frequently do not indicate association with a particular mtDNA haplogroup. Thus, in the present analysis, we have identified 103 Mitomap polymor-phisms that are haplogroup associated or haplogroup specific.
With some rare exceptions, the A750G, A1438G, A4769G, A8860G, and A15326G polymorphisms are common to mtDNA sequences from the African, the Asian, and the European haplogroups, (see table 2), and they are not displayed in the respective networks. The A alleles of these five polymorphisms define a subcluster of haplogroup H that includes the rCRS sequence. In addition, the 750A allele (i.e., the rCRS allele) was pre-sent in three L3e mtDNA haplotypes; the 1438A allele was present in two I and the six L1 haplotypes that comprise the L1a and L1c subclusters; and the 15326A allele was present in two L2b haplotypes (figs. 1 and 4). Thus, these results appear to reflect homoplasies in which mutation from the non-rCRS allele to the rCRS allele has occurred two or three times, once in the rCRS subcluster of haplogroup H. The A2706G and C7028T polymorphisms are not present in most of the haplo-group H mtDNA sequences (table 2), and they are dis-played in the European and the H/V “skeleton” net-works (figs. 3 and 4; for further discussion, see “The Superhaplogroup H/V Network,” below). The 2706A allele, characteristic of mtDNA sequences from haplo-group H, is also carried by two J haplotypes (fig. 4). The G11719A polymorphism is present in all African and Asian haplotypes (table 2) and therefore is displayed only in the H/V and European networks. The C14766T substitution is also common to all African haplotypes, as well as to all but one Asian haplotype, and therefore is not shown in those networks. Nucleotide positions 10398 and 12705 are discussed in the context of the individual networks below.
The African mtDNA Network
The 56 African mtDNA sequences were grouped into 13 L1, 23 L2, and 20 L3 haplotypes (fig. 1). Subhap-logroups of L1 and L3 were designated “L1a,” “L1b,” “L1c,” “L3b,” “L3d,” and “L3e,” as described else-where (Watson et al. 1997; Rando et al. 1998). Note, however, that Chen et al. (2000) use a different num-bering system, although most of the African American mtDNA subhaplogroups that we report here can also be found among the sub-Saharan African subhaplo-groups that Chen et al. have reported elsewhere
(com-Figure 1 Phylogenetic network of 56 African mtDNA sequences based on coding-region variations relative to the rCRS. Weights of all nucleotide positions, including site 10398, were equal. Numbers in nodes indicate mtDNA sequences. Nucleotide positions in red are haplogroup specific and appear only on one branch of one haplogroup; nucleotide positions in black are haplogroup associated and occur at least twice within and/or outside this network (see table 2). Underlined nucleotide positions are novel and are reported here for the first time. The black square was chosen deliberately as the center point of the network. In this network, as well as in all other networks (figs. 2–4), nucleotide substitutions are transitions unless indicated otherwise by suffixes, which denote transversions. Some branch lengths have been distorted to increase legibility.
1158
Table 2
Polymorphisms That Are Associated with More than One Haplogroup
NUCLEOTIDE POSITIONa NO.OFPOLYMORPHISMS INHAPLOGROUPb A (25) B (18) C (13) D (9) E (3) H (226) I (14) J (33) K (47) L1 (13) L2 (23) L3 (20) M (1) T (46) U (42) V (8) W (8) X (11) 593 1 1 2 709 2 3 9 7 1 46 1 8 750 25 18 13 9 3 218 14 33 47 13 23 17 1 46 42 8 8 11 769 13 23 930 1 1 16 1018 13 23 1438 25 18 13 9 3 208 12 33 47 6 23 20 1 46 42 8 8 11 1598 2 1 1 1719 2 14 1 1 11 1811 1 46 15 1888 2 6 1 46 2158 2 1 2217 1 5 2332 4 2 2352 7 11 2706 25 18 13 9 3 13 14 31 47 13 23 20 1 46 42 8 8 11 3010 9 73 27 1 1 3 3027 1 1 3197 24 3308 7 1 3316 2 1 1 1 1 3394 1 1 2 3438 1 1 3 3547 14 2 3552A 12 1 3591 1 2 3594 13 23 3666 1 2 11 3693 7 1 3705 2 1 1 1 3796T 1 2 3796 1 3 3915 1 9 1 3918 1 7 1 1 4104 13 23 1 4185 1 2 4216 2 33 1 46 4561 1 8 1 4646 1 5 4688 1 2 4767 1 3 4769 25 18 13 9 3 209 14 33 47 13 23 20 1 46 42 8 8 11 4793 5 1 4820 17 1 4824 25 1 4917 1 46 5004 11 1 5046 7 1 8 5147 1 1 3 16 5231 5 2 5319 1 2 5426 7 7 5442 1 2 1 5460 1 2 2 2 1 1 8 5581 3 1 5656c 1 4 5913 1 4 5999 1 5 6023 3 2 1 1 6150 2 1 6152 2 1 7 6221 1 11 1 11 6253 1 2 (continued)
1159 Table 2 (continued) NUCLEOTIDE POSITIONa NO.OFPOLYMORPHISMS INHAPLOGROUPb A (25) B (18) C (13) D (9) E (3) H (226) I (14) J (33) K (47) L1 (13) L2 (23) L3 (20) M (1) T (46) U (42) V (8) W (8) X (11) 6260 1 2 1 6 1 6413 3 1 6671 1 1 2 6680 1 2 6719 1 2 6734 1 4 6755 2 1 6827 1 1 7 7028 25 18 13 9 3 12 14 33 47 13 23 20 1 46 42 8 8 11 7055 1 11 7256 13 23 7424 1 3 7521 13 23 8027 25 4 8251 13 1 8 8269 8 1 8473 4 2 8572 1 2 8616 2 1 8618 2 3 8697 1 1 46 8701 13 9 3 13 23 20 1 1 8860 25 18 13 9 3 220 14 33 47 13 23 20 1 46 42 8 8 11 9055 1 47 9117 1 3 9266 1 1 3 9449 1 2 6 9540 13 9 3 13 23 20 1 9545 1 12 1 1 9548 2 2 9554 1 1 1 2 9667 1 8 9755 1 2 9947 3 1 9950 12 1 10084 4 1 1 10373 1 6 1 10398 13 9 3 13 29 33 13 23 20 1 10400 13 9 3 1 10454 2 1 10586 1 4 10589 2 2 1 10598 1 1 2 10685 1 1 3 1 10810 2 13 10819 1 11 10873 13 9 3 13 23 20 1 10907 1 2 10915 1 3 2 11002 2 3 11176 2 1 1 11251 33 46 11353 2 1 11377 3 1 11467 46 42 11641 2 1 11719 25 18 13 9 3 6 14 33 47 13 23 20 1 46 42 8 11 11800 2 3 11812 1 35 11914 12 3 13 3 18 1 2 12007 22 1 2 2 1 12308 47 42 12346 1 1 1 2 (continued)
1160 Am. J. Hum. Genet. 70:1152–1171, 2002 Table 2 (continued) NUCLEOTIDE POSITIONa NO.OFPOLYMORPHISMS INHAPLOGROUPb A (25) B (18) C (13) D (9) E (3) H (226) I (14) J (33) K (47) L1 (13) L2 (23) L3 (20) M (1) T (46) U (42) V (8) W (8) X (11) 12372 1 47 42 12414 1 1 8 12630 2 3 12642 2 2 12705 25 13 9 3 14 13 23 19 1 8 11 12811 2 1 13020 2 7 1 13105 2 13 10 1 13263 12 4 13590 17 23 13650 13 23 13708 3 1 4 33 3 1 5 13734 2 7 13886 1 3 13934 5 3 13966 3 11 13980 1 2 14182 1 1 8 14212 2 11 14233 1 35 14308 1 1 2 14364 4 1 1 14470 1 1 1 1 11 14560 1 11 14569 3 2 1 14766 25 17 13 9 3 2 11 33 46 13 23 20 1 46 42 8 11 14769 1 6 1 14783 13 9 3 1 14798 24 47 14905 3 46 15043 13 9 3 13 1 5 15099 1 2 15110 1 3 1 15115 1 7 15218 2 13 15236 2 1 15244 1 7 15257 6 3 15301 1 13 9 3 1 1 23 20 1 1 15326 25 18 13 9 3 220 14 33 47 13 21 20 1 46 42 8 8 11 15452A 33 46 15670 1 2 5 15758 6 1 1 15775 1 2 15784 1 1 1 1 17 3 4 15812 3 1 15884 1 3 4 15924 3 11 1 12 2 1 15930 6 2 1
a Capital-letter suffixes that follow some nucleotides indicate transversions and the new L-strand base. b Numbers in parentheses denote the number of sequences for each haplogroup.
c The nucleotide position is within the coding region, but these sites are in the small noncoding spacers between genes.
pare our network, fig. 1 of the present article, with their fig. 2 and table 2). Nucleotide changes relative to the rCRS that are common to all mtDNA sequences of the three African haplogroups (with the exception of one L3 haplotype, i.e., sample 309) are A8701G, T9540C, A10398G, T10873C, and C12705T. This network dis-plays a large number of haplogroup-specific and hap-logroup-associated polymorphisms relative to the rCRS. The L1- and L2-haplotype sequences are more distant,
in terms of the number of mutational steps (the equiv-alent to “branch length” in phylogenetic trees), from the rCRS than are the L3-haplotype sequences, thus sup-porting the view that haplogroup L3 is the most recent common ancestor of the Asian and European haplo-groups (Ingman et al. 2000). However, there are rela-tively few polymorphisms shared between the African mtDNA sequences and those of Asians and Europeans, so phylogenetic support for this proposition is weak.
Herrnstadt et al.: Network Analysis of mtDNA Haplogroups 1161
Figure 2 Phylogenetic network of 69 Asian mtDNA sequences based on coding-region variations relative to the rCRS. True Asian sequences are indicated by blue nodes or blue numbers inside white nodes. Weights of all nucleotide positions, including site 10398, were equal, except that a TrC substitution at nucleotide position 961 creates an unstable poly C tract. Numbers in nodes indicate mtDNA sequences. Red, black, and underlined nucleotides are as defined in the legend for figure 1. Broken lines indicate the presence of reticulations, and unbroken lines show the most likely route of evolution. The outgroup is an mtDNA sequence of African ancestry that belongs to haplogroup L3e (sample 216 from the African network).
African L3 haplotypes are characterized by the ab-sence of L1/L2-specific polymorphisms at nucleotide po-sitions 769, 1018, 3594, 4104, 7256, 7521, and 13650. Three of these sequence changes are reported here for the first time, whereas another three are listed on the Mitomap Web site but have not been associated with the L1/L2 haplogroups. The L1/L2-specific polymor-phism at nucleotide position 3594 has been described elsewhere (Chen et al. 1995; Wallace et al. 1999). There is no single polymorphism that is specific to all L3 hap-lotypes, although the G15301A polymorphism occurs in all L2- and L3-haplotype mtDNA sequences (and in one L1-haplotype sequence), in which it caused a retic-ulation that was resolved by assuming that it arose in-dependently on three separate occasions (fig. 1). The L3b and L3d subclusters are characterized by specific nucle-otide changes (fig. 1), and the A10819G and T14212C
polymorphisms distinguish the L3e subcluster from hap-logroups L1 and L2, although these polymorphisms were also found in a few “singleton” European mtDNA se-quences (table 2). Sequence 104 is that of HeLa mtDNA and is described in further detail elsewhere (Herrnstadt et al., in press).
In addition to the L1-specific T10810C polymorphism that has previously been reported (Wallace et al. 1999), the T825A, G2758A, T2885C, T7146C, C8468T, C8655T, G10688A, and C13506T polymorphisms were found only in haplogroup L1 mtDNA sequences in our sequence set. The T2416C, G8206A, A9221G, T10115C, and T11944C polymorphisms were present exclusively in haplogroup L2 mtDNA sequences. There are two distinct subclusters within the L2 haplogroup that are characterized by multiple specific nucleotide substitutions and that have been designated “L2a” and
1162 Am. J. Hum. Genet. 70:1152–1171, 2002
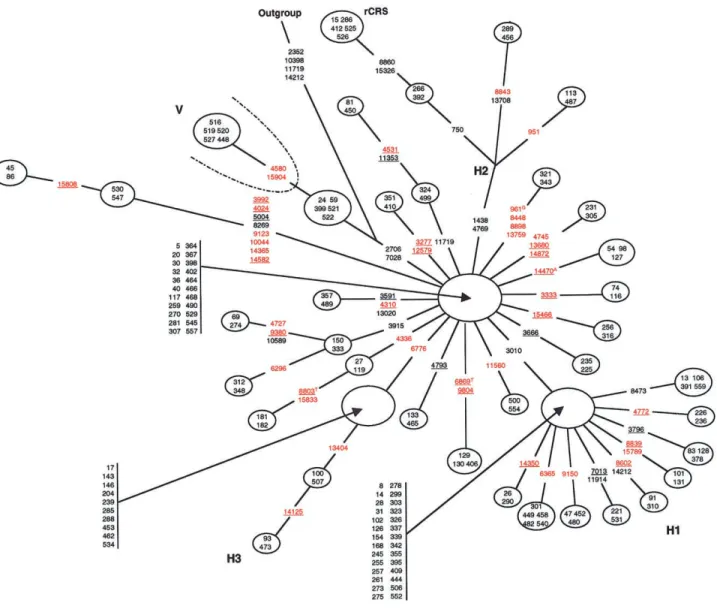
Figure 3 Skeleton network of H/V mtDNA sequences. A set of 226 mtDNA sequences that belong to haplogroup H and 8 sequences of haplogroup V were used to build a skeleton phylogenetic network. Sequences that are included in the skeleton network were limited to haplotypes that appeared at least twice within the data set, with the provision that the use of the term “haplotypes” in the present article is limited to haplogroup-associated polymorphisms in the coding region. A total of 40 different haplotypes (nodes) were obtained. Weights of all nucleotide positions were equal. Red, black, and underlined nucleotides are as defined in the legend for figure 1. The outgroup is an mtDNA sequence of African ancestry that belongs to haplogroup L3e (sample 216 from the African network).
“L2b” (fig. 1; see also Torroni et al. 2001b). Note that mtDNA sequences 222 and 385 have additional se-quence changes, and these sese-quences may constitute a more “ancient” branch of subgroup L2a. Nucleotide polymorphisms T7389C, T13789C, and G14560A are specific to the L1b and L1c subclusters, whereas L1a is characterized by a large set of specific nucleotide changes, possibly indicating the ancestral status of L1a among all of the haplogroup L subclusters. We obtained further support for this suggestion when phylogenetic relationships among the L haplotypes were ascertained by MP analysis with PHYLIP, version 3.5c (Felsenstein 1993). A total of 1,000 MP trees were saved and were used to generate a bootstrap consensus tree with the
chimpanzee mtDNA coding-region sequence as the out-group. The resultant MP tree (see the inset to fig. 1) placed haplogroup L1a closest to the outgroup on a branch independent of all other haplogroup L mtDNA sequences (the bootstrap retention value was 100%).
Polymorphisms that are common to haplogroups L1 and L2 both, in addition to C3594T (Wallace et al. 1999), are G769A, G1018A, C3594T, A4104G, C7256T, T7521C, and C13650T. The A13105G poly-morphism occurs in haplogroup L1, L3b, and L3d mtDNA sequences, as well as in one L3e sample. In a similar fashion, the T2352C polymorphism oc-curred in L1b and L3e mtDNA sequences. These shared polymorphisms did not induce reticulations in
Figure 4 Phylogenetic network of 259 European mtDNA sequences based on coding-region variations relative to the rCRS. All members of haplogroups I–K and T–X are displayed plus 50 randomly selected sequences of haplogroup H. Weights of all nucleotide positions, including site 10398, were equal. Numbers in nodes indicate samples. Red, black, and underlined nucleotides are as defined in the legend for figure 1. The outgroup is an mtDNA sequence of African ancestry that belongs to haplogroup L3e (sample 216 from the African network).
1164 Am. J. Hum. Genet. 70:1152–1171, 2002 the network, because the network program uses
hap-lotype frequencies to help resolve reticulations caused by homoplasy. However, an A15301G nucleotide sub-stitution was found both in the haplogroup L2 and L3 mtDNA sequences and in a single L1c haplotype, thereby causing a reticulation within the network. This reticulation was resolved by assuming indepen-dent origins in the L2 ancestor, the L3 ancestor, and the single L1 haplotype. The confidence in this reso-lution was bolstered by the observation that this site has undergone mutation at other times during evo-lution (see table 2). Polymorphisms at positions G709A, G3010A, T6221C, G11914A, C12705T, G14905A, and G15043A were found in European and African haplogroups both (table 2). These results suggest either parallel mutations at these sites or very old mtDNA alleles that arose in African mtDNA se-quences and which subsequently evolved from a com-mon ancestor to “newer” European mtDNA sequences (especially C12705T) in which they underwent “rever-sion” on multiple occasions.
The Asian mtDNA Network
The 17 Asian and 52 Native American mtDNA hap-lotypes are clustered within Asian haplogroups A–E (fig. 2). Native American mtDNA sequences were dis-tinguished from those of true Asian ancestry via the D-loop polymorphisms C16111T and T16325C (not shown) in the A and B haplotypes and the C and D haplotypes, respectively (Alves-Silva et al. 2000). The Native American sequences do not form subclusters separate from the true Asian sequences, because no dis-tinguishing sequence changes were found within the mtDNA coding regions. For example, the central node of haplogroup B and a small node of haplogroup A contain both Asian and Native American sequences.
Superhaplogroup M is defined by the polymor-phisms C10400T (Torroni et al. 1993), T14783C, and G15043A and contains haplogroups C–E (Torroni et al. 1992, 1994b). All Asian mtDNA sequences that belong to superhaplogroup M carry the substitutions A8701G, T9540C, A10398G, T10873C, C12705T (also present in all of haplogroup A), and G15301A (table 1). The sequence of mtDNA sequence 536, one of the two mtDNA sequences that could not be as-signed unambiguously to a major haplogroup, is un-usual in that it carries the C10400T, T14783C, and G15043A polymorphisms, which are specific for M haplotypes. However, this mtDNA doesnotcarry any of the C–E or G haplogroup-specific polymorphisms (the haplogroup G-specific markers are HaeIII and HpaI sites at nucleotide positions 4830 and 4831, respectively; see Wallace et al. 1999). As a result of this lack of haplogroup-specific polymorphisms, this
mtDNA sequence locates closely to the outgroup se-quence, and it is possible that mtDNA sequence 536 may descend from an ancient ancestor to superhap-logroup M. Alternatively, this mtDNA may be a mem-ber of an Asian subcluster other than C–E or G. The availability of additional Asian mtDNA sequences (e.g., see Maca-Meyer et al. 2001) may help resolve this issue.
Haplogroup E was represented here by mtDNA se-quences 169, 214, and 287, which form an unresolved reticulation that involves nucleotide positions 3705 and 4491 (binary characters for the three samples are 01, 11, and 10, respectively, for G3705A and G4491A). This haplogroup assignment, which is tenuous, was made because mtDNA sequence 214 carries the hap-logroup E–specific polymorphism at nucleotide posi-tion 7598 (table 1) and because these three sequences clearly cluster together. Furthermore, the sequence of mtDNA sequence 214 strongly resembles six E-hap-lotype mtDNA sequences that were collected in Guam. The Guamanian mtDNA sequences were not included in the present analyses, but we have observed that they carry the T3027C, G7598A, C13626T, and T14577C polymorphisms, which are also present in mtDNA se-quence 214. Our sese-quence data thus suggest that the polymorphism at nucleotide position 7598 may not be present in all E haplotypes (although it is haplogroup specific). Additional analysis of complete Asian mtDNA sequences should clarify the phylogenetic relationships. All haplogroup A mtDNA sequences and haplogroup B mtDNA sequences (except mtDNA sequence 178) are characterized by both the loss of the G15301A substi-tution and the presence of the A663G, A1736G, T4248C, A4824G, G8027A, and C8794T polymor-phisms. One reticulation in haplogroup A was resolved by the occurrence of parallel mutations at nucleotide position 12007 (which are indicated by the unbroken lines at this network region of fig. 2). An additional reticulation was resolved by down-weighting C inser-tions after nucleotide position 966 in mtDNA sequences 332 and 376. A TrC transition at nucleotide position 961 gives rise to an unstable poly C tract that is prone to expansion by one or two C residues (the TrC tran-sition at nucleotide potran-sition 16189 of the control region has the same effect). Haplogroup B forms two main clusters designated “B1” and “B2,” each characterized by specific sets of polymorphisms (fig. 2). The G15301A polymorphism, which is present in superhaplogroup M, was also found in a single B haplotype (i.e., mtDNA sequence 178), thereby causing a reticulation that was resolved (fig. 2; unbroken lines) by the assumption that the 15301 ArG mutation occurred in both the main B cluster and haplogroup A. Note, however, that resolu-tion of these reticularesolu-tions requires assumpresolu-tions that are not entirely satisfactory. For example, it must be
as-Herrnstadt et al.: Network Analysis of mtDNA Haplogroups 1165 sumed that the 12007 polymorphism has arisen three
times among sequences that radiate from one node of the haplogroup A network (fig. 2). This site is clearly homoplasic, and other occurrences of this mutation can be found in our networks (see table 2), but the apparent occurrence of a mutation three times in such a short evolutionary time span is highly improbable under the simple models of evolution that are used for phylogenetic analysis.
mtDNA sequence 178 was identified as a B haplotype on the basis of the presence of both the 9-bp deletion between COII and tRNALys(Torroni et al. 1992; Wallace and Torroni 1992) and substitutions at A16182C and T16217C, in the D-loop (data not shown). However, this mtDNA does not carry the polymorphisms at nu-cleotide positions A827G, G4820A, G13590A, and C15535T that are associated with all other B haplotypes. Thus, mtDNA sequence 178 may descend from an an-cient pre-B-haplotype mtDNA and thus may represent another example of an extant ancestral sequence. The Superhaplogroup H/V Network
A total of 234 mtDNA sequences from haplogroups H and V were analyzed for this study. However, the resultant network was essentially uninterpretable, be-cause of the large number of sequences. Therefore, a skeleton network for haplogroups H and V was con-structed to display these mtDNA sequences in a more concise and yet meaningful format. Coding-region se-quences were analyzed that were represented at least twice within the data sets for haplogroups H or V (ex-cluding private polymorphisms). A total of 152 se-quences (147 of 226 H haplotypes and 5 of 8 V hap-lotypes) met this criterion, and these yielded 40 different mtDNA H/V haplotypes. Complete sets of haplogroup-specific markers are shown in figure 3, and most of the homoplasies within the H/V cluster are omitted during construction of the skeleton network (data not shown). In the complete H/V network, there were a number of homoplasies that resulted in simple reticulations. This result is expected when a large number of sequences emanate from a node (Bandelt et al. 1995).
The skeleton network reveals that the haplogroup H mtDNA sequences form four subclusters, the two largest of which are starlike. The occurrence of the main H1 and H2 subclusters, which are defined by polymor-phisms 3010A and G1438A plus G4769A, respectively, confirm and extend a previous analysis (Finnila¨ et al. 2001). The main branch of the H2 subcluster contains the mtDNA sequences that are closest to the original CRS, as defined by the rare 750A, 8860A, and 15326A polymorphic alleles. In addition, two new subclusters are described here that are designated “H3” and “H4.” The H3 subcluster contains a rather large number (14)
of sequences and is defined by the T6776C polymor-phism. The small H4 cluster, on the other hand, is in-teresting because it is characterized by eight polymor-phisms, half of which (C3992T, A4024G, T5004C, and A14582G) have not been previously described. The G8269A H4-subcluster polymorphism was previously found in haplogroup J sequences only (Finnila¨ et al. 2001), and the G9123A and C14365T H4-subcluster polymorphisms have been reported (see the Mitomap Web site) but have not been associated with any partic-ular haplogroup. The markedly longer branch length of the H4 subcluster suggests a relatively old origin for this branch of the H/V haplogroup (see also the analyses of Richards et al. 2000), whereas the starlike nature of the H1 and H2 subclusters suggests that the populations that carry these mtDNA sequences have undergone recent expansions.
We identified 12 haplogroup H mtDNA sequences, on the basis of both CRS allele status at nucleotide positions 11719 and 14766 and the lack of polymorphisms spe-cific for non-H haplogroups, that did notcarry either the 2706A or the 7028C CRS alleles, although these alleles do occur in the vast majority of haplogroup H mtDNA sequences (e.g., see fig. 1 of Finnila¨ et al. 2001). These 12 sequences can be assigned unambiguously to the network branch that leads to the V cluster, 5 of which are shown in the skeleton network in figure 3 (the other 7 sequences each have a unique array of coding-region haplogroup-associated polymorphisms and hence are not included in the skeleton network). Sequence data for the control region (not shown) show that 3 of these 12 sequences carry the V-associated 72C and 16298C (all 12 are 16256C) alleles and thus are “pre*V sequences,” in the terminology of Torroni et al. (2001a); the other 9 mtDNA sequences carry the H-associated 72T and 16298T alleles, and these mtDNA sequences appear to constitute an even earlier node on the branch that sep-arates H and V sequences. The G11719A polymorphism is also a marker for the H/V cluster (Saillard et al. 2000; Finnila¨ et al. 2001), but we find the 11719G allele (that is, the non-H allele) in six haplogroup H sequences (table 2). In the skeleton network in figure 3, four of these sequences (mtDNA sequences 81, 324, 450, and 499) form a branch of the H2 subcluster, and the network thus indicates a homoplasic reversion of the 11719A allele to 11719G.
The European mtDNA Network
The reduced median network of 259 European mtDNA haplotypes (fig. 4) included all sequences of haplogroups I (np14), J (np33), K (np47), T (np46), U (np42), V (np8), W (np8), and X (np11), as well as 50 H haplotypes that were ran-domly selected from a total of 226. For this network,
1166 Am. J. Hum. Genet. 70:1152–1171, 2002 we used an African L3e outgroup sequence that is
nearly identical to the outgroup sequence that was used for network analysis of the Finnish mtDNA se-quences (Finnila¨ et al. 2001; see legend for fig. 1). Therefore, close comparison of these two European mtDNA-sequence sets was possible.
As described elsewhere (Finnila¨ et al. 2001), haplo-groups I, W, and X form a cluster defined by the hap-logroup-associated polymorphism C12705T, which is also found in African and Asian mtDNA sequences (ta-ble 2). Haplogroup X is characterized by the haplo-group-specific polymorphism C6371T and three hap-logroup-associated nucleotide polymorphisms T6221C, A13966G, and T14470C. The T6221C and A13966G polymorphisms also occur, albeit rarely, in other mtDNA sequences (table 2), which once again emphasizes the complexities that result from the high frequency of ho-moplasy in the human mitochondrial genome. Addi-tional sequence changes divide the main branch into two subclusters that are designated “X1” and “X2” (fig. 4). A reticulation among sequences from haplogroups I, W, and X involves the two sequence changes: one, at nu-cleotide position 1719, was present in all I haplotypes and all X haplotypes, and another, at nucleotide present 8251, was found in all but one I haplotype and all W haplotypes. Thus, our findings are in agreement with those from the Finnish data set (Finnila¨ et al. 2001). Polymorphisms at nucleotide positions 11065 and 14766 were also in conflict, and the resultant reticulation could not be resolved. Haplogroup I forms two major subclusters that are here designated “I1”—defined by the haplogroup-specific A3447G, G6734A, and G8616T polymorphisms—and “I2”—defined by the A15758G polymorphism. There may be a third subcluster on the basis of the occurrence of a small branch that carries the rare 1438A polymorphic allele. Finally, mtDNA se-quence 336 lacks a number of polymorphisms that are found in all other I haplotypes, including the A10398G polymorphism, and this mtDNA may be another extant ancestral sequence. A reticulation that involves nucleo-tide substitution A15924G was resolved to indicate a forward mutation at the I1/I2 ancestral node and then a back mutation in mtDNA sequence 505 (fig. 4).
Haplogroup W is defined by the haplogroup-specific polymorphisms T1243C, A3505G, G8994A, C11674T, A11947G, and G15884A, which is in agreement with the findings from the Finnish data set (Finnila¨ et al. 2001). All haplogroup W sequences in both sets carry these “core” polymorphisms. However, there were no W1 and W2 sequences (Finnila¨ et al. 2001) in our col-lection, and it appears that their sequences may represent subclusters that are largely limited to Finns. We did iden-tify a new subcluster, designated “W3,” that is charac-terized by the polymorphisms T1406C, A13263G, and T15784C. An additional small branch of haplogroup W
carries the C6528T, A10097G, and A15775G poly-morphisms, none of which were found in the rather large set of Finnish haplogroup W mtDNA sequences.
Superhaplogroup U/K comprises 20% of all of the European mtDNA sequences. Haplogroup K lies within haplogroup U, as shown elsewhere (Richards et al. 1998; Finnila¨ et al. 2001), and it is separated from the U5 cluster by the A1811G polymorphism, along with U2, U4, and the new U9 cluster that is defined by the A2294G, T4703C, A10506G, A14139G, and T15454C polymorphisms. The K cluster is divided into two sub-clusters, designated “K1” and “K2,” by the haplogroup-specific polymorphisms T1189C (Finnila¨ et al. 2001) and T9716C, respectively. The K2 subcluster does not carry the 10398G polymorphic allele (Torroni et al. 1994a). In our network, haplogroup U mtDNA se-quences 84 and 229 form a subcluster that is defined by polymorphisms at nucleotide positions 3348, 7805, and 14179. This subcluster has been designated “U6,” be-cause of the presence of the polymorphisms at nucleotide positions 7805 and 14179 in the single U6 sequence reported by Maca-Meyer et al. (2001; see their fig. 1).
The network structures of superhaplogroups J/T and H/V are in general agreement with the Finnish sequences, in regard to their specific and haplogroup-associated polymorphisms and the formation of the J1, J2, T1, T2, H1, and H2 subclusters (Finnila¨ et al. 2001). In addition, we identified a small subcluster, designated “J3,” that results in a reticulation, which was resolved by assuming a subcluster-specific homoplasy at nucle-otide position 10398. A novel subcluster of T2, here designated “T2a,” has been defined by the sequence changes T13965C and A14687G, and another subclus-ter of T2, defined by substitutions G930A and G5147A, has been designated “T2b.”
The structure of the European network is unam-biguous, even though we did not down-weight the A10398G polymorphism, whereas Finnila¨ et al. (2001) did down-weight sequence changes at this site. The A10398G polymorphism is noteworthy because of its presence in some European haplogroups that do not appear either to be closely related or to have origi-nated from the same human migrations. Thus, our network analysis indicates the presence of the 10398G (non-rCRS) allele in haplogroups J (except for the J3 subcluster) and I (except for the presumably ancestral I haplotype of mtDNA sequence 336), as well as the haplogroup K1 subcluster. The rCRS 10398A allele is in mtDNA sequences from haplogroups T, W, and X and the mtDNA sequences from the K2 subcluster. These results are most easily explained by the presence of multiple mutations (i.e., homoplasy) at this site. Although the reasons of Finnila¨ et al. (2001) for down-weighting the 10398 polymorphism were not explicit, it must have been done because of the
poly-Herrnstadt et al.: Network Analysis of mtDNA Haplogroups 1167
Table 3
LD Analysis of mtDNA Coding-Region Sequences
Africana Asian European Haplogroup H
No. of sequences 56 69 435 226
No. of polymorphic sites 418 293 906 413
No. of usable sitesb 143 (34%) 25 (10%) 15 (2%) 9 (2%)
/Pairwise comparisonsc 2 r 8,911 210 105 36 /Correlation coefficientd 2 r ⫺.001ns ⫺.181* .085ns .103ns d/Pairwise comparisionse 7,213 153 105 36 d/Correlation coefficientd ⫺.001ns ⫺.147* ⫺.002ns .112ns a“African” refers to all L-haplogroup mtDNA sequences; “Asian” refers to both Asian
and Native American mtDNA sequences.
b Usable sites are those in which the minority allele is present in⭓5% of the total
sequences. We also include the percentage of all sites in the set that were usable.
c This is the number ofr2values that did not have div/0 errors (i.e., those due to division
by 0).
d For both ther2anddmeasures of LD, the correlation coefficient with distance between
sites was determined (see detailed discussion in Elson et al. 2001). An asterisk (*) indicates that the value was significantly less than 0 by use of a one-tailed randomization test (Elson et al. 2001). Superscript letters that follow values indicate that the correlation coefficient was not significantly different from 0.
e The numbers in this row are the number ofpositivedvalues. morphism’s high frequency of homoplasy. Although
we would support a high frequency of homoplasy at this site, we have observed many other sites in the coding region that are also homoplasic (table 2). Therefore, we have chosen, in the present analysis, to avoid the down-weighting of any sites, although this is clearly an issue that should be explored in subse-quent investigations.
A number of haplogroup markers do not agree be-tween the data set that we studied and those of the Finnish network (Finnila¨ et al. 2001). For example, nu-cleotide substitutions G5773A, G9545A, T11899C, and G12630A were associated with Finnish haplogroups K, K, H, and U5a1, respectively. However, the data set that we studied defines these sites as markers only for hap-logroups L3, C, L1, and L2 (figs. 1 and 2), respectively, and they were not found in the European haplotypes that we report (table 2). In the absence of more-attractive scenarios, we suggest that these disparities represent homoplasic events that were differentially detected in the two sequence sets.
LD Analysis of mtDNA Recombination
We recently analyzed a set of 64 European mtDNA sequences by the LD test and obtained no evidence for intermolecular recombination (Elson et al. 2001). With the availability of additional mtDNA sequences, we have reexamined this question by use of the LD test. We an-alyzed four mtDNA coding sequence sets: African, Asian, all European, and only haplogroup H. Both the and dmeasures of LD were used, because the latter 2
r
is less sensitive to the confounding effects of allele fre-quencies (see also the discussion in Elson et al. 2001).
In all coding-region polymorphic sites used, the minority allele was present in ⭓5% of the sequences.
It has been proposed that intermolecular recombina-tion is the most likely explanarecombina-tion when there is a neg-ative correlation between LD and the distance between the site pairs analyzed (Awadalla et al. 1999; for further discussion, see Elson et al. 2001). The results of the LD tests are shown in table 3. There is no evidence for re-combination in the African mtDNA sequences, which have the largest number of usable sites for this type of analysis, because the correlation coefficient with both LD measures is 0. In other sequence sets, the results become more complex. There is a slight positive cor-relation for the European mtDNA sequences when the LD measure is used, but this value was not signifi-2
r
cantly different from a value of 0. Furthermore, the cor-relation drops to 0 when thedmeasure is used. If only haplogroup H sequences are used, then the correlation with both measures is positive, but neither value is sig-nificantly different from 0. Finally, the Asian mtDNA sequences yield a negative LD/distance correlation with both LD measures, and both values are significantly less than 0.
Discussion
The initial, low-resolution studies of human mtDNA sequences yielded starlike phylogenetic trees with a central, apparently “universal” haplotype. Higher-resolution studies, however, indicated a more complex pattern in which there were major ethnic-associated sequence sets or haplogroups (reviewed in Richards and Macaulay 2001). In our analysis of 560 complete
1168 Am. J. Hum. Genet. 70:1152–1171, 2002 mtDNA coding regions from unrelated individuals,
199% of the sequences could be assigned unambig-uously to a single mtDNA haplogroup. More impor-tantly, the reduced-median-network analyses substan-tially expand the catalogue of haplogroup-associated and haplogroup-specific polymorphisms.
One important result to emerge from these studies is the relatively large number of sites at which homoplasic events have occurred. Homoplasy complicates phylo-genetic analyses, but those effects will be reduced with the additional haplogroup-specific polymorphisms that have been revealed by the complete genome analyses reported here. In addition, 185% of the mtDNA
se-quences analyzed here also carry private polymorphisms (data not shown). Thus, whereas distinct sets of SNPs were associated with mtDNA haplogroups, all the com-plete mtDNA sequences were unique, and individuals were found to carry up to an additional 7 nonsynon-ymous and 12 synonnonsynon-ymous nucleotide substitutions in protein-coding genes, up to 4 nucleotide changes each in the ribosomal RNA and tRNA genes, and up to 8 changes in the noncoding control region. The analysis of these private polymorphisms will be the subject of subsequent reports.
The finding of extensive homoplasy within the coding region suggests that there is site variability in the rate of sequence evolution within the coding region. In ad-dition, we have observed that haplogroups often have subclusters that have longer average branch lengths rel-ative to the branch lengths of other subclusters within the haplogroup. The H4 subcluster (fig. 3) is the most striking example, but there are several others, including L1a/L1b and L2a/L2b. Several previous studies (e.g., see Richards et al. 1996; Macaulay et al. 1999; Chen et al. 2000) have derived the evolutionary ages of different mtDNA haplogroups by use of simple models of mu-tation and fixation. The results presented here indicate that further investigation of these key evolutionary pro-cesses is necessary and that advocacy of such haplo-group-dating schemes should be tempered with caution. In an important analysis, Torroni et al. (2001b) have obtained evidence that there is not an mtDNA “clock” (i.e., a constant, single rate of DNA evolution) and have provided preliminary evidence that different subclusters within the same haplogroup have evolved at different rates. Those results will undoubtedly catalyze further investigations.
We also analyzed sequences with the LD test to as-certain if there was evidence for mtDNA recombination (we use “recombination” as a general term; see the com-ments in Eyre-Walker and Awadalla 2001), by use of larger sequence sets. There was a significant decline in LD with separation of sites for the Asian mtDNA se-quences, which could indicate recombination. However, there was no correlation for the other three sequence
sets that were analyzed (table 3). Worobey (2001) has shown that recombination tends to make phylogenetic trees more starlike, and it is not surprising, therefore, that the African sequences—which are the least starlike—show no evidence of intermolecular recom-bination. We chose to analyze the haplogroup H mtDNA sequences separately because they had the net-works that are the most starlike, and it was thus possible that recombination had occurred. However, that anal-ysis showed no correlation between LD and distance (i.e., the positive values were not statistically signifi-cant). On the basis of these results, we are still unable to find consistent and compelling evidence, with the LD test, for intermolecular recombination among human mtDNA sequences (a conclusion similar to that in Eyre-Walker and Awadalla 2001). The results obtained with the Asian sequences are not persuasive, because LD is influenced by many factors other than recombination (see the discussion in Elson et al. 2001). Considerable attention is being paid to the effects that hypervariable sites and site independence have on LD (e.g., see Meu-nier and Eyre-Walker 2001; Wiuf 2001). In regard to this latter point, we again emphasize the high rate of homoplasy within the mtDNA coding region (table 2). The present results should facilitate the investigation of the roles that mtDNA-sequence changes play in path-ological disorders. A number of studies have failed to make the important distinction between frank patho-genic mtDNA mutations and haplogroup-associated polymorphisms (e.g., see Lin et al. 1992; Hutchin and Cortopassi 1995; Chagnon et al. 1999). For example, Chagnon et al. (1999) concluded that polymorphisms at nucleotide positions 5633, 7476, and 15812 may be risk factors for AD, whereas polymorphisms at nucle-otide positions 709 and 15928 may protect against AD. However, these polymorphisms indicate a haplogroup J subcluster and haplogroup T, respectively, and other sequence changes (singly or in combination) in these phylogenetic groups could be involved. The statistical association between a clinical disorder and an mtDNA phylogenetic cluster can have more than one explana-tion, particularly when such correlations are weak. One possible explanation is that the correlation may reflect complex phenotypic interactions between mitochon-drial and nuclear genes. There is a clear association or correlation between the mitochondrial Leber hereditary optic neuropathy (LHON) mutation at nucleotide po-sition 14484 and haplogroup J, which has been inter-preted as an influence that one or more mtDNA poly-morphisms have on penetrance (Brown et al. 1997; Torroni et al. 1997). LHON penetrance appears to be modified both by nuclear-mitochondrial and mitochon-drial-mitochondrial interactions, and an effect that se-quence changes other than the LHON mutation has on such a complex pathogenesis is plausible. There have
Herrnstadt et al.: Network Analysis of mtDNA Haplogroups 1169
now been several reports that suggest a preferential as-sociation between a clinical disorder and an mtDNA haplogroup (e.g., see Chinnery et al. 2000; Ruiz-Pesini et al. 2000), but the bases for these associations have not been elucidated. In addition, an mtDNA-haplo-group association has been reported for longevity (De Benedictis et al. 1999). The possibility that combina-tions of alleles influence or determine clinical pheno-types has also been observed for SNPs in the nuclear
genome (Drysdale et al. 2000; Hoehe et al. 2000). It appears that there may be a spectrum of mtDNA mutations that ranges from benign to pathogenic, rather than a simple binary distribution, and that nuclear-mi-tochondrial interactions may play an important role in disease etiology. Therefore, in a number of diseases with a suspected mitochondrial genetic component in the eti-ology, it will be necessary to use mitochondrial popu-lation-genetics approaches. Determining the pathogenic role of the mitochondrial genome will require more ex-tensive surveys of the mtDNA sequences in different populations and patient groups, but the rapidly increas-ing collection of sequences provides a necessary point of departure.
Acknowledgments
We thank Drs. Leon Thal, Haydeh Payami, Leslie Shinobu, Robert Ferrante, W. Davis Parker Jr., and Cliff Shults for pro-viding blood and brain samples, Ms. Sandra Gore (MitoKor) for technical assistance, and Mr. Brian Hulihan (MitoKor) for assistance with the MitoKor Web site. N.H. acknowledges research support by the National Science Foundation (grant BSC-9910871).
Electronic-Database Information
URLs for data in this article are as follows:Fluxus Engineering, http://fluxus-engineering.com/ (for Net-work 3.1 program)
MitoKor, http://www.mitokor.com/science/560mtdnas.php (for the 560 mtDNA coding-region sequences)
Mitomap, http://infinity.gen.emory.edu/mitomap.html Sequence Analysis Server, http://genome.cs.mtu.edu/ (for the
contig assembly program [CAP])
References
Alves-Silva J, Santos MS, Guimaraes PEM, Ferreira ACS, Ban-delt H-J, Pena SDJ, Prado VF (2000) The ancestry of Bra-zilian mtDNA lineages. Am J Hum Genet 67:444–461 Anderson S, Bankier AT, Barrell G, de Bruijn MHL, Coulson
AR, Drouin J, Eperon IC, Nierlich DP, Roe BA, Sanger F, Schreier PH, Smith AJH, Staden R, Young IG (1981)
Se-quence and organization of the human mitochondrial ge-nome. Nature 290:457–465
Andrews RM, Kubacka I, Chinnery PF, Lightowlers RN, Turnbull DM, Howell N (1999) Reanalysis and revision of the Cambridge reference sequence for human mito-chondrial DNA. Nat Genet 23:147
Awadalla P, Eyre-Walker A, Maynard Smith J (1999) Linkage disequilibrium and recombination in hominid mitochondrial DNA. Science 286:2524–2525
Bandelt H-J, Forster P, Sykes BC, Richards MB (1995) Mi-tochondrial portraits of human populations using median networks. Genetics 141:743–753
Brown MD, Sun F, Wallace DC (1997) Clustering of Caucasian Leber hereditary optic neuropathy patients containing the 11778 or 14484 mutations on an mtDNA lineage. Am J Hum Genet 60:381–387
Chagnon P, Gee M, Filion M, Robitaille Y, Belouchi M, Gau-vreau D (1999) Phylogenetic analysis of the mitochondrial genome indicates significant differences between patients with Alzheimer disease and controls in a French-Canadian founder population. Am J Med Genet 85:20–30
Chen Y-S, Olckers A, Schurr TG, Kogelnik AM, Huoponen K, Wallace DC (2000) mtDNA variation in the South Af-rican Kung and Khwe—and their genetic relationships to other African populations. Am J Hum Genet 66:1362–1383 Chen Y-S, Torroni A, Excoffier L, Santachiara-Benerecetti AS, Wallace DC (1995) Analysis of mtDNA variation in African populations reveals the most ancient of all human continent-specific haplogroups. Am J Hum Genet 57:133–149 Chinnery PF, Taylor GA, Howell N, Andrews RM, Morris
CM, Taylor, RW, McKeith IG, Perry RH, Edwardson JA, Turnbull DM (2000) Mitochondrial DNA haplogroups and susceptibility to AD and dementia with Lewy bodies. Neu-rology 55:302–304
De Benedictis G, Rose G, Carrieri G, De Luca M, Falcone E, Passarino G, Bonafe M, Monti D, Baggio G, Bertolini S, Mari D, Mattace R, Franceschi C (1999) Mitochondrial DNA inherited variants are associated with successful aging and longevity in humans. FASEB J 13:1532–1536
Drysdale CM, McGraw DW, Stack CB, Stephens JC, Judson RS, Nandabalan K, Arnold K, Ruano G, Liggett SB (2000) Complex promoter and coding regionb2-adrenergic receptor
haplotypes alter receptor expression and predictin vivo re-sponsiveness. Proc Natl Acad Sci USA 97:10483–10488 Elson JL, Andrews RM, Chinnery PF, Lightowlers RN,
Turn-bull DM, Howell N (2001) Analysis of European mtDNAs for recombination. Am J Hum Genet 68:145–153
EyWalker A, Awadalla P (2001) Does human mtDNA re-combine? J Mol Evol 53:430–435
Felsenstein J (1993) PHYLIP: phylogeny inference package, version 3.5c. Department of Genetics, University of Wash-ington, Seattle
Finnila¨ A, Lehtonen MS, Majamaa K (2001) Phylogenetic net-work for European mtDNA. Am J Hum Genet 68:1475– 1474
Hedges SB (2000) A start for population genomics. Nature 408:652–653
Herrnstadt C, Preston G, Andrews R, Chinnery P, Lightowlers RN, Turnbull DM, Kubacka I, Howell N. A high frequency
1170 Am. J. Hum. Genet. 70:1152–1171, 2002
of mtDNA polymorphisms in HeLa cell sublines. Mutat Res (in press)
Hoehe MR, Ko¨pke K, Wendel B, Rohde K, Flachmeier C, Kidd KK, Berrettini WH, Church GM (2000) Sequence variability and candidate gene analysis in complex disease: association ofm opioid receptor gene variation with substance depen-dence. Hum Mol Genet 9:2895–2908
Howell N (1999) Human mitochondrial diseases: answering questions and questioning answers. Int Rev Cytol 186:49– 116
Howell N, Kubacka I, Mackay DA (1996) How rapidly does the human mitochondrial genome evolve? Am J Hum Genet 59:501–509
Hutchin T, Cortopassi G (1995) A mitochondrial DNA clone is associated with increased risk for Alzheimer disease. Proc Natl Acad Sci USA 92:6892–6895
Ingman M, Kaessmann H, Pa¨a¨bo S, Gyllensten U (2000) Mi-tochondrial genome variation and the origin of modern hu-mans. Nature 408:708–713
Lin FH, Lin R, Wisniewski HM, Hwang YW, Grundke-Iqbal I, Healy-Louie G, Iqbal K (1992) Detection of point mu-tations in codon 331 of mitochondrial NADH dehydroge-nase subunit 2 in Alzheimer’s brain. Biochem Biophys Res Commun 182:238–246
Maca-Meyer N, Gonza´lez AM, Larruga JM, Flores C, Cabrera VM (2001) Major genomic mitochondrial lineages delineate early human expansions. BMC Genet 2:13
Macaulay V, Richards M, Hickey E, Vega E, Cruciani F, Guida V, Scozzari R, Bonne-Tamir B, Sykes B, Torroni A (1999) The emerging tree of west Eurasian mtDNAs: a synthesis of control-region sequences and RFLP. Am J Hum Genet 64: 232–249
Mecocci P, MacGarvey U, Beal MF (1994) Oxidative damage to mitochondrial DNA is increased in Alzheimer’s disease. Ann Neurol 36:747–751
Meinila¨ M, Finnila¨ S, Majamaa K (2001) Evidence for mtDNA admixture between the Finns and the Saami. Hum Hered 52:160–170
Meunier J, Eyre-Walker A (2001) The correlation between linkage disequilibrium and distance: implications for recom-bination in hominid mitochondria. Mol Biol Evol 18: 2132–2135
Pearson WR (1990) Rapid and sensitive sequence comparison with FASTP and FASTA. Methods Enzymol 183:63–98 Posada D, Crandall KA (2001) Intraspecific gene genealogies:
trees grafting into networks. Trends Ecol Evol 16:37–45 Quintana-Murci L, Semino O, Bandelt H-J, Passarino G,
McElreavey K, Santachiara-Benerecetti AS (1999) Genetic evidence of an early exit of Homo sapiens sapiens from Africa through eastern Africa. Nat Genet 23:437–441 Rando JC, Pinto F, Gonzalez AM, Hernandez M, Larruga JM,
Cabrera VM, Bandelt H-J (1998) Mitochondrial DNA anal-ysis of northwest African populations reveals genetic ex-changes with European, Near-Eastern, and sub-Saharan populations. Ann Hum Genet 62:531–550
Richards M, Corte-Real H, Forster P, Macaulay V, Wilkinson-Herbots H, Demaine A, Papiha S, Hedges R, Bandelt H-J, Sykes B (1996) Paleolithic and Neolithic lineages in the Eu-ropean mitochondrial gene pool. Am J Hum Genet 59: 185–203
Richards M, Macaulay V (2001) The mitochondrial gene tree comes of age. Am J Hum Genet 68:1315–1320
Richards MB, Macaulay VA, Bandelt H-J, Sykes BC (1998) Phylogeography of mitochondrial DNA in western Europe. Ann Hum Genet 62:241–260
Richards M, Macaulay V, Hickey E, Vega E, Sykes B, Guida V, Rengo C, et al (2000) Tracing European founder lineages in the Near Eastern mtDNA pool. Am J Hum Genet 67: 1251–1277
Ruiz-Pesini E, Papena AC, Diez-Sanchez C, Perez-Martos A, Montoya J, Alvarez E, Diaz M, Urries A, Montoro L, Lopez-Perez MJ, Enriquez JA (2000) Human mtDNA haplogroups associated with high or reduced spermatozoa motility. Am J Hum Genet 67:682–696
Saillard J, Magalhaes PJ, Schwartz M, Rosenberg T, Norby S (2000) Mitochondrial DNA variant 11719G is a marker for the mtDNA haplogroup cluster HV. Hum Biol 72:1065–1068 Thompson JD, Higgins DG, Gibson TJ (1994) CLUSTAL W: improving the sensitivity of progressive multiple sequence alignment through sequence weighting, position-specific gap penalties and weight matrix choice. Nucleic Acids Res 22: 4673–4680
Torroni A, Bandelt H-J, Macaulay V, Richards M, Cruciani F, Rengo C, Martinez-Cabrera V, et al (2001a) A signal, from human mtDNA, of postglacial recolonization in Europe. Am J Hum Genet 69:844–852
Torroni A, Huoponen K, Francalacci P, Petrozzi M, Morelli L, Scozzari R, Obinu D, Savontaus M-L, Wallace DC (1996) Classification of European mtDNAs from an analysis of three European populations. Genetics 144:1835–1850 Torroni A, Lott MT, Cabell MF, Chen Y-S, Lavergne L, Wallace
DC (1994a) mtDNA and the origin of Caucasians: identi-fication of ancient Caucasian-specific haplogroups, one of which is prone to a recurrent somatic duplication in the D-loop region. Am J Hum Genet 55:760–776
Torroni A, Miller JA, Moore LG, Zamudia S, Zhuang J, Droma T, Wallace DC (1994b) Mitochondrial DNA analysis in Tibet: implications for the origin of the Tibetan popu-lation and its adaptation to high altitude. Am J Phys An-thropol 93:189–199
Torroni A, Petrozzi M, D’Urbano L, Sellitto D, Zeviani M, Carrara F, Carducci C, Leuzzi V, Carelli V, Barboni P, De Negri A, Scozzari R (1997) Haplotype and phylogenetic analyses suggest that one European-specific mtDNA back-ground plays a role in the expression of Leber hereditary optic neuropathy by increasing the penetrance of the pri-mary mutations 11778 and 14484. Am J Hum Genet 60: 1107–1121
Torroni A, Rengo R, Guida V, Cruciani F, Sellitto D, Coppa A, Calderon FL, Simionati B, Valle G, Richards M, Macau-lay V, Scozzari R (2001b) Do the four clades of the mtDNA haplogroup L2 evolve at different rates? Am J Hum Genet 69:1348–1356
Torroni A, Schurr TG, Cabell MF, Brown MD, Neel JV, Larsen M, Smith DG, Vullo CM, Wallace DC (1993) Asian Affin-ities and continental radiation of the four founding Native American mtDNAs. Am J Hum Genet 53:563–590 Torroni A, Schurr TG, Yang C-C, Szathmary EJE, Williams
RC, Schanfield MS, Troup GA, Knowler WC, Lawrence DN, Weiss KM, Wallace DC (1992) Native American