T
HE
U
NIVERSITY OF
T
EXAS
S
CHOOL OF
L
AW
Law and Economics Research Paper No. 119
December 2, 2007
The
Incorporation Choices of Privately Held Corporations
Jens Dammann
The University of Texas
School of Law
Matthias Schündeln
Department of Economics
Harvard University
All of the papers in this series are available at
http://www.utexas.edu/law/academics/centers/clbe/papers.html
This paper can be downloaded without charge from the Social Science Research Network at
A
BSTRACTExploiting a large new database, this paper explores the incorporation choices of closely held U.S. corporations. The majority of corporations in our sample incorporate in the state in which their primary place of business (PPB) is located. However, among the corporations with more than 1000 employees, only about half incorporate in their PPB state, and of those that do not, more than half are incorporated in Delaware. We find statistically significant and robust evidence that corporations from states with low quality judiciaries are more likely to incorporate outside of their PPB state. Furthermore, corporations are more likely to migrate away from states where the risk of veil piercing is perceived to be high or that offer a particularly generous level of minority shareholder protection. The study complements empirical studies of incorporation choices of public companies, and offers new empirical evidence related to several theoretical debates concerning the market for corporate law.
I. INTRODUCTION
The internal affairs of U.S. corporations are governed by the law of the state of incorporation. Accordingly, corporations can choose the corporate law applicable to their internal affairs by incorporating in the state of their choice. Public corporations, at least, have made ample use of that freedom: More than half of them are incorporated in Delaware.1
Over the years, Delaware’s success in attracting corporate charters has prompted a huge amount of literature. Recent examples include Bebchuk and Hamdani (2002); Bebchuk, Cohen, and Ferrell (2002); Subramanian (2002); Roe (2003); and Roe (2005). In particular, scholars debate whether or not the freedom to choose the applicable corporate law benefits shareholders—a question that is said to be “[o]ne of the most important questions in U.S. corporate law” (Subramanian, 2002, p. 1797). The most prominent views on this issue are typically referred to as the the-bottom view and the race-to-the-top view. Under the former, managers tend to steer their corporations towards jurisdictions that favor managers at the expense of shareholders. States, eager to increase their revenues from franchise taxes, compete for corporate charters by offering rules that are good for managers rather than for shareholders (Cary, 1974). According to the race-to-the-top view, by contrast, capital market pressure ensures that corporations will migrate towards jurisdictions with law that is attractive to shareholders. It follows that states compete in a race for quality (Winter, 1977).
The more recent literature tends to take more moderate positions, but the basic question remains in dispute: Critics continue to maintain that state competition produces a body of law that inefficiently benefits managers at the expense of shareholders (Bebchuk and Ferrell, 1999; Bebchuk, Cohen, and Ferrell, 2002; Bebchuk, 2006). At the same time, the supporters of state competition uphold the view that, at least on balance, state competition appears to benefit shareholders (Romano, 1985; Romano, 1992; Romano 1993; Romano 1998; Romano, 2002; Sitkoff, 2002). Against the background of this ongoing disagreement, it is no surprise that various empirical studies seek to shed light on the incorporation choices of publicly traded firms (including IPO firms) (e.g. Bebchuk and Cohen, 2003; Daines, 2002; Ferris, Lawless, and Noronha, 2006; Kahan, 2006).
1 See DEL.DIV. OF CORPORATIONS,
Why Choose Delaware As Your Corporate Home?, Homepage, at
By contrast, very little is known about the incorporation choices of closely held U.S. firms.2 Some authors have claimed that most closely held firms incorporate locally
(e.g., Eisenberg, 2005; Kahan and Kamar, 2002; Bebchuk, 1992; Skeel, 1994; Stevenson, 2001) or, more cautiously, that incorporating locally is usually preferable for close corporations (Ayres, 1992; Kades, 2000). However, even setting aside the fact that it has never, to the best of our knowledge, been empirically verified, the statement that “most” closely held firms incorporate locally is only of limited use. After all, closely held firms come in different shapes and sizes. The vast majority of closely held corporations are fairly small. For example, according to estimates by the IRS, of the roughly 5.4 million active corporations (including S-corporations) that filed corporate income tax returns in 2003, around 4.5 million (or 83%) had total assets between $0 and $500,000.3 Yet these numbers should not distract from the fact that there is no lack of large closely held corporations either. To be sure, IRS statistics are of limited value in this respect because they do not distinguish between closely held firms and publicly traded ones. However, business databases prove instructive. The ICARUS database that we use in this study, and which we will introduce in more detail below, reveals about 2,170 privately held corporations with revenues of $500,000,000 or more, hardly a small figure if one takes into account that the same distinction can be claimed only by roughly 1,760 publicly traded corporations. The economic significance of closely held firms is further illustrated by the following comparison: The 5,300 public firms in the ICARUS database have a total sum of revenues of $9.5 trillion, while the total revenue of the 277,783 private corporations in our sample is $7.5 trillion. The relative economic significance of closely held firms is not particularly surprising. Many large corporations never go public in the first place. At the same time, going-private transactions are apparently becoming more common, driven in part by the increased regulatory burden on publicly traded firms (Engel, Hayes, and Wang, 2004).
2 We should note that there is some literature on this in the context of the European Union. There,
corporations are also free to choose their state of incorporation freely, thanks to the Centros and Überseering judgments of the European Court of Justice (Dammann, 2004). For firms incorporated in the UK, Marco Becht, Colin Mayer, and Hannes Wagner (2007) find “that post-Centros increases in legal migration rates [to the U.K.] are explained by country-specific incorporation costs and minimum capital requirements.” However, there are important differences between Europe and the United states which mean that corporate migration patterns in Europe cannot be compared to those in the United States (Becht, Mayer, and Wagner, 2007). One should also note that the huge discrepancies across jurisdictions that Becht, Mayer, and Wagner note with respect to formation costs for closely held firms in the European Community do not exist in the United States where minimum capital requirements have largely been abandoned and where the costs of incorporating a closely held firm tend to be minimal across jurisdictions.
3
See Internal Revenue Service, SOI Tax Stats - Corporation Data by Size, 2003 Corporation Returns -
Given the economic significance of closely held corporations, it is somewhat puzzling that their incorporation choices have not been explored empirically. After all, many of the questions that are being discussed with respect to the impact of the charter market on publicly traded firms can also be asked with respect to closely held corporations, albeit accounting for the different characteristics of closely held firms. For example, closely held corporations have, by definition, concentrated ownership, so that the agency problems between managers and owners tend to be far less pronounced than in publicly traded corporations. Hence, there is little risk that closely held firms will migrate towards jurisdictions that benefit managers at the expense of shareholders. However, closely held corporations often have a controlling shareholder. Consequently, there is the possibility that closely held firms migrate towards jurisdictions that favor controlling shareholders at the expense of minority shareholders.
We conjecture that the main reason for the lack of empirical studies on the incorporation choices of closely held firms is that closely held firms are not subject to disclosure requirements comparable to those in place for public corporations, which makes it more difficult to give an accurate assessment of their incorporation choices. But that hardly justifies the fact that scores of articles have been written on the charter market for publicly traded corporations, while closely held corporations have been almost entirely ignored.
The present article seeks to fill this gap. We exploit a large database that has become available only fairly recently, which allows us to overcome the previous lack of data.
Confirming conjectures that exist in the literature (see above), we find that the majority of corporations in our full sample are incorporated in the state where the firm’s principal place of business (PPB) is located. Indeed, the baseline empirical analysis below shows that in our sample, which covers corporations with 20 or more employees, about 93% are incorporated locally (= in their PPB state). Of the remaining 7% that are incorporated elsewhere, slightly more than half (53%) incorporate in Delaware.
The picture changes, however, once we focus only on larger privately held firms (≥1,000 employees). Only about half of them are incorporated in their PPB state, and of those that are incorporated elsewhere, about 80% are incorporated in Delaware. In other words, just as Delaware dominates the market for publicly traded firms, it also appears to be the state that is most successful at attracting closely held firms from other states.
This leads to the question of whether the success of a state in attracting corporations is determined at least in part by its legal system, namely the content of its corporate law and the quality of its courts. This is the question that is the main focus of
this paper. Much of the literature on public corporations assumes that firms choose their state of incorporation in part because of the content of that jurisdiction’s corporate law and the quality of its courts. In fact, empirical studies on public corporations tend to confirm that view both with respect to the relevance of substantive law (Bebchuk and Cohen, 2003; Kahan, 2006; Subramanian, 2002) and concerning the importance of courts (Kahan, 2006). By contrast, it is less clear whether the same is true for closely held firms. Consider, for example, the role played by substantive corporate law. Ayres, who has written what appears to be the most detailed assessment of how the so-called “charter market” affects closely held U.S. corporations, has argued that there really is no need for closely held corporations to incorporate in another state because state law typically is sufficiently flexible to allow corporations to create whichever structure they prefer (Ayres, 1992).
Our findings, however, are consistent with the hypothesis that both the quality of courts and the content of substantive corporate law matter to corporations. In our econometric analysis, we find that corporations from states with low quality judiciaries are more likely to incorporate outside of their home state. Furthermore, we find statistically significant and robust evidence that corporations are more likely to migrate away from states where the risk of veil piercing is high or that offer a particularly generous level of minority shareholder protection. Furthermore, the magnitudes of the estimated coefficients imply that these findings are not only statistically but also economically significant.
This paper proceeds as follows. Part II describes the data we are using. Part III empirically addresses the question of where closely held corporations incorporate. Parts IV and V discuss potential reasons for the incorporation choices of closely held corporations, namely the quality of state courts as well as various features of substantive corporate law. Part VI presents and analyzes the empirical results of our econometric analysis. Part VII summarizes.
II. DATA
We use a large company dataset that has not yet been exploited for empirical work of the present type. The company-level data is from Bureau van Dijk’s ICARUS database.4 This database covers US and Canadian firms of all sizes. Company profiles are
4 Available at http://www.bvdep.com/en/icarus.html. As explained before, most of the empirical
analysis of incorporation choices has focused on public firms, using Compustat data. The ICARUS (which is short for “Instant Company Analysis and Reports for the U.S.”) database on the other hand is relatively new and has not been used to study incorporation choices at all, and has been exploited only infrequently for other academic work. However it should be noted that other, older databases of Bureau van Dijk, especially the AMADEUS database, which covers European businesses, are well known and have been used frequently in
provided by Dun & Bradstreet data. Importantly, ICARUS distinguishes between a firm’s “location” and its “state of incorporation.” For our analyses we extract firms from the full database according to the following criteria: We start from the ICARUS version that includes update number 47, from September 2007. We extract all private US companies and exclude mere branch locations. For the sake of clarity—namely to avoid any confusion with the corporation’s place of incorporation—, we will refer to a corporation’s main location as the firm’s primary place of business.
In general, the database contains one entry per company. However, the information provided does not refer to the same year for all firms (i.e. for some business the information, e.g. on the size of the business, in this database may be for 2004). For this study, we utilize only entries of businesses for which the last available data refers to either 2005 or 2006 and that had at least 20 employees in at least one year in 2005 or 2006.5
We keep only corporations. ICARUS does not provide direct information regarding the entity type. Therefore, we make use of legal rules governing entity names in order to identify the entity type for the purpose of our study. For example, an entity whose name ends with the word “corporation” or an abbreviation thereof will be treated as a corporation. A more detailed description of the relevant coding rules is given in Annex III.
Moreover, we keep only firms whose primary place of business is located in one of the fifty states or in the District of Columbia and disregard firms whose primary place of business is located abroad or in the U.S. territories.
Furthermore, we drop corporations whose primary business is in service industries with SIC codes 80 (health services), 82 (educational services), 83 (social services), 84 (museums, art galleries, and botanical and zoological gardens) or 86 (membership organizations). The reason is that, in practice, these services will often be provided by non-profit corporations. Given that non-profit corporations are often subject to special legal rules, their incorporation choices do not allow any inference regarding incorporation choices by for-profit firms. In any case, we have confirmed that our results remain essentially unchanged regardless of whether or not we drop the afore-described industries.
After cleaning the data and dropping observations for which key variables of interest are missing, we arrive at a dataset with 277,783 company observations.
To our company-level dataset we add state level data from a variety of sources. For the GDP per state data, we rely on data from the Bureau of Economic Analysis (BEA).6 These data refer to the year 2006 and were last updated in June 2007. We group states into
5 In a few cases firms are listed twice in the database, with separate entries for 2005 and 2006. In these
cases we drop the earlier observation and keep only the observation referring to 2006.
6 Bureau of Economic Analysis, Regional Economic Accounts, Gross Domestic Product by State,
regions based on the definition of regions used by the BEA.7 As a proxy for industrial structure of the state, we use data on the number of manufacturing establishments, which we obtain from the U.S. Census Bureau.8 As a proxy for the quality of judiciaries, we use the scores that the state judiciaries were awarded in the U.S. Chamber of Commerce State Liability Systems Rankings Study 2007. As regards the content of the various state laws (i.e. veil piercing, fiduciary duties and oppression statutes, and exculpation clauses), the coding of the relevant variables will be explained below. The full state-level data that is used in our econometric work is reported in the appendix.
III. WHERE DO CLOSELY HELD CORPORATIONS INCORPORATE?
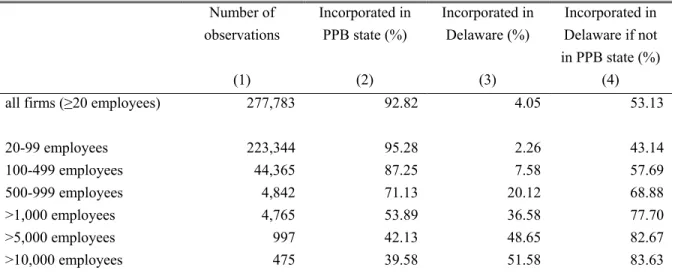
We start by investigating the untested presumption in the literature that closely held firms have a tendency to incorporate locally, meaning in the state where their principal place of business (PPB) is located. Table 1 (row 3, column 2) shows that, indeed, 92.8% of all corporations in our dataset incorporate locally. The interesting question is whether the same is true for large closely held firms. Based on the existing literature (see above), one might surmise that the answer is yes. It turns out, however, that we find strong size effects: The larger the firm size, the less likely corporations are incorporated in their home state. Out of the set of corporations with more than 1,000 employees, about half are incorporated locally and half in another state.
Table 1: The distribution of incorporation choices
Number of observations Incorporated in PPB state (%) Incorporated in Delaware (%) Incorporated in Delaware if not in PPB state (%) (1) (2) (3) (4)
all firms (≥20 employees) 277,783 92.82 4.05 53.13
20-99 employees 223,344 95.28 2.26 43.14 100-499 employees 44,365 87.25 7.58 57.69 500-999 employees 4,842 71.13 20.12 68.88 >1,000 employees 4,765 53.89 36.58 77.70 >5,000 employees 997 42.13 48.65 82.67 >10,000 employees 475 39.58 51.58 83.63
Source: own calculations based on ICARUS database
Naturally, that raises the question of where those corporations end up that decide against incorporating locally. As column 4 of Table 1 shows, the majority of these firms are incorporated in Delaware. Moreover, as firm size increases, the share of businesses that are incorporated in Delaware (conditional on not being incorporated in their home state) is well above 50% and reaches 83.6% for the largest size group considered here.
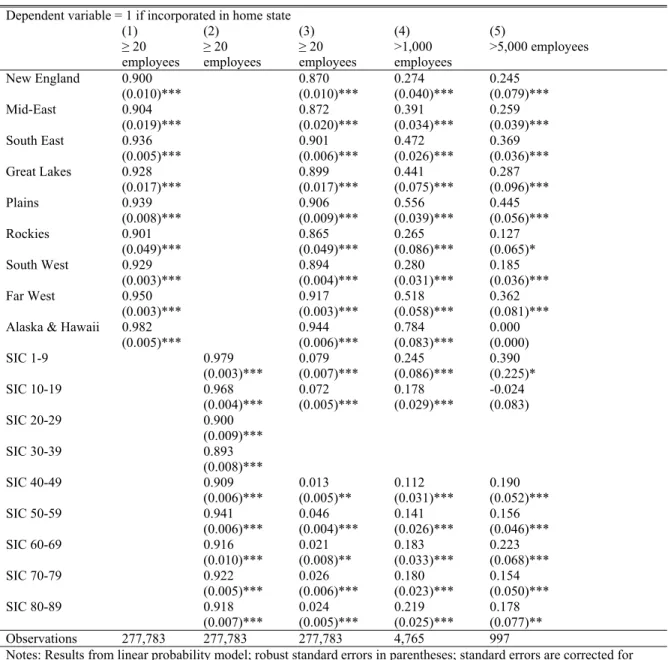
The results in Table 1 are unconditional results. We do not control for any factor other than size. Against that background, one might suspect that only firms from certain states or in certain sectors tend to incorporate outside of their home state. Therefore, we move to a regression framework to further investigate the robustness of the results reported in Table 1. To facilitate easy interpretation, we estimate linear probability models, in which the dependent variable is an indicator function which is 1 if a corporation is incorporated in its PPB state, 0 otherwise. The results of that analysis are contained in Table 2.
First, column 1 shows that the percentage of firms incorporated in their home state varies between 90% and 98% across different regions (as defined by the BEA), but that no one region is driving the results. (Similar results are obtained if we look at states instead of regions. In other words, no one state is driving the results either, but the results are not reported for this analysis at the level of individual states to economize on space).
Second, column 2 looks at industries. To show results in a concise way, we collapse the information on the firm’s sector to the one-digit SIC-level. Again, although there are important differences between industries, no one industry is driving the result. The lowest level of local incorporation exists in the manufacturing sector (2 digit SIC codes 20-39, i.e. 1-digit SIC codes 2 and 3), in which about 89.5% incorporate locally. Again, in results not shown, we also confirm at the two-digit level that it is not one industry that is driving the results.
Column 3 shows that combining state and industry information does not change the picture much. In column 3, the omitted category is the sector with the lowest percentage of firms incorporated locally, the manufacturing sector. Therefore, the coefficients reported for the sector dummy variables indicate the difference (in percentage points) to the manufacturing sector. We find that even after controlling for industry, it is not the case that one region is driving the results. Finally, we investigate whether the size effect that we noted in Table 1 exists after controlling for state and industry effects.
Columns 4 and 5 present results just for the largest firms, i.e. those with more than 1,000 and more than 5,000 employees, respectively. The results indicate that our finding regarding firm size is robust: Larger firms are more likely to be incorporated outside of their PPB state.
Table 2: Incorporation choices by region and industry
Dependent variable = 1 if incorporated in home state
(1) (2) (3) (4) (5) ≥ 20 employees ≥ 20 employees ≥ 20 employees >1,000 employees >5,000 employees New England 0.900 0.870 0.274 0.245 (0.010)*** (0.010)*** (0.040)*** (0.079)*** Mid-East 0.904 0.872 0.391 0.259 (0.019)*** (0.020)*** (0.034)*** (0.039)*** South East 0.936 0.901 0.472 0.369 (0.005)*** (0.006)*** (0.026)*** (0.036)*** Great Lakes 0.928 0.899 0.441 0.287 (0.017)*** (0.017)*** (0.075)*** (0.096)*** Plains 0.939 0.906 0.556 0.445 (0.008)*** (0.009)*** (0.039)*** (0.056)*** Rockies 0.901 0.865 0.265 0.127 (0.049)*** (0.049)*** (0.086)*** (0.065)* South West 0.929 0.894 0.280 0.185 (0.003)*** (0.004)*** (0.031)*** (0.036)*** Far West 0.950 0.917 0.518 0.362 (0.003)*** (0.003)*** (0.058)*** (0.081)*** Alaska & Hawaii 0.982 0.944 0.784 0.000
(0.005)*** (0.006)*** (0.083)*** (0.000) SIC 1-9 0.979 0.079 0.245 0.390 (0.003)*** (0.007)*** (0.086)*** (0.225)* SIC 10-19 0.968 0.072 0.178 -0.024 (0.004)*** (0.005)*** (0.029)*** (0.083) SIC 20-29 0.900 (0.009)*** SIC 30-39 0.893 (0.008)*** SIC 40-49 0.909 0.013 0.112 0.190 (0.006)*** (0.005)** (0.031)*** (0.052)*** SIC 50-59 0.941 0.046 0.141 0.156 (0.006)*** (0.004)*** (0.026)*** (0.046)*** SIC 60-69 0.916 0.021 0.183 0.223 (0.010)*** (0.008)** (0.033)*** (0.068)*** SIC 70-79 0.922 0.026 0.180 0.154 (0.005)*** (0.006)*** (0.023)*** (0.050)*** SIC 80-89 0.918 0.024 0.219 0.178 (0.007)*** (0.005)*** (0.025)*** (0.077)** Observations 277,783 277,783 277,783 4,765 997
Notes: Results from linear probability model; robust standard errors in parentheses; standard errors are corrected for pooling at the state level; * significant at 10%; ** significant at 5%; *** significant at 1%; note that because the regressions include no constant, the R-squared is difficult to interpret and thus omitted.
Source: own calculations based on ICARUS database
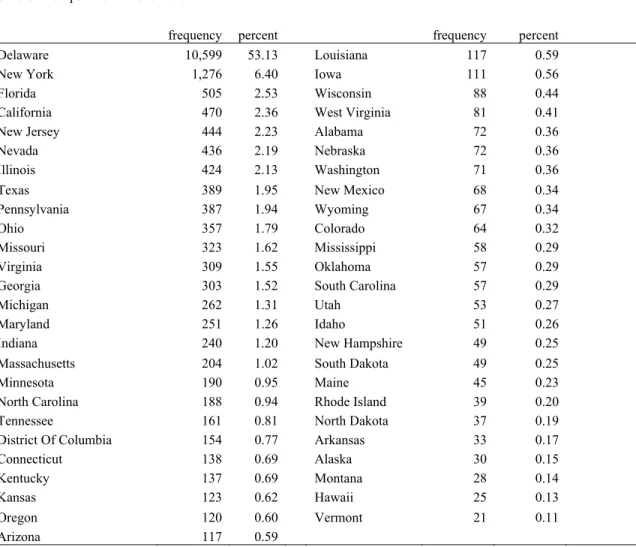
The fact that more than 50% of those corporations that are not incorporated locally are incorporated in Delaware justifies focusing on Delaware in the context of private corporations, just as it is the case in the literature on public corporations. However, we also investigate whether there is one main alternative destination to Delaware or whether those corporations that fail to incorporate locally or in Delaware end up being incorporated in a variety of states. Table 3 shows that Delaware is far ahead of the other states. New York is a distant second, attracting 6.4% of those corporations that do not incorporate
locally. Florida, California, New Jersey, Nevada, and Illinois all attract about 2%-2.5%. These results show that it is indeed justified to focus on Delaware as the alternative to local incorporation.
Table 3: Where do corporations incorporate outside of their home state?
State of incorporation if not state of PPB
frequency percent frequency percent Delaware 10,599 53.13 Louisiana 117 0.59
New York 1,276 6.40 Iowa 111 0.56
Florida 505 2.53 Wisconsin 88 0.44
California 470 2.36 West Virginia 81 0.41 New Jersey 444 2.23 Alabama 72 0.36
Nevada 436 2.19 Nebraska 72 0.36
Illinois 424 2.13 Washington 71 0.36
Texas 389 1.95 New Mexico 68 0.34
Pennsylvania 387 1.94 Wyoming 67 0.34
Ohio 357 1.79 Colorado 64 0.32
Missouri 323 1.62 Mississippi 58 0.29
Virginia 309 1.55 Oklahoma 57 0.29
Georgia 303 1.52 South Carolina 57 0.29
Michigan 262 1.31 Utah 53 0.27
Maryland 251 1.26 Idaho 51 0.26
Indiana 240 1.20 New Hampshire 49 0.25
Massachusetts 204 1.02 South Dakota 49 0.25
Minnesota 190 0.95 Maine 45 0.23
North Carolina 188 0.94 Rhode Island 39 0.20 Tennessee 161 0.81 North Dakota 37 0.19
District Of Columbia 154 0.77 Arkansas 33 0.17
Connecticut 138 0.69 Alaska 30 0.15
Kentucky 137 0.69 Montana 28 0.14
Kansas 123 0.62 Hawaii 25 0.13
Oregon 120 0.60 Vermont 21 0.11
Arizona 117 0.59
Source: own calculations based on ICARUS database
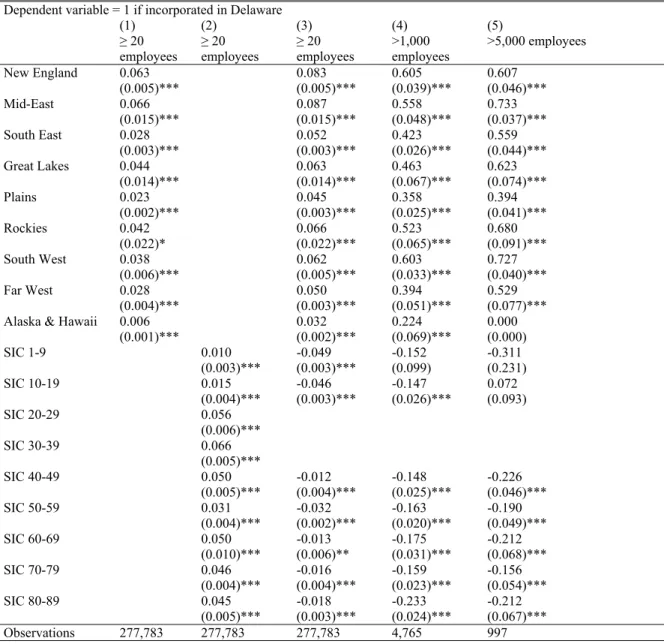
In an empirical exercise analogous to the one above, we also study whether corporations based in certain states or active in certain industries are more likely to incorporate in Delaware. The results can be found in Table 4. They show that there are significant differences across regions in the number of corporations from a region that incorporate in Delaware. For example, 6.3% of all corporations in our sample that have their primary place of business in New England are incorporated in Delaware. By contrast, of those corporations that have their primary place of business in Alaska or Hawaii, only 0.6% are incorporated in Delaware. Similarly, there are differences across sectors.
However, as mentioned before, we do not find that any one region or any one sector is driving the results.
Table 4: Incorporation decisions for Delaware by region and industry
Dependent variable = 1 if incorporated in Delaware
(1) (2) (3) (4) (5) ≥ 20 employees ≥ 20 employees ≥ 20 employees >1,000 employees >5,000 employees New England 0.063 0.083 0.605 0.607 (0.005)*** (0.005)*** (0.039)*** (0.046)*** Mid-East 0.066 0.087 0.558 0.733 (0.015)*** (0.015)*** (0.048)*** (0.037)*** South East 0.028 0.052 0.423 0.559 (0.003)*** (0.003)*** (0.026)*** (0.044)*** Great Lakes 0.044 0.063 0.463 0.623 (0.014)*** (0.014)*** (0.067)*** (0.074)*** Plains 0.023 0.045 0.358 0.394 (0.002)*** (0.003)*** (0.025)*** (0.041)*** Rockies 0.042 0.066 0.523 0.680 (0.022)* (0.022)*** (0.065)*** (0.091)*** South West 0.038 0.062 0.603 0.727 (0.006)*** (0.005)*** (0.033)*** (0.040)*** Far West 0.028 0.050 0.394 0.529 (0.004)*** (0.003)*** (0.051)*** (0.077)*** Alaska & Hawaii 0.006 0.032 0.224 0.000
(0.001)*** (0.002)*** (0.069)*** (0.000) SIC 1-9 0.010 -0.049 -0.152 -0.311 (0.003)*** (0.003)*** (0.099) (0.231) SIC 10-19 0.015 -0.046 -0.147 0.072 (0.004)*** (0.003)*** (0.026)*** (0.093) SIC 20-29 0.056 (0.006)*** SIC 30-39 0.066 (0.005)*** SIC 40-49 0.050 -0.012 -0.148 -0.226 (0.005)*** (0.004)*** (0.025)*** (0.046)*** SIC 50-59 0.031 -0.032 -0.163 -0.190 (0.004)*** (0.002)*** (0.020)*** (0.049)*** SIC 60-69 0.050 -0.013 -0.175 -0.212 (0.010)*** (0.006)** (0.031)*** (0.068)*** SIC 70-79 0.046 -0.016 -0.159 -0.156 (0.004)*** (0.004)*** (0.023)*** (0.054)*** SIC 80-89 0.045 -0.018 -0.233 -0.212 (0.005)*** (0.003)*** (0.024)*** (0.067)*** Observations 277,783 277,783 277,783 4,765 997
Notes: Results from linear probability model; robust standard errors in parentheses; standard errors are corrected for pooling at the state level; * significant at 10%; ** significant at 5%; *** significant at 1%; note that because the regressions include no constant, the R-squared is difficult to interpret and thus omitted.
IV. COURTS
In the literature on public corporations, it is widely believed that one reason for Delaware’s popularity as a state of incorporation lies in the quality of its judiciary or, more specifically, of its Court of Chancery (Alva, 1990; Kamar, 1998; McDonnel, 2004). Indeed, one prominent author has gone so far as to view Delaware’s judiciary as the main reason for Delaware’s success in attracting publicly traded corporations (Black, 1990). Moreover, empirical research confirms that publicly traded corporations are more likely to incorporate in a state that has a higher quality judicial system (Kahan, 2006).
Of course, the theoretical relevance of courts for incorporation choices is far less obvious with respect to closely held corporations than with respect to publicly traded ones. On the one hand, the lower number of owners means that closely held firms should find it easier than their publicly traded counterparts to resolve internal conflicts via negotiation rather than litigation. Hence, closely held corporations may litigate less often, reducing the need for high-quality courts. On the other hand, the absence of litigation does not imply the absence of conflicts, and even those conflicts that do not go to court tend to be negotiated “in the shadow of litigation” (e.g. Bebchuk and Fried, 2001). In other words, the expected outcome of litigation is highly relevant even to those cases that are resolved without the help of courts.
To test the relevance of courts, we seek to determine whether corporations from states with low quality judiciaries are less likely to incorporate locally than are corporations from states with high quality judiciaries. As a proxy for the quality of judiciaries, we use the scores that the state judiciaries were awarded in the 2007 U.S. Chamber of Commerce State Liability Systems Rankings Study.9
V. SUBSTANTIVE LAW
Substantive law is perhaps the most obvious candidate when it comes to explaining incorporation choices. The debate on public corporations has long been dominated by claims that corporate migration patterns are determined by differences in substantive law, with some authors claiming that corporations are attracted by efficient rules, whereas others maintain that corporations migrate towards states with rules that are inefficiently biased towards managers. It is not obvious, however, to what extent substantive law plays
9 While the said study may be a far from perfect measure of the quality of judicial systems, it has been
a role in the incorporation choices of closely held firms. In particular, two issues need to be considered in this context.
To begin, the law governing closely held corporations tends to be even more flexible than the law governing public corporations. This may reduce the incentive to incorporate in another jurisdiction. Indeed, as pointed out above, it has been suggested that the flexibility of the rules governing closely held corporations may eliminate the need to incorporate out-of-state (Ayres, 1992). Of course, that view may be too extreme. Even the law governing closely held corporations contains some mandatory rules. For example, there is broad agreement that corporations cannot simply opt out of the duty of loyalty (e.g., Frankel, 2001). Furthermore, it is not obvious that the ability to opt out of default rules renders the latter meaningless as a factor in choosing a corporate domicile. There are good reasons for why closely held corporations may prefer being governed by what they perceive as an attractive set of default rules offered by another jurisdiction rather than by an individually crafted corporate contract.10
Another reason for why substantive corporate law may not matter all that much for closely held firms has been suggested by Romano (1993). According to her, differences in corporate law are less significant to privately held firms than to publicly traded corporations because in the former, the owners can control the firm more effectively which in turn reduces the agency conflict between managers and owners. Of course, Romano’s argument does not imply (and clearly is not meant to imply) that differences in corporate law are completely irrelevant to closely held corporations. Indeed, even assuming that the agency problems between managers and owners are minimal in closely held corporations, one needs to keep in mind that closely held firms may suffer from other agency problems, namely those that arise between controlling shareholders and minority shareholders.
In order to test the relevance of substantive law, we focus on three particular features of the law governing closely held corporations, namely the rules governing veil piercing, the law on fiduciary duties, and the legality of so-called exculpation clauses. All three areas of the law have in common that they rely—at least to some extent—on rules that the corporation cannot opt out of in its charter. That is one reason why they are among the likely candidates when it comes to explaining incorporation choices. Moreover, all
10 In particular, existing default rules are often easier for courts to interpret because courts can rely on
existing precedents (Klausner, 1995). Moreover, when it comes to updating the applicable rules to changing circumstances, corporations that stick to the default can rely on courts and legislatures whereas those corporations that opt out of the default may need to renegotiate the relevant rules, which can be both costly
three features have gathered considerable attention in the legal literature,11 which means that they may be salient enough to influence incorporation choices.
A. Veil Piercing
Given the central importance that limited liability has for investors, the law on veil piercing—i.e. the law on the question of whether shareholders will be held personally liable for the debts of the corporation—seems a plausible suspect for explaining incorporation choices. Nonetheless, it is by no means obvious that the law on veil piercing has any impact on the decision where to incorporate. At first glance, there are two reasons to doubt that veil piercing law is relevant to incorporation decisions.
First, it is very difficult for corporations or anyone else to determine which states are more prone to pierce the veil than others. The law on veil piercing relies on vague standards rather than on clear-cut rules (Bainbridge, 2001; Fox, 1994; Millon, 2007), making it difficult to evaluate the piercing risk ex ante. Admittedly, courts routinely use specific tests to determine when the veil will be pierced. For example, they often ask whether the corporation was nothing but the mere “alter ego” of the shareholder, e.g. Medlock v. Medlock, 642 N.W.2d 113, 124 (Neb. 2002). However, these tests are so vague as to make it extremely difficult to predict the outcome of cases (Easterbrook and Fischel, 1985). Existing case law also fails to eliminate the said uncertainty because the relevant precedents tend to be highly fact-specific (Bainbridge, 2001). Needless to say, to the extent that corporations cannot tell which state laws carry a greater or lesser risk of veil piercing than others, they cannot easily base their incorporation decision on that factor.
Furthermore, even assuming that differences across states exist and are known to corporations, the vagueness and fact-intensiveness of the rules governing veil piercing may reduce the incentive to base incorporation choices on differences in the law on veil piercing. The plaintiff will often be able to bring suit outside the state of incorporation. Even if the court applies the law of the state of incorporation—which is not certain when it comes to tort cases (Hansmann and Kraakman, 1992)—the fact-intensiveness of that law means that the likelihood of the veil being pierced may depend more on the court— including the jury—that hears the case than on the law that is being applied.
Despite all of the above, it is noteworthy that those corporations that try to minimize the risk of veil piercing when they choose their state of incorporation are not left
11 Recent articles on veil piercing include Bainbridge (2001); Fox (1994); Millon (2007). For recent
articles on the protection of minority shareholders, see, for example, Moll (2004) and Art (2003). On exculpation clauses see, e.g., Sale (2004) and Catanzarite (2003).
without guidance. Thompson (1991) undertakes an empirical analysis of veil piercing cases across the United States. As part of his findings, he presents—for the law of each state as well as for the law of the District of Columbia—the percentage of veil piercing decisions in which the plaintiff’s attempt to pierce the veil was successful. Needless to say, these data do not really allow any conclusions regarding the actual likelihood that the corporate veil will be pierced in a given state. Among other things, different types of cases may be brought to trial in different states. For example, in states where the courts pierce the corporate veil only in a narrowly defined group of cases, plaintiffs may be reluctant to bring suit except in the most egregious situations, meaning that the percentage of cases in which the veil is pierced may actually be higher in such states than in states where courts are quicker to pierce the veil.
Nonetheless, Thompson’s study proves helpful in the context at hand. In part, this is because published piercing cases may shape the expectations of lawyers and corporations despite the fact that they do not really allow any conclusions regarding the actual risk of veil piercing. For example, Thompson reports that while eleven piercing cases were decided under Delaware law, none of them resulted in the veil being pierced. It is easy to see how such a barrage of failed attempts to pierce the veil will lead lawyers to conclude that the principle of limited liability is taken very seriously by Delaware law. Moreover, to some extent, Thompson’s study itself may well have shaped the expectations of lawyers and corporations. This is because in practice, that study is being used by incorporation services to support the claim that some states are more likely to pierce the corporate veil than others.12
In our regression framework below, we therefore use the percentage of cases in which the veil was pierced according to Thompson’s study as our variable of interest to study the role of veil piercing in the incorporation decisions of corporations.
B. Fiduciary Duties and Oppression Statutes
The second area of substantive law that we focus on are the rules governing the protection of minority shareholders. Unlike in publicly traded corporations where the primary agency conflict tends to arise between managers and shareholders, it is the conflict between controlling shareholders and minority shareholders that has proven the most substantial challenge for the law on closely held corporations. The minority shareholders may suffer various sorts of oppressive behavior, typically referred to as “freeze-outs,” that
12
aim at enriching the controlling shareholder(s) at the expense of the minority (Ragazzo, 1999). Most importantly, the controlling shareholder may use his control to extract private benefits—e.g. in the form of a lush salary—while at the same time preventing the payment of dividends to the minority shareholders.
To protect minority shareholders against abuses of the afore-described type, state laws have developed two main approaches, namely oppression statutes and enhanced fiduciary duties (Moll, 2001; Thompson, 1993).
Oppression statutes allow the courts to dissolve the corporation if the minority shareholders suffer “oppression” or “unfairness”at the hands of those in control.
As regards fiduciary duties, some states such as Massachusetts are famous for imposing stronger fiduciary duties on the shareholders of closely held corporations than on the shareholders of public corporations.13 The underlying idea is that shareholders in a closely held corporation are more comparable to partners in a partnership than to shareholders in a public corporation, so that their relations should be governed by partnership-style fiduciary duties, Donahue v. Rodd Electrotype Co., 328 N.E.2d 505, 515 (Mass. 1975). Other states, such as Delaware have explicitly rejected such an approach, choosing instead to apply the same principles that govern fiduciary duties in public corporations, e.g., Nixon v. Blackwell, 626 A.2d 1366, 1380–81 (Del. 1993).
Obviously, oppression statutes and partnership-style fiduciary duties are to some extent interchangeable mechanisms (Thompson, 1993; Mitchell, 1990): For a minority shareholder oppressed by those in control, the question of whether he is protected by an oppression statute or by partnership-style fiduciary duties matters far less than the question of whether he is protected by at least one of these two instruments. Therefore, we have constructed a variable—low protection—that takes into account both the existence of oppression statutes and the extent to which the law recognizes partnership-style fiduciary duties in closely held corporations.
It should be noted, in this context, that when it comes to oppression statutes, the states fall into two main categories: those states whose statutes allow for judicial dissolution based on oppression or unfairness and those states that do not. For purposes of robustness checks, we have further subdivided the latter category: Some of those states that
13 In its most famous case on the issue, Donahue v. Rodd Electrotype Co., 328 N.E.2d 505, 515
(Mass. 1975), the Massachusetts Supreme Court imposed a duty of “utmost good faith and loyalty” on the shareholders in closely held corporations and stressed that this was the same standard of duty owed by partners to one another. In Wilkes v. Springside Nursing Home, Inc., 353 N.E.2d 657, 663 (Mass. 1976), softened its earlier position by adding a balancing test, but in principle retained the strict good faith duty enounced in Donahue.
do not provide for judicial dissolution in case of unfairness or oppression at least list “fraud” and “illegality” as sufficient reasons for judicial dissolution, while others do not.
With respect to fiduciary duties, we build on a recent article by Siegel (2004) that classifies states according to what position their courts take on the issue of fiduciary duties in closely held corporations. Because the Massachusetts approach with its partnership-style fiduciary duties is often considered to be prevailing across the states, Siegel refers to it as the “true majority” rule while she calls Delaware’s position the “true minority” rule. According to her, the states can be divided into six main categories namely (1) states that have adopted the true majority rule, (2) states that have partially adopted the majority rule, (3) states that are too close to call, (4) states that cannot be assigned to either the minority or the majority rule because their courts solve the relevant cases under an oppression statute rather than by invoking fiduciary duties, (5) states that cannot be assigned to either the majority or the minority rule because their courts have not decided the issue, and (6) states that have adopted the minority rule.
Our variable low protection takes into account whether the state has adopted an oppression statute and to what extent it recognizes enhanced fiduciary duties in closely held corporations. The variable low protection takes on the value zero if either the state’s statutory law provides for judicial dissolution in case of oppression or unfairness or if the state has adopted the “true majority rule,” i.e. the generous Massachusetts position on fiduciary duties. By contrast, the variable low protection takes on the value 1 if neither of the afore-mentioned conditions is fulfilled. See the table in Appendix II for the codes state-by-state.
For the purpose of robustness checks, we have also constructed two further variables, namely low protection 2 and low protection 3. Low protection 2 is different from low protection in that low protection 2 is more generous when it comes to evaluating the protective effect of fiduciary duties. More specifically, low protection 2 is zero— indicating a high level of protection—if either the state’s statutory law provides for judicial dissolution in case of oppression or unfairness or if the state has truly or partially adopted the (generous) Massachusetts position on fiduciary duties.
Low protection 3 differs from low protection with respect to the definition of what counts as an oppression statute: For purposes of low protection 3, a statute does not have to list unfairness or oppression as reasons for judicial dissolution in order to be considered an oppression statute. Rather, statutes that allow for judicial dissolution in case of “illegality” or “fraud” are also deemed oppression statutes. Accordingly, low protection 3 is zero if either the state’s statutory law provides for judicial dissolution in case of
oppression or unfairness or fraud or illegality or if the state has truly adopted the (generous) Massachusetts position on fiduciary duties.
C. Exculpation Clauses
Another issue of potential relevance to closely held corporations concerns the legality of so-called exculpation clauses: Corporate directors are generally protected from personal liability for bad business decisions by the so-called business judgment rule. However, as a general rule, they lose that protection if they face a conflict of interest, act in bad faith, or fail to get reasonably informed. For independent directors on the boards of publicly traded corporations, the risk of being held personally liable began to seem quite real after the so-called Smith v. Van Gorkom decision in which the Delaware Supreme Court found that the directors of a public corporation that had been sold in a somewhat hasty fashion had acted grossly negligent and could not claim the protection of the business judgment rule, Smith v. Van Gorkom, 488 A.2d 858, 881 (Del. 1985). The Delaware legislature reacted by enacting section 102(b)(7) of the Delaware General Corporation Law—a provision that specifically allows corporations to limit or eliminate the personal liability of directors for certain types of duty violations via so-called exculpation clauses in the corporate charter. However, section 102(b)(7) does not eliminate the directors’ risk of personal liability entirely. Rather, while allowing exculpation clauses in principle, it also imposes certain limitations on the freedom of corporations to limit the liability of directors. Most importantly, the liability for breaches of the duty of loyalty cannot be limited or eliminated.
Many other states soon followed suit (Kahan and Rock, 2005) and enacted provisions that either authorized exculpation clauses or even changed the default rules governing directorial liability. To be sure, all of these statutes have their limits. In particular, no state statute authorizes corporations to limit a director’s liability for unlawfully paid dividends, intentional wrongdoing, or knowing violations of criminal law. Nevertheless, the question is whether the existence of a statute that allows for exculpation clauses in the charter or even provides for a limitation of directorial liability as the default has any impact on incorporation decisions. In a recent article, Kahan (2006) uses state-level data to analyze that question with respect to IPO firms and finds that a larger share of firms incorporates in the home state if the home state has a statute allowing exculpation clauses.
However, there is reason to doubt whether the rules on exculpation clauses also matter to closely held corporations. Two considerations suggest that they may not:
To begin, the prevalence of exculpation statutes may at least in part be owed to managerial opportunism.14 In closely held corporations that tend to be controlled by one or
more shareholders, managerial opportunism is easier to contain. Admittedly, there is the possibility that majority shareholders who double as directors will seek to exploit the minority shareholders. However, it may be more feasible for minority shareholders in closely held firms than for their peers in publicly traded firms to protect themselves against inefficient exculpation clauses. In particular, they may find it easier to protect themselves against opportunistic mid-stream charter amendments, e.g. by bargaining for veto rights. Thus, the risk that inefficient exculpation clauses are adopted after a corporation has been formed may be lower for closely held firms than for publicly traded corporations.
Moreover, exculpation clauses may be less efficient for closely held firms than they are for publicly traded corporations. In publicly traded corporations, one legitimate function of exculpation clauses is to prevent an imbalance between the risks that a director faces and the rewards that he may reap—an imbalance that in the worst case may prevent corporations from finding suitable candidates for their board. In closely held firms, however, the controlling shareholder(s) frequently double as the firm’s directors. Hence, whatever imbalance between risk and rewards may threaten to distort the choices made by the directors of public corporations, such imbalance will often be less pronounced in closely held firms.
In testing the relevance of exculpation clauses, we rely on the coding used by Kahan (2006), who distinguishes between those states that have enacted statutes allowing exculpation clauses and those that have not.
VI.RESULTS
This section provides the main empirical results regarding the determinants of incorporation decisions. All regressions results are from probit models, and we show the marginal probit coefficients. Further, note that all standard errors are corrected for correlation of standard errors at the state level, which is important in the present context since we use firm-level observations, while the key variables of interest only vary at the
14 One might be tempted to point out that managerial opportunism should not matter for IPO firms and
that those are the very firms that (Kahan, 2006) focuses on. However, to the extent that investors anticipate opportunistic mid-stream charter amendments, they will not reward IPO firms that abstain from including an exculpation clause in their charter. Inter alia for that reason, (anticipated) managerial opportunism may explain why even IPO charters are inefficiently prone to contain exculpation clauses. For a more general
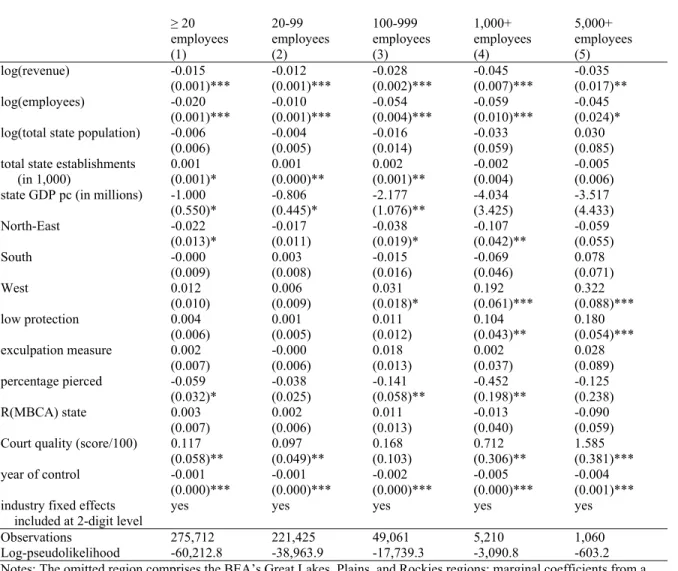
state level.15 We include a standard set of baseline controls at the firm level and at the state level, where we follow Bebchuk and Cohen (2003) in the choice of the specification as much as is possible with our data.16 Thus, we include in all specifications the logarithms of the corporation’s employment and revenue. We also include variables to control for state population, the number of manufacturing establishments in a state as well as state GDP per capita. In addition, we control for unobserved regional variation with the inclusion of regional indicator variables that are based on the definition of regions that the Bureau of Economic Analysis (BEA) uses. The BEA distinguishes eight regions (plus Alaska and Hawaii). In most of the analysis, we collapse the BEA’s regions to four regions.17 Finally, we also control for industry effects by including a full set of industry dummies at the 2-digit level, which amounts to including 67 dummy variables. The key results are in Table 5. The information about quality of courts does not exist for the District of Columbia. Therefore, the following empirical analysis does not include the 601 corporations with PPB in the District of Columbia (out of the 277,783 corporations in our full sample). However, in Appendix I we report the results of the key regression specifications that exclude the quality of courts variable and therefore allow us to include the 601 corporations that have their PPB in the District of Columbia. The results that we report in Appendix I indicate that the key findings regarding the other variables do not change significantly when we include the observations from the District of Columbia.
A. Baseline Variables
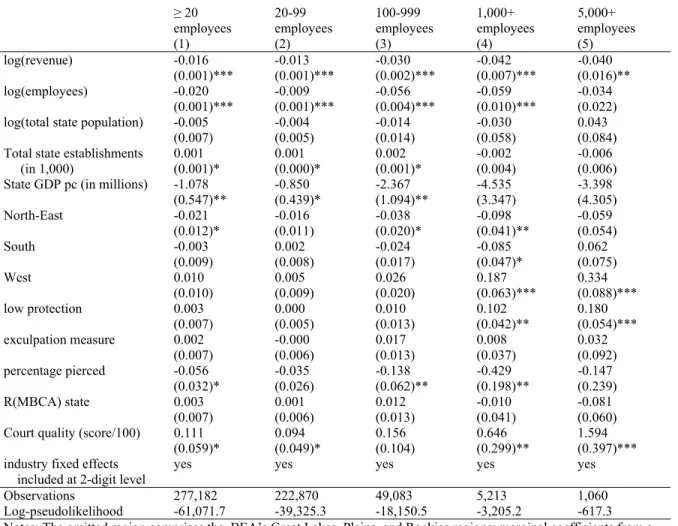
As regards the baseline variables, we confirm the size effects that we observed earlier: Both indicators of firm size—revenue and employment—are negative. Larger
15 For an example of how misleading inference in this case can be if standard errors are not corrected,
see Moulton (1990).
16 Notably our specification differs because we do not have firm value and therefore we cannot compute
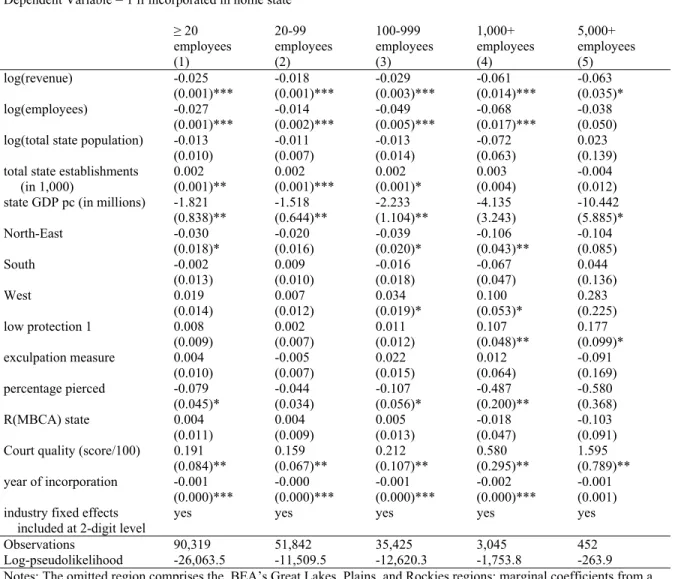
Tobin’s Q. Nor can we compute return on assets. However, note that these two variables were insignificant in their baseline results (Bebchuk and Cohen, 2003, table 7) and not included in later specifications. Bebchuk and Cohen (2003) also include variables that indicate whether the firm went public recently. Unfortunately, information about the year of incorporation in our data is missing for a large number of observations (about two-thirds of the observations). Therefore we have left out this variable in our baseline regressions. However, regressions that include this measure confirm that our findings regarding key variables remain essentially unchanged. We also use a variable “year of control” that indicates when current ownership took control of a corporation. This variable exists for almost our entire sample. Including it does not change qualitatively our key results either. Full results of these robustness checks are reported in Appendix I.
17 Regions are collapsed as follows: North-East comprises BEA’s New England and Mid East regions.
South comprises BEA’s South-West and South-East regions. West comprises BEA’s Far West region. The fourth region (which is typically the omitted reference region in our regressions) comprises BEA’s Great Lakes, Plains, and Rockies regions.
corporations are less likely to incorporate locally. The results regarding the state-level variables are mixed: While state population does not appear to have a significant role, both the number of manufacturing establishments in state and GDP per capita are correlated with the decision where to incorporate for smaller corporations. A corporation is more likely to incorporate locally in states which have a large number of establishments, while a corporation is less likely to incorporate locally in richer states (as measured by GDP per capita).18
Table 5: Baseline results
Dependent Variable = 1 if incorporated in home state
≥ 20
employees 20-99 employees 100-999 employees 1,000+ employees 5,000+ employees (1) (2) (3) (4) (5) log(revenue) -0.016 -0.013 -0.030 -0.042 -0.040 (0.001)*** (0.001)*** (0.002)*** (0.007)*** (0.016)** log(employees) -0.020 -0.009 -0.056 -0.059 -0.034
(0.001)*** (0.001)*** (0.004)*** (0.010)*** (0.022) log(total state population) -0.005 -0.004 -0.014 -0.030 0.043
(0.007) (0.005) (0.014) (0.058) (0.084) Total state establishments 0.001 0.001 0.002 -0.002 -0.006 (in 1,000) (0.001)* (0.000)* (0.001)* (0.004) (0.006)
State GDP pc (in millions) -1.078 -0.850 -2.367 -4.535 -3.398
(0.547)** (0.439)* (1.094)** (3.347) (4.305) North-East -0.021 -0.016 -0.038 -0.098 -0.059 (0.012)* (0.011) (0.020)* (0.041)** (0.054) South -0.003 0.002 -0.024 -0.085 0.062 (0.009) (0.008) (0.017) (0.047)* (0.075) West 0.010 0.005 0.026 0.187 0.334 (0.010) (0.009) (0.020) (0.063)*** (0.088)*** low protection 0.003 0.000 0.010 0.102 0.180 (0.007) (0.005) (0.013) (0.042)** (0.054)*** exculpation measure 0.002 -0.000 0.017 0.008 0.032 (0.007) (0.006) (0.013) (0.037) (0.092) percentage pierced -0.056 -0.035 -0.138 -0.429 -0.147 (0.032)* (0.026) (0.062)** (0.198)** (0.239) R(MBCA) state 0.003 0.001 0.012 -0.010 -0.081 (0.007) (0.006) (0.013) (0.041) (0.060) Court quality (score/100) 0.111 0.094 0.156 0.646 1.594
(0.059)* (0.049)* (0.104) (0.299)** (0.397)*** industry fixed effects yes yes yes yes yes
included at 2-digit level
Observations 277,182 222,870 49,083 5,213 1,060 Log-pseudolikelihood -61,071.7 -39,325.3 -18,150.5 -3,205.2 -617.3 Notes: The omitted region comprises the BEA’s Great Lakes, Plains, and Rockies regions; marginal coefficients from a probit model are shown; robust standard errors in parentheses, corrected for clustering at the state-level; * significant at 10%; ** significant at 5%; *** significant at 1%
18 Note that this finding is consistent with the hypothesis—first advanced by Klausner (1995)—that
network effects are significant to the attractiveness of a state’s corporate law: A greater number of manufacturing establishments will usually mean a greater number of businesses, and in light of the fact that many closely held corporations incorporate locally, a greater number of businesses means that more firms are governed by the same law. This, in turn, may give rise to network effects that may make it more attractive to
B. Courts
What are our findings regarding the role of courts? As the quality of a state’s judiciary increases, so does the likelihood that a corporation with its principal place of business in that state incorporates locally. A significantly positive association exists for the full sample (column 1), but it is particularly strong for larger firms with more than 1,000 employees (columns 4 and 5). Importantly, the parameter estimate on the courts score variable is not only statistically significant, but the magnitude is also economically important. The parameter estimate for larger firms (1000+ employees) implies that increasing the quality of courts score by one point (and leaving all other variables at their mean values of the sample) is associated with a 0.646 percentage points higher probability of being incorporated locally (note that for the regressions the courts score measure is rescaled, namely divided by 100). Therefore, a corporation from a state that is at the 75th percentile of the courts score (with a score of 66.7) has a probability of being incorporated in the home state that is approximately 5.8 percentage points higher than it is for a corporation at the 25th percentile of the courts score (with a score of 57.7).
We are controlling for many other state characteristics that high quality courts may be a proxy for, so these cannot explain the finding. In other words, courts remain positively correlated with incorporation choices even after controlling for other relevant state-level characteristics.
C. Veil piercing
What role does veil piercing play? As explained above, to study the role of veil piercing, we use the percentage of cases in which the veil was pierced according to Thompson’s study. In the full sample, including all firm sizes, we find that the higher the percentage of cases in which the veil was pierced, the lower the likelihood that a corporation from that state incorporates locally. As a comparison across columns shows, this finding is strongest for firms in the size range of 100-5,000 employees (i.e. in columns 3 and 4) where it is both statistically and economically significant. For smaller and for larger firms there is a negative coefficient, but it is no longer significant (columns 2 and 5).
D. Fiduciary Duties and Oppression Statutes
We find that our variable that indicates low protection is positive throughout and statistically significant for the largest firms with more than 1,000 employees. Thus, large firms are more likely to incorporate in their PPB state if the degree of protection that the
PPB state’s law offers minority shareholders is low. Once again, the parameter estimate on the low protection variable is not only statistically significant, but the magnitude is also economically significant. For larger firms (1000+ employees) the coefficient of 0.102 implies that being located in a PPB state with low protection as opposed to a state with high protection (and the mean values in the sample of other variables) is associated with a 10 percentage points larger probability of being incorporated outside of the PPB state.
E. Exculpation Clauses
As regards the law on exculpation clauses, our results regarding exculpation measures are consistent with a positive association, but the coefficients are not significant at conventional levels. Thus, our results contrast with those of Kahan (2006) who finds a statistically significant relationship with respect to IPO firms. This is not particularly surprising. As pointed out above, publicly traded corporations may well have a stronger preference for exculpation clauses than closely held firms. In particular, it needs to be kept in mind that the function of exculpation clauses is to make the directors, who stand to reap only a tiny fraction of the benefits that their decisions produce, less risk-averse. That function is less relevant to closely held firms where the shareholders will often double as the corporation’s directors.
Of course, it may also be the case that differences between different types of exculpation clauses play a role. While it is not always entirely clear to what extent differences in the wording of exculpation statutes actually lead to differences in meaning, there is one issue on which the different states differ in a relatively obvious manner. That issue concerns the liability of directors in those cases where the directors have received a personal benefit to which they are not entitled: Many states simply do not allow the liability of directors to be limited when it comes to transactions where the directors have received a benefit to which they are not entitled. These states either do not authorize any exculpation clauses at all, or they allow them in principle but contain an exception for cases of the type at issue. (States that prohibit exculpation clauses with respect to violations of the duty of loyalty also fall into this category because the receipt of a personal benefit to which the director is not entitled implicates the director’s duty of loyalty.) By contrast, other states are more generous. At least in principle,19 they allow exculpation clauses according to which the receipt of a personal benefit to which the director is not
entitled either does not lead to personal liability or leads to personal liability only in the amount of the benefit received.
However, even using that distinction for an alternative coding of the exculpation variable, we cannot find a statistically significant relationship.
F. MBCA
Finally, we also include an indicator variable that is 1 if a state has adopted the Model Business Corporation Act or the Revised Model Business Corporation Act and 0 if the state has adopted neither act. The results regarding this variable are inconclusive: In the full sample there is no association between a state having adopted the Revised Model Business Corporation Act (RMBCA) or the Model Business Corporation Act (MBCA) and the probability that corporations in that state incorporate locally. For the largest corporations, there is a negative correlation, but that correlation is not significant at conventional levels. This finding parallels findings of Bebchuk and Cohen (2003) who find no association between the incorporation decisions of public firms and whether their home state has adopted the RMBCA or the MBCA or not.
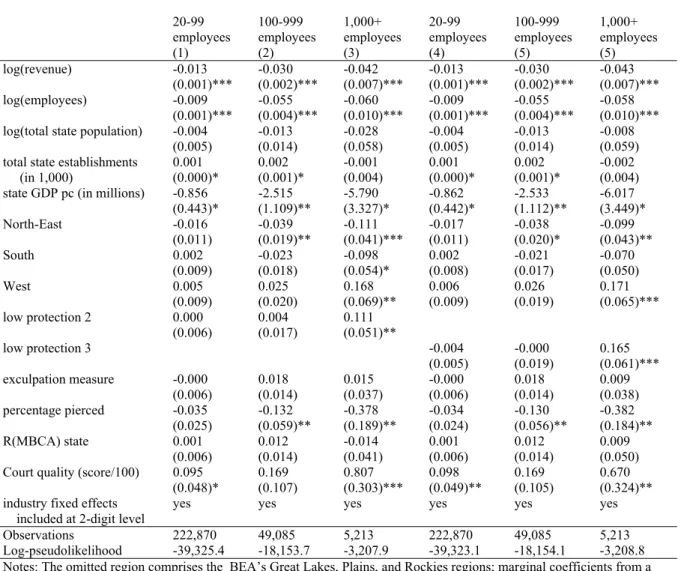
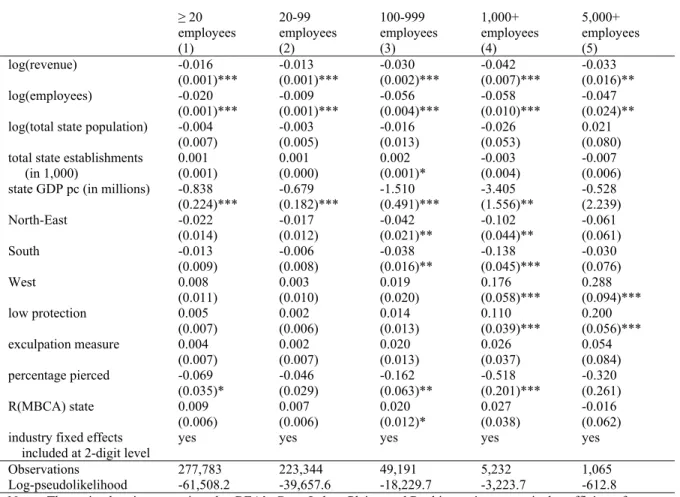
G. Minority Protection – robustness checks
There is some ambiguity regarding the coding of the variable that summarizes whether states offer a high or low degree of protection to minority shareholders. Therefore, we check the robustness of our results by running regressions with two alternative measures of the low protection variable—namely low protection 2 and low protection 3 (defined as described above). The results, which are displayed in Table 6, indicate that our main results do not depend on the particular measure of protection that is used. The alternative protection measures are again positive for the largest corporations, but insignificant for the smaller firms. In fact, for the firms with 1,000 or more employees, the marginal coefficient is larger in the case of both alternative measures compared to the baseline results and more significant in the case of the second alternative measure. We also still find a significant positive correlation between court quality and local incorporation decisions, as well as a negative association between percentage pierced and local incorporation, especially for the larger firms.
Table 6: Robustness of results to different low protection variables
Dependent Variable = 1 if incorporated in home state
20-99 employees 100-999 employees 1,000+ employees 20-99 employees 100-999 employees 1,000+ employees (1) (2) (3) (4) (5) (5) log(revenue) -0.013 -0.030 -0.042 -0.013 -0.030 -0.043 (0.001)*** (0.002)*** (0.007)*** (0.001)*** (0.002)*** (0.007)*** log(employees) -0.009 -0.055 -0.060 -0.009 -0.055 -0.058 (0.001)*** (0.004)*** (0.010)*** (0.001)*** (0.004)*** (0.010)*** log(total state population) -0.004 -0.013 -0.028 -0.004 -0.013 -0.008 (0.005) (0.014) (0.058) (0.005) (0.014) (0.059) total state establishments 0.001 0.002 -0.001 0.001 0.002 -0.002 (in 1,000) (0.000)* (0.001)* (0.004) (0.000)* (0.001)* (0.004) state GDP pc (in millions) -0.856 -2.515 -5.790 -0.862 -2.533 -6.017
(0.443)* (1.109)** (3.327)* (0.442)* (1.112)** (3.449)* North-East -0.016 -0.039 -0.111 -0.017 -0.038 -0.099 (0.011) (0.019)** (0.041)*** (0.011) (0.020)* (0.043)** South 0.002 -0.023 -0.098 0.002 -0.021 -0.070 (0.009) (0.018) (0.054)* (0.008) (0.017) (0.050) West 0.005 0.025 0.168 0.006 0.026 0.171 (0.009) (0.020) (0.069)** (0.009) (0.019) (0.065)*** low protection 2 0.000 0.004 0.111 (0.006) (0.017) (0.051)** low protection 3 -0.004 -0.000 0.165 (0.005) (0.019) (0.061)*** exculpation measure -0.000 0.018 0.015 -0.000 0.018 0.009 (0.006) (0.014) (0.037) (0.006) (0.014) (0.038) percentage pierced -0.035 -0.132 -0.378 -0.034 -0.130 -0.382 (0.025) (0.059)** (0.189)** (0.024) (0.056)** (0.184)** R(MBCA) state 0.001 0.012 -0.014 0.001 0.012 0.009 (0.006) (0.014) (0.041) (0.006) (0.014) (0.050) Court quality (score/100) 0.095 0.169 0.807 0.098 0.169 0.670
(0.048)* (0.107) (0.303)*** (0.049)** (0.105) (0.324)** industry fixed effects yes yes yes yes yes yes
included at 2-digit level
Observations 222,870 49,085 5,213 222,870 49,085 5,213 Log-pseudolikelihood -39,325.4 -18,153.7 -3,207.9 -39,323.1 -18,154.1 -3,208.8 Notes: The omitted region comprises the BEA’s Great Lakes, Plains, and Rockies regions; marginal coefficients from a probit model are shown; robust standard errors in parentheses, corrected for clustering at the state-level; * significant at 10%; ** significant at 5%; *** significant at 1%
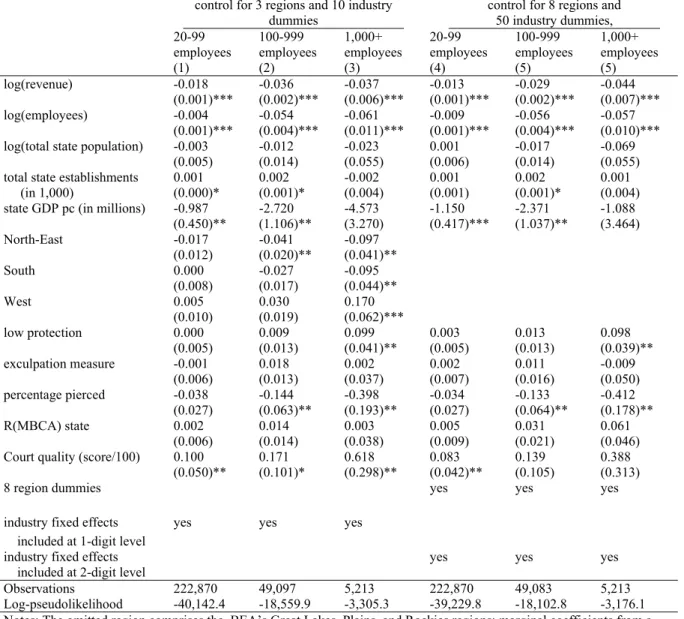
H. Robustness to Alternative Regional and Industry Controls
Finally, we also check the robustness of our main results by using more regional controls and a smaller number of industry fixed effects (see Table 7 below). We first reduce the number of industry fixed effects that we use. We restrict ourselves to 9 industry fixed effects, i.e. at the 1 digit SIC level (columns 1-3). In columns 4-6 we then use 8 indicator variables to control for unobserved regional variation instead of 3 regional indicators. Appendix I contains further robustness checks in which we include variables related to the age of corporations (tables 8 and 9) and exclude the “court quality” variable which allows us to include observations from the District of Columbia (Table 10).
Overall, Table 7 below and the results in the appendix show that our main results are quite robust.
Table 7: Robustness of results to different regional and industry aggregations
Dependent Variable = 1 if incorporated in home state
control for 3 regions and 10 industry dummies
control for 8 regions and 50 industry dummies, 20-99
employees 100-999 employees 1,000+ employees 20-99 employees 100-999 employees 1,000+ employees (1) (2) (3) (4) (5) (5) log(revenue) -0.018 -0.036 -0.037 -0.013 -0.029 -0.044 (0.001)*** (0.002)*** (0.006)*** (0.001)*** (0.002)*** (0.007)*** log(employees) -0.004 -0.054 -0.061 -0.009 -0.056 -0.057 (0.001)*** (0.004)*** (0.011)*** (0.001)*** (0.004)*** (0.010)*** log(total state population) -0.003 -0.012 -0.023 0.001 -0.017 -0.069 (0.005) (0.014) (0.055) (0.006) (0.014) (0.055) total state establishments 0.001 0.002 -0.002 0.001 0.002 0.001 (in 1,000) (0.000)* (0.001)* (0.004) (0.001) (0.001)* (0.004) state GDP pc (in millions) -0.987 -2.720 -4.573 -1.150 -2.371 -1.088
(0.450)** (1.106)** (3.270) (0.417)*** (1.037)** (3.464) North-East -0.017 -0.041 -0.097 (0.012) (0.020)** (0.041)** South 0.000 -0.027 -0.095 (0.008) (0.017) (0.044)** West 0.005 0.030 0.170 (0.010) (0.019) (0.062)*** low protection 0.000 0.009 0.099 0.003 0.013 0.098 (0.005) (0.013) (0.041)** (0.005) (0.013) (0.039)** exculpation measure -0.001 0.018 0.002 0.002 0.011 -0.009 (0.006) (0.013) (0.037) (0.007) (0.016) (0.050) percentage pierced -0.038 -0.144 -0.398 -0.034 -0.133 -0.412 (0.027) (0.063)** (0.193)** (0.027) (0.064)** (0.178)** R(MBCA) state 0.002 0.014 0.003 0.005 0.031 0.061 (0.006) (0.014) (0.038) (0.009) (0.021) (0.046) Court quality (score/100) 0.100 0.171 0.618 0.083 0.139 0.388
(0.050)** (0.101)* (0.298)** (0.042)** (0.105) (0.313)
8 region dummies yes yes yes
industry fixed effects yes yes yes included at 1-digit level
industry fixed effects yes yes yes included at 2-digit level
Observations 222,870 49,097 5,213 222,870 49,083 5,213 Log-pseudolikelihood -40,142.4 -18,559.9 -3,305.3 -39,229.8 -18,102.8 -3,176.1 Notes: The omitted region comprises the BEA’s Great Lakes, Plains, and Rockies regions; marginal coefficients from a probit model are shown; robust standard errors in parentheses, corrected for clustering at the state-level; * significant at 10%; ** significant at 5%; *** significant at 1%