Network embeddedness in exploration and exploitation of joint R&D projects: a structural approach
Abstract
This paper analyses how network embeddedness affects exploration and exploitation R&D project performance. By developing joint projects, partners and projects are linked to one another and form a network that generates social capital. We examine how the location, which determines the access to information and knowledge within a network of relationships, affects the performance of projects. We consider this question in the setup of exploration and exploitation projects, using a database built from an EU Framework. We find that each of the structural´ embeddedness dimensions (degree, betweenness and eigenvector centrality) have a different impact on the exploration and exploitation project performance. Our empirical analysis extends to project management literature, and social capital theory, by including the effect that the acquisition of external knowledge has on the performance of the project.
Introduction
Numerous interfirm initiatives are organized and executed as projects (Bendoly et al., 2010; Bendoly et al., 2014). A joint R&D project is a union of two or more firms, individuals or institutions, with the aim of developing a technological project (Arranz and Arroyabe, 2015). The completion of the R&D project is a dynamic process, where the technological process is distributed among partners that requires the execution of a set of activities and creates interactions among them (Pek-Hoi and Roberts, 2005; Squire et al., 2009; Almirall and Casadesus-Masanell, 2010). In this context, Grewal et al. (2006), and Arranz and Arroyabe (2013) consider that by developing joint projects, partners and projects are inter-related. Partners are related to one another because they work together on projects allowing the exchange of information and knowledge. Projects on their part are related to one another because they share
partners, which allow to increase the level of project information as a result of the partners’ participation in other projects. This creates a network of relationships between projects and partners that permits the exchange of information among them, which is expected to have an impact on the joint project performance.
In this context, Granovetter (1992), and Nahapiet and Ghoshal (1998) introduce the concept of the network embeddedness, suggesting that the structure of relationships involved in a network provides information and knowledge, which has a significant impact on its economic and innovative performance. The impact of network embeddedness on performance has been studied at multiple levels using different measures of performance (Ruef et al., 2003). In fact, researchers have increasingly moved from the dyadic level to a network level analysis in order to understand the nature, effects and interdependencies of network structures (Gulati, 1998; Ahuja, 2000; Koka and Prescott, 2002). There are many studies that analyse the effect of network relations among partners on firm performance (Avedas, 2009; Kastelli et al., 2004; Ortega and Aguillo, 2010; Pandza et al., 2011; Protogerou et al., 2012; Vonortas and Okamura, 2013; Agostini and Nosella, 2017); however, the study of network embeddedness and project performance has been less analysed (Grewal et al., 2006; Singh et al., 2011; Vicenzo and Mascia, 2012; Arranz and Fernandez de Arroyabe, 2013). The recognition that embeddedness in network structures is an important variable to explain managerial performance has been highlighted by Moran (2005) and Singh et al (2011), who emphasized the importance of investigating its effect from individuals and small groups to larger organizations, and even in communities and nations. In a similar manner, the study of the network embeddedness of the project and partners is an important research question to understand the joint project performance.
However, it is not so clear how network embeddedness influences project performance (Arranz and Arroyabe, 2013; Grewal et al., 2006). Grewal et al. (2006) point out that projects and partners can occupy different positions in the network of relationships, which provide different types of information. In this sense, Coleman (1988) argued that the location or form of embeddedness allows the actors to access different types of information, which have a different impact on the performance of actors. Burt (1992) pointed out the benefits of access to non-redundant contacts in order to obtain novel information, and Rosa et al. (1999) and Koka and Prescott (2002) showed, in contrast, that high network embeddedness implies that partners may
be exposed to too much information, leading to cognitive overload and poorer work performance. Given that R&D objectives vary across projects (Rothaermel and Deeds, 2004), different projects’ typology has different information needs (Holland, 1975; Hoang and Rothaermel, 2010). Therefore, considering the diversity of partners and projects position in the network of interrelations and the heterogeneity of the projects, our study explores the effect ofthe positions of projects and partners in the network of interrelations on the performance of joint R&D projects.
To analyse this research question, the data used in this study comes from a database built up in the context of wider research on R&D projects developed within the 6th Framework
(2002-2006) and 7th Framework (2007-2013) EU Programs. Firstly, our paper is framed within the
structural dimension of the network embeddedness (Granovetter, 1992; Gulati, 1998). More specifically, we explore three centrality positions (degree, betweenness and eigenvector centrality), each of which provides access to a different kind of information. Secondly, based on the work of Grewal et al. (2006), who distinguishes two modes of affiliation to the network (one refers to the project's position in the network, and the other to the position of the coordinator's project in the network), we consider that the perceptions of the project coordinator alone do not cover the reality associated with the networks (Mothe and Quélin, 2000; Avedas, 2009; Ebers and Maurer, 2014), reason why we analyse both the position of projects and partners in the network of interrelationships. Finally, following the distinction made by March (1991) and Rothaermel and Deeds (2004), we analyse two types of projects, exploration and exploitation, considering their distinct objectives and, therefore their different needs of information (Tiwana, 2008; Eriksson, 2013; Michelfelder and Kratzer, 2013).
Theory and Hypotheses
Network embeddedness
The social capital perspective provides an interesting theoretical framework from which to explain the actual and potential resources embedded in the networks of relationships (Gatignon et al., 2002; Nahapiet and Ghoshal, 1998; Subramaniam and Youndt, 2005; Mitsuhashi and Min, 2016). Moran (2005, page 1129) points out that “the social capital is a valuable asset and that its value stems from the access to resources that it engenders through an actor’s social
relationships”. Granovetter (1992), Nahapiet and Ghoshal (1998) introduce the concept of network embeddedness to characterize the structure of firms’ relationship with other firms. Ruef et al. (2003) and Moran (2005) point out that network embeddedness provides access to information through the relations among firms, which generates social capital for the participating firms.
When focusing on the impact of the network embeddedness on performance, it is necessary to consider the social capital's operational mechanism behind it (Burt, 2000, Moran, 2005). Granovetter (1992) establishes the distinction of network embeddedness considering two dimensions: structural and relational embeddedness. Structural embeddedness focuses on the configuration of the network, being its key structural features connectivity, centrality and hierarchy. The second dimension is relational embeddedness, which refers to the quality of those relationships, being key facets of interpersonal trust and trustworthiness, overlapping identities, and feelings of closeness or interpersonal solidarity. Nahapiet and Ghoshal (1998) redefine the initial classification of Granovetter (1992), noting that structural embeddedness is “the impersonal configuration of linkages between people or units” (Nahapiet and Ghoshal, 1998: 244) and relational embeddedness is the “personal relations people have developed with each other through a history of interactions” (Nahapiet and Ghoshal, 1998: 244).
Our paper focuses on the structural dimension of network embeddedness (Granovetter, 1992; Nahapiet and Ghoshal, 1998; Moran, 2005) to show its effects on R&D project performance. Thus, Gulati (1995, 1998) argues that structural embeddedness highlights the informational value of the structural position of nodes in the network, while Grewal et al. (2006) emphasise the position of the node in the network, pointing out that not all positions in the network affect the firm’ performance in the same way as they provide differential access to information.
Project performance and network embeddedness
The network embeddedness of projects and partners affects the project performance through the information flows generated through interactions in the network (Grenwal et al., 2006). To establish a relationship between network embeddedness and project performance, we consider two-mode affiliation networks composed of projects and partners (Faust, 1997). Following Grenwal et al. (2006) and Arranz and Arroyabe (2012), partners and projects may have different positions in the network of relationships. For this, they distinguish between three types of
positions in a network (degree, betweenness, and eigenvector centrality). Firstly, degree centrality emphasizes the quantity of information that a node can access and acquire by virtue of its interrelations (Ahuja, 2000). Thus, the degree centrality position of a project/partner determines the level of entrenchment of the project/partner with respect to the network. For example, high level of degree centrality of a project means that this project has a high number of partners. This allows the project to be highly interconnected with other projects through their partners, receiving, as consequence, a great quantity of information. Moreover, a high level of degree of partner means that the partner joins in many projects, which provides access to a greater amount of information (Borgatti and Halgin, 2011; Grenwal et al., 2006). Secondly,
betweenness centrality highlights the extent to which a node connects to other nodes (Gilsing et al., 2008; Grenwal et al., 2006). Nodes with a high betweenness play the role of connecting different groups. Gilsing et al. (2008) point out that high betweenness centrality offers opportunities for brokerage and faster access to novel information. Thus, betweenness centrality considers how a project/partner is connected with other different projects/partners; when the betweenness centrality is high, the project has access to different and new flows of information through partners who have participated in mutually unconnected projects (Gulati, 1995; Hargadon and Sutton, 1997; Gilsing and Nooteboom, 2006). Also, partners in a betweenness centrality position will participate in projects that are not interconnected, and as a consequence can receive diverse and novel information. In general, a bridging position of project/partner between two heterogeneous clusters in the network provides access to novel information and is key in developing pioneering technologies (Gilsing et al., 2016; Ahuja and Lampert, 2001). Finally, eigenvector centrality measures the extent to which a node connects to other nodes structurally embedded in the network (Borgatti and Halgin, 2011). In this position, partners closely connected to the centre of the network will be able to access information that is imbued with value, context, and meaning (Grenwal, et al., 2006; Bonacich, 1987; Faust, 1997). Uzzi (1996) points out that the information exchange in this position is enriched with the fine-grained context in terms of product–market specifics, and is geared towards joint problem-solving, highlighting the richness of the information that a firm can access through its relationships. From the technological point of view, Perez (1983) points out that the core exists because of a greater concentration of firms and projects in those technological trajectories that are more viable or
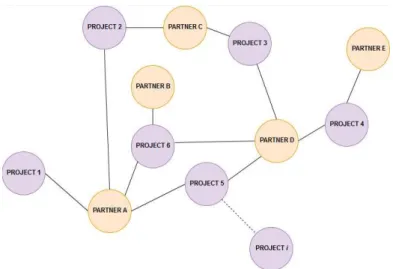
successful. Therefore, it is expected that a better project interaction with the core of the network, provides the project richness or relevant information in terms of market adequacy and technical solutions. Figure 1 shows the interactions between projects and partners.
Moreover, regarding the design of the project, technological project literature distinguishes between different types of projects depending on their aim; exploration and exploitation projects are the most common classifications (Rothaermel and Deeds, 2004; Gupta et al., 2006). The first type of R&D project, exploration, experiments with new or uncertain alternatives, while the second type, exploitation, consists of the extension and refinement of existing technologies, paradigms and competencies (March 1991). While exploration requires experimenting and searching activities to find new and emerging innovations capable of generating future sources of profits, exploitation aims at improving the returns and the efficiency from current strategies, competencies and procedures using existing information. Because of the different nature of these two projects, their completion requires the use of different types of information. Figure 2 shows the conceptual model.
Hypotheses
Network embeddedness and the performance of exploration projects
Exploration projects suppose a change in the existing dominant design in search of novel combinations. Gilsing et al. (2008) point out that from the firm’s perspective exploration projects involve the creation of technological knowledge new to the firm. Following Rothaermel and Deeds (2004), two features characterise the information in an exploration project: heterogeneity, which allows partners to access novel information; and non-redundancy, which avoids the overload of the information processing capacity and facilitates the ability to detect new alternatives.
When comparing the effects of degree and betweenness centrality on the performance of exploration projects, the influence of betweenness centrality will be more positive than that of degree centrality. Project/partners in betweenness centrality possess different kinds of information, operating in different market segments and industries, utilizing different technologies (Lavie and Rosenkoph, 2006; Gilsing et al., 2008), permitting the access to more non-redundant information (Burt, 1997), and incorporating diverse perspectives (Rothaermel and Deeds, 2004). This is in line with the information necessity of the exploration project, which
involves the creation of new technological knowledge to the firm (Gilsing, 2016). Alternatively, high levels of degree imply that project/partners have greater access to information as a consequence of the high number of contacts, and that they are exposed to large quantities of information, allowing to solve complex problems (Grenwal et al., 2006) and thus increasing the efficiency of the projects (Cohen and Levintal, 1999). However, increasing the number of contacts will increases the likelihood of attentional overload, limiting cognitive focus and saturating the information processing capacity (Koka and Prescott, 2002). Moreover, this information is not exempt of redundancies, hindering the ability to search for new alternatives (Gilsing, 2005). Therefore, we argue that in the development of exploration projects, the influence of betweenness centrality -that implies management of novel information- will be more positive than degree centrality -that implies greater access to information- since with the latter the value of the project declines due to homogeneous and redundant information, which decreases the probability of new technological knowledge. Accordingly, we propose:
Hypothesis 1a: The betweenness centrality of project/partners in a joint exploration project has a greater positive impact than degree centrality on project performance.
Regarding the effects of betweenness centrality and eigenvectorcentrality on the performance of exploration projects, the influence of eigenvector will be more positive than that of betweenness centrality. A high level of eigenvector centrality implies that project and partners are closely connected to the central core of the network. Perez (1983) conceptualized the technological trajectories, as a concentration of firms and projects, in the same technological line, which arises from the existence of a gap in the market or the adaptation of a technological solution. In contrast, as we have argued in the previous hypothesis, betweenness centrality provides access to novel information as a result of its bridging position in the network of interactions, which allows to explore possible new products or new technological solutions, in line with the informative needs of an exploration project. However, novelty management, in addition to the additional cost of absorbing such information, possesses an additional risk. Tichy (2004) and Lee et al. (2008) point out that novelty can lead to over-optimism as a result of the enthusiasm for an innovative idea rather than a clear assessment of the idea’s real value. Such enthusiasm can lead to poor decisions and can reduce the number and quality of solutions generated (Nyström, 1979; De Meza and Southey, 1996). In particular, it can be distinguished
between the different solutions that can be generated and the adequate solution (De Meza and Southey, 1996; Carsrud and Brännback, 2011). In this sense, betweenness centrality has the largest drawback in finding an adequate solution, not only in relation to the outcome of the project but also in the subsequent market acceptance of the project results. Therefore, an eigenvector centrality will be more positive in the exploration project performance, although the solutions may be less novel than in the case of betweenness centrality (Rothaermel and Deeds, 2004), it receives information about the needs of the market, identifying which technical solutions may be more appropriate and in to have a greater degree of acceptance. Therefore, we propose:
Hypothesis 1b: The eigenvector centrality of project/partners in a joint exploration project has a greater positive impact than betweenness centrality on project performance.
Additionally, we compare the effect of degree centrality and eigenvector in the joint exploration project, taking into account the previous arguments. As we have already noted, eigenvector centrality of project/partners implies relevant information in terms of market adequacy and technical solutions (Uzzi, 1996; Grewal et al. Al., 2006). Otherwise, project/partners in a degree position manage large amounts of information (Burt, 1992), as a consequence of their position in the network, which emphasizes a large number of contacts and information. However, large amounts of contacts and information might imply redundancy (Koka and Prescott, 2002), in addition to potentially saturating the processing capacity (Grenwal et al., 2006). This is in direct contradiction with the approach of the exploration project, which involves the creation of new technological knowledge to the firm (Gilsing et al., 2008). In this way, Rothaermel and Deeds (2004) point out that heterogeneity and non-redundancy are the qualities that information must possess in an exploration project.
Therefore, comparing the effect of the two types of embeddedness, it is expected that in an exploration project the influence of eigenvector centrality -that implies received relevant information in terms of market adequacy and technical solutions-, will be more positive than degree centrality, because greater access to information may saturate the processing capacity, which decreases the ability to explore new technological solutions. Hence, we can propose:
Hypothesis 1c: The eigenvector centrality of project/partners in a joint exploration project has a greater positive impact than degree centrality on project performance.
Network embeddedness and the performance of exploitation projects
An exploitation project involves using existing information to improve efficiency and returns. Exploration and exploitation projects are related to and built on each other: exploration develops into exploitation, and exploration emerges from exploitation (Rothaermel and Deeds, 2004). Thus, exploration concludes with the product development process and exploitation finalises when the innovation is on the market.
Regarding the effects of betweenness and degree centrality on the performance of exploitation projects, the influence of degree will be more positive than that of betweenness centrality. The one hand, degree centrality entails a high level of interconnection with other partners. In this way, in exploitation projects, developing an initial idea into a functioning prototype usually exceeds the capabilities of the firm, making it likely that such firm will seek the assistance of others (Bendoly et al., 2010; Hoang and Rothaermel, 2010). Thus, the interactions with others partners provide a valuable feedback on ideas or solutions (Franke and Shah, 2003; von Hippel, 2007), filtering out ideas that have no potential to become an effective solution (Fleming, 2007). Grewal et al. (2006) point out that this development process, which involves tasks such as code development, debugging, document writing, translation, and consulting can be better handled with greater resources that should lead to more technical success. Moreover, these authors explain that the complex tasks associated with innovation development can be spread over more developers, resulting in more efficient and hence higher productivity. The other hand, a betweenness position, as we have seen, provides heterogeneous contacts and consequently novel information. However, Levinthal and March (1994) point out that when efficiency is a key success factor, the novelty information could have an adverse impact on firm performance, highlighting that firms with novel information may focus exclusively on explorative projects. Moreover, Gilsing and Nooteboom (2006) emphasised that novelty management makes difficult to find technical and market solutions, increasing the uncertainty in the development of an innovative project.
Therefore, comparing the effect of the two types of embeddedness, it is expected that in an exploitation project, the influence of degree centrality -with a higher level of contacts and information will result in the efficiency of the exploitation projects-, will be more positive than
betweenness centrality, which provides uncertainty in terms of technical solutions. Accordingly, we propose:
Hypothesis 2a: The degree centrality of project/partners in a joint exploitation project has a greater positive impact than betweenness centrality on project performance.
If we compare eigenvector and betweenness centrality in exploitation projects, it should be noted that an exploitation project involves using existing information to improve efficiency and returns (March 1992; Rothaermel and Deeds, 2004). Eigenvector emphasizes the proximity to the main technological trajectories. This provides information on technical solutions and market acceptance of innovations, considering that the ultimate goal of an exploitation project is innovation. In contrast, betweenness centrality provides a novel information (Gilsing et al., 2008). However, this information is not a priority in an exploitation project (Rothaermel and Deeds, 2004), whose emphasis is on innovation and efficiency. Moreover, novel information can lead to a random drift and a continuous change of the knowledge base of a project (Fleming and Sorenson, 2001), thus harming the outcome of the project. This novel information will increase the costs of the project, as a result of the need to absorb and to exploit this information (Nooteboom et al., 2007; Gilsing et al., 2008).
Therefore, it is expected that in an exploitation project, the relevant information in terms of market adequacy and technical solutions (Uzzi, 1996; Grewal et al. Al., 2006) have a greater impact on the project performance than the novel information, taking into account that the objective of such projects is the introduction of innovations in the market. Accordingly, we propose:
Hypothesis 2b: The eigenvector centrality of project/partners in a joint exploitation project has a greater positive impact than betweenness centrality on project performance.
Regarding the last case, the comparison of eigenvector and degree centrality, it is important to note that the objective of an exploitation project concludes with the product in the market; therefore, in this type of project, besides the information that proposes technical solutions, the adequacy by the market of the product is also critical (Rothaermel and Deeds, 2004). The eigenvector position of projects/partners provide an adequate and relevant information in terms of market innovation, for its proximity to the main technological trajectories, while degree centrality emphasizes the amount of information and contacts of the projects/partners. However,
establishing and maintaining contacts requires time and effort (Koka and Prescott, 2002; Grenwal et al., 2006) and increasing the number of contacts will raise the likelihood of attentional overload (Burt, 1992, Shalley, 1995). Therefore, it is expected that a greater richness of information has a greater effect on the performance of an exploitation project, as opposed to receiving a large amount of information in a degree position, having the disadvantages of redundancies, and the problems of saturation of the processing capacity, which can cause the received information not to be analyzed correctly. In this sense, the eigenvector centrality offers advantages versus degree centrality in the case of exploitation projects. Hence, we can propose:
Hypothesis 2c: The eigenvector centrality of project/partners in a joint exploitation project has a greater positive impact than degree centrality on project performance.
Methods
Data
To evaluate the effect of network embeddedness on joint R&D project performance, we use data extracted from a database built up in the context of wider research on R&D projects developed within 6th Framework (2002-2006) and 7th Framework (2007-2013) EU Programs.
The data was collected in 2013, classifying the projects into two types: exploration and exploitation projects. Exploration projects involve new lines of business (Liu et al., 2009); they focus on the ‘R’ in the research and development process. Gupta et al. (2006), Lavie and Rosenkopf (2006), and March (1991) define it as search, variation, risk-taking, experimentation, play, flexibility, discovery, or innovation. Exploitation projects, on the other hand, are associated with standardization, routinisation, and systematic cost reduction, the increase in productivity of employed capital and assets, and the improvement and refinement of existing capabilities and technologies (Koza and Lewin, 1998; Rothaermel and Deeds, 2004). It focuses on the ‘D’ in the research and development process, and it is defined by March (1991) and Lavie and Rosenkopf (2006) as refinement, choice, production, efficiency, selection, implementation, or execution. It is observed from the results that exploration projects are composed of a greater number of partners (mean: 5.8) as compared to exploitation projects (mean: 4.4).
The procedure used for developing the sample is referred to as the nominalist approach and it is frequently applied in related research studies (e.g., Wasserman and Faust, 1999). Following the Framework Programs (FP) classification, our analysis is restricted to information and communication technologies for the first time. However, we observed that many of the projects and partners were connected to another FP area, such as nanoscience, nanotechnologies, materials and new production. Therefore, we focused on projects and partners from both areas. This choice is in line with previous literature, which has paid a significant attention to these sectors because of their dynamism and the funds received by public administrations (Veugelers, 2012; Rohman, 2013), and reduces the dispersion of the projects, facilitating the greatest possible interconnection between them (Grenwal et al., 2006)1.
Initially, we start with both exploration and exploitation projects, and we identify their partners, and then continue by analysing which projects they are involved in. Thus, following the methodology proposed by Wasserman and Faust (1999), we constructed two affiliation matrices. Then, we conducted an Internet and phone survey of project managers with the aim of getting information about the results of the projects. We obtained responses in more than 90% of the cases; therefore, we obtained the first matrix for exploration projects with 98 rows (projects) and 530 columns (partners), and a second affiliation matrix for exploitation projects with 183 rows (projects) and 622 columns (partners).
Measures
Independent variables
To capture the network embeddedness of projects and partners we consider two-mode affiliation networks (Faust, 1997), which allow to study the dual perspective of the project and the partner. We consider an affiliation network A in which the rows represent partners and the columns represent the projects, with the value 1 when a partner belongs to a project, and 0 otherwise (AT is the transpose matrix). Thus, we obtain the valued matrices for partners (XPt) and
projects (XPj) as:
• XPt = AAT, is the network matrix of the partners with 530x530 (exploration) and
622x622 (exploitation).
• XPj = ATA is the network matrix of the projects with 98x98 (exploration) and
183x183 (exploitation).
We characterize the dimensions of network embeddedness project/partners with diverse measures of centrality. For the first type of embeddedness, we follow Grewal et al. (2006) and we use degree centrality. Degree centrality assesses the number of links that each node has. As Freeman (1979) suggests, we use the normalized version of degree centrality, obtained by dividing the node degree of each project/partner, by the maximum possible number of links. The domain of the score is [0, 1], 0 representing no relations and 1, relations with all projects/partners in the network.
To calculate the betweenness centrality of the project/partners, that is, the shortest path between two projects/partners, Freeman (1979) proposes a two-step procedure. First, by calculating the ‘partial betweenness’ of projects/partners, i.e., the number of pairs of projects/partners whose geodesic paths contain the project/partner; and second using this partial betweenness to calculate project/partner betweenness.
Eigenvector centrality, we resort to an indicator that considers the characteristics of a node’s neighbour to determine the centrality, i.e., it measures whether a project/partner is connected to projects/partners that are well embedded in the network. Introduced by Bonacich (1987), eigenvector centrality examines the values of the first eigenvector of the network’s adjacency matrix. The scores contained in this vector are derived from the centrality of the nodes to which a particular project or firm is connected, that is, the centrality of a node is proportional to the sum of the centralities of the nodes it is linked to. Under the definition of eigenvector centrality, central nodes are those which are connected to many nodes, and those, in turn also connected to many others (Newman, 2003, 2010).
Dependent variable
Project performance in Joint R&D projects
The data for the dependent variable, project performance, rely on a set of surveys conducted on project managers. Specifically, following Nelson (2005), Shenhar et al. (2001), Atkinson (1999) and Pinto et al. (1993), we conceptualized project performance as a measure of perception intended to capture the satisfaction of each of the partners involved in the R&D project. Hence, to evaluate this variable, we used a perception measure of joint performance whose inputs are the
levels of achievement on all of the relevant attributes of the project: results, time, and budget. The technological results are measured as the adequacy of the technical solution to the necessity of the companies or the market (Hagedoorn et al., 2000; Bendoly, 2014). Since the joint project is organised in function of the time and with a budget, the project performance measure includes the perception of the time of execution of the project and the fitting of the costs to the initial budget. To form this variable, following Nelson (2005), Shenhar et al. (2001), Atkinson (1999) and Pinto et al. (1993), we asked project managers in each joint R&D project about their perceptions of project performance through three items: (1) The extent to which the partners were satisfied with the overall results of the project; (2) The partners’ satisfaction with respect to the project schedule; and (3) The extent to which the partners were satisfied with the financial performance of the joint project. These variables range from 7 if maximum joint performance is perceived by the partner and the opposite if the value is near to 1.
Control variables
The first control variable is the density of the network. The density of the network is the number of existing ties in the ego network divided by the total possible number of ties in the network (Borgatti and Foster, 2003). The scale ranges from 0 (sparse network) to 1 (dense network).
The second control variable is technological distance, understood as a dimension of the cognitive distance among partners (Wuyts et al, 2005; Gilsing et al, 2008). These authors measure technological distance as the Pearson correlation index of the distribution across technological classes of the revealed technological advantages (RTA) of each partner. We compute the pairwise correlation coefficient between the RTA profile of the partner and each of its partners; we then calculate the CRTA variable as the average of these correlations. The values for CRTA range from -1 to 1.
The third control variable is the experience of the company in the developing joint projects
(Reuer and Ariño, 2007; Bendoly et al., 2010). We operationalized this knowledge with reference to the previous three years by one item scale that measures the experience in joint projects. Respondents evaluate the extent of their experience in relation to the statement given; where 1 represents the lowest level, and 7 represent the highest level.
The fourth control variable is the age of projects, measured by the duration of the projects (in months) (Poppo and Zenger, 2002). With this variable, we tried to explain how the duration of the project influences the governance of the network and the performance.
The next control variable is R&D investment of partners. As pointed out by Cohen and Levinthal (1990, p. 128), the capacity to evaluate and use external know-how is largely a function of prior related knowledge. These authors note that such prior knowledge arises as a by-product of partners carrying out their own R&D activities. We measure the innovation effort as the ratio between spending on R&D and the volume of sales (Cohen and Levinthal, 1990; Tsai, 2001). We constructed the variable R&D investment of the partners using data on R&D expenditures and unit sales, obtained through internal corporate records and taking the average of the last five years (2008-2012) per partner. With these measures, we obtained the arithmetic mean by partner and then the arithmetic mean by the project. From this measure, we derive another control variable, the dispersion of R&D investment of the partners by taking the standard deviation of the R&D investment for each project.
We have also included as control variables the size of the project and the size of the partner. For the first, we consider the number of partners that make up the project. In the second case, the size of the partner is measured by the number of employees (log) engaged in the firm's activities.
Econometric model
To test the research questions we use a linear regression model that allows to analyse the joint effect of independent variables (network embeddedness positions) and to compare this effect on the dependent variable (project performance)2. In our analysis, we follow previous works from
Poppo and Zenger (2002) and Liu et al. (2006) that analyse the comparative effects of governance modes in the performance, and specifically the analysis of Grewal et al. (2006) that study the impact of centrality measures in the project performance. The dependent variable is a continuous variable that was created as a construct of the three items that measure managers’ perceived satisfaction (results, time and budget). The method used is a Factor analysis with Varimax rotation (KMO: 0.801; sign. .000). The Cronbach’s alpha reported is 0.703, which implies a high level of correlation among the three items. We also have checked for the
2 Other type of analysis, for example ANOVA, which allows comparing the effect of centrality measures on the performance, is unfeasible since the measures of centrality are not dummy variables.
robustness of the regression model, performing a collinearity test (VIF: all independent variables have values less 2.5) and autocorrelation test (Durbin-Watson, all values 1.5<X< 2.5).
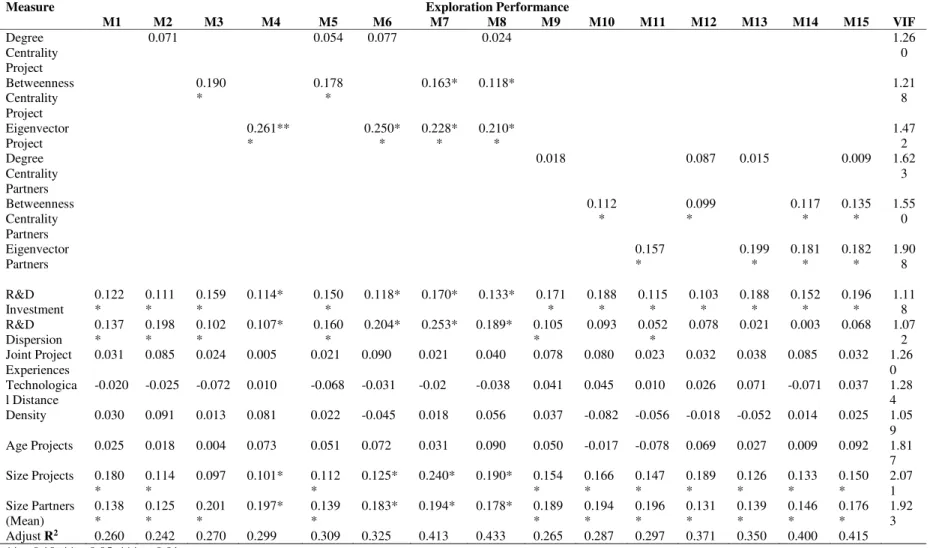
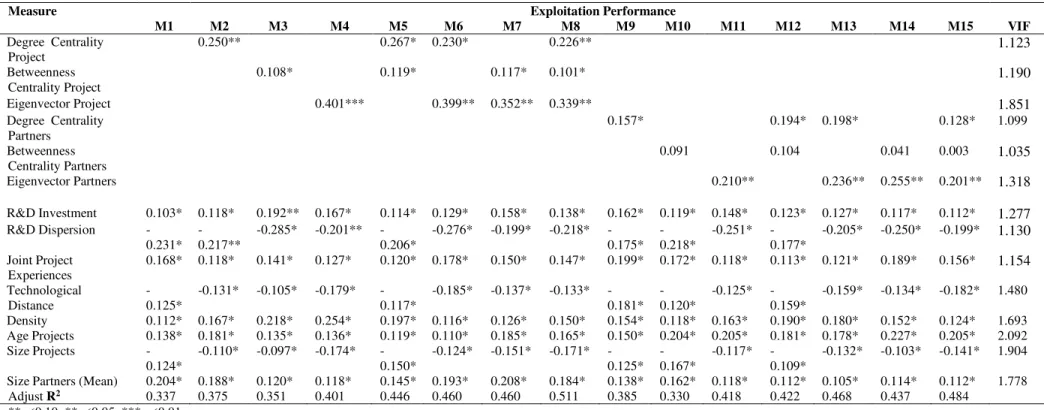
In Tables 2 and 3, Model 1 is the basic model, Models 2 to 4 show the relationship between dependent variables (project performance) and the three independent variables (project centrality positions), and the eight control variables, for exploration and exploitation projects. Models 5 to 8 compare the effect of the independent variables on exploration project performance (Table 2). For it, following Liu et al. (2009), we test the impact of the three centrality measures in the case of projects comparing the proportion of variance explained by the different centrality measures. Also, in Tables 2 and 3, we repeat the same analysis to compare the effect of partner centrality measures in the exploitation project performance, Models 9 to 15.
Results
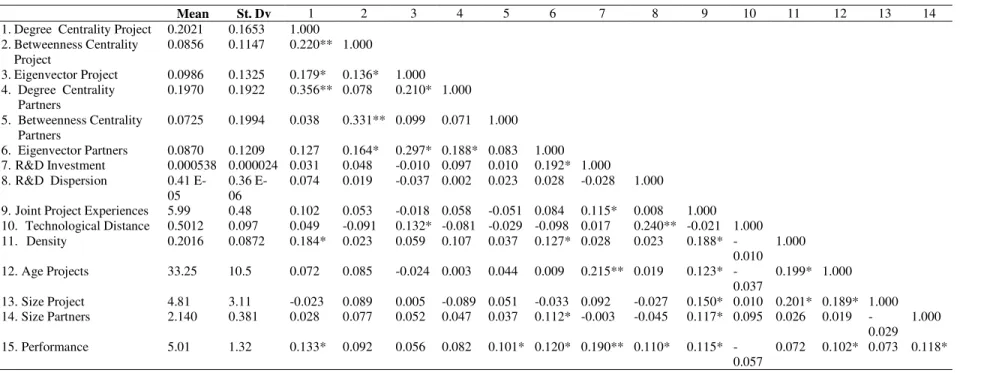
Table 1 presents the descriptive statistics and correlations for all the variables used in this study; Tables 2 and 3 report the regression results.
Regarding exploration projects (Table 2), the results of Models 3 and 4 show a positive relationship in the case of two of the three individual measures of projects’ centrality and project performance: betweenness centrality of the project (ß=0.190; p< 0.10), and eigenvector centrality of the projects (ß=0.261; p< 0.01). Also, Models 10 and 11 show similar results in the case of partners’ centrality and project performance: betweenness centrality of the partners (ß=0.112; p< 0.10), and eigenvector centrality of the partners (ß=0.157; p< 0.10). However, there is a non-significant relation between degree centrality of project/partners and project performance. To corroborate or refute the hypotheses, we used a critical test for analysing these relationships (Liu et al., 2009). We use the proportion of variance explained by the significant variables subtracting the Adjusted R2.
Regarding Hypothesis 1a, the results show that degree centrality of project/partners are not significant in the performance of exploration projects, whereas betweenness centrality is significant. Additionally, to further test the above relative predicting power, we analysed the proportion of variance of project performance explained by degree centrality and betweenness centrality of project/partners. We then obtain the proportion of variance of project performance explained by betweenness centrality of the project by subtracting the Adjusted R2 of both models
(Model 5 and Model 2): ΔAdj.R2
Model5-Model2= 0.309 - 0.242 = 0.067. Secondly, we calculate the
proportion of variance explained by degree centrality of the project (Model 5 and Model 3): ΔAdj.R2
Model5-Model3= 0.309 - 0.270 = 0.039. To check which of the two types of centrality
measures of the project has a greater impact on project performance, we compared ΔAdj.R2 Model5-Model2 and ΔAdj.R2Model5-Model3; since ΔAdj.R2Model5-Model2>ΔAdj.R2Model5-Model3, we can conclude
that betweenness centrality of the project is statistically stronger in the impact on project performance than degree centrality of the project. Making a similar analysis in the case of partners, we can confirm that betweenness centrality of the partners is statistically stronger that degree centrality of partners (ΔAdj.R2
Model12-Model9 >Δ Adj.R2Model 12-Model10). These results support
Hypothesis 1a both in the case of projects and partners.
In the case of Hypothesis 1b, we compare whether eigenvector centrality of the project has a greater impact than betweenness centrality of the project in explaining project performance. Making a similar analysis that in the previous case, the results obtained allow supporting Hypothesis 1b since the explained variance by eigenvector centrality both in the case of projects (ΔAdj.R2
Model7-Model3>ΔAdj.R2Model7-Model4) and partners (ΔAdj.R2Model14-Model10>ΔAdj.R2 Model14-Model11) is greater than betweenness centrality for both positions.
Regarding Hypothesis 1c, our results show that eigenvector centrality of project and partner have a significant effect, while degree centrality of project and partner are not significant on the project performance. Since the explained variance by eigenvector centrality, both in the case of projects (ΔAdj.R2
Model6-Model2>ΔAdj.R2Model6-Model4) and partners (ΔAdj.R2Model13-Model9>
ΔAdj.R2
Mode13-Model11), is greater than degree centrality for both positions, these results support
Hypothesis 1c.
In the case of exploitation projects (Table 3), we find a positive and significant relationship between degree centrality and eigenvector centrality for project/partners and the joint project performance. However, while betweenness centrality of the project shows a positive and significant relationship with the performance of exploitation projects, this is not the case of betweenness centrality of partners. We calculated the proportion of variance explained by the significant variables to confirm or refute the hypotheses.
As regards to Hypothesis 2a, we found that degree centrality of the projects has a higher impact on project performance than betweenness centrality of the project (Models 2 and 3).
These results confirm Hypothesis 2a, taking into account that betweenness centrality of the partners is not significant (Model 10), while degree centrality of the partners is significant (Model 9). We checked the effect of these variables on the exploitation project performance through the explained variances by each variable. The results obtained from de analysis of Models 2, 3, and 5 (for centrality of projects) and Models 9, 10 and 12 (for centrality of partners) allow supporting the Hypothesis 2a since the explained variance by degree centrality both in the case of projects (ΔAdj.R2Model5-Model3>ΔAdj.R2Model5-Model2) and partners (ΔAdj.R2 Model12-Model10>ΔAdj.R2Mode12-Model9) is greater than betweenness centrality for both positions.
Concerning the Hypothesis 2b, our results show that betweenness centrality of partners has not a significant impact on exploitation projects performance (Models 10, 11 and 14), and that eigenvector centrality of projects has a higher impact on project performance than betweenness centrality of the project (Models 3, 4 and 7). To check which of the two centrality measures is statistically stronger we compared the ΔAdj.R2 in these models, obtaining that for projects
(ΔAdj.R2
Model7-Model3>ΔAdj.R2Mode17-Model4) and for partners (ΔAdj.R2Model14-Model10>
ΔAdj.R2
Mode114-Model11). These results support Hypothesis 2b since the explained variance by
eigenvector centrality is greater than betweenness centrality both for projects and partners. In the case of Hypothesis 2c, the outcomes display that the eigenvector centrality of the projects (Models 2, 4 and 6) and partners (Models 9, 11 and 13) have a higher impact on project performance than degree centrality of projects and partners. Like in the previous hypothesis we compared the proportion of variance explained by these models for projects (ΔAdj.R2
Model6-Model2
> ΔAdj.R2
Mode16-Model4) and partners (ΔAdj.R2Model13-Model9 > ΔAdj.R2Mode113-Model11), confirming
Hypothesis 2c: eigenvector centrality of projects/partners is statistically stronger than degree centrality in explaining exploitation project performance.
Discussion and Conclusion
Discussion
The overall aim of this study was to investigate the impact of network embeddedness in the exploration and exploitation of joint R&D projects. Joint projects are imbued in a network of relationships formed by partners and projects, such that the partners interact with other parties when participating in various projects, and the projects interact with other projects because they
share partners. From a structuralist approach, we consider that a project and a partner can occupy different positions in the structure of the network, and as a consequence, receive different types of information.
First, we provide empirical evidence on the effect that structural embeddedness has on performance (Granovetter, 1992, Moran, 2005). Thus, our results show how the position of projects and partners affects the performance of the project, confirming the hypothesis of Gulati (1998) and Grewal et al. (2006) about the value of the actor's position in the network. Additionally, our findings are consistent with previous studies, which support the importance of network embeddedness in the innovation process (Gilsing, 2016), and confirm that a central position in the network is a key factor to develop technological projects (Grewal et al., 2006; Gilsing, 2016).
Second, our results reveal differences in the impact that centrality positions have on project performance, confirming the hypothesis of Grewal et al. (2006), which indicates that different central positions in a project network have a differential impact on the project performance. Our results provide empirical evidence of what Moran (2005), pointed out when highlighting the need for establishing a relationship between network position and type of project developed, contributing to the debate about which is the adequate position in the network, and its impact on the performance (Gargiulo and Benassi, 2000; Moran, 2005). As we have pointed out, our paper combines three central positions (degree, betweenness, and eigenvector) with the two types of projects (exploration and exploitation). Our results highlight the limitations of degree centrality position of the projects/partner in the exploration project. As we have pointed out, exploration project requires the searching activities to find new and emerging innovations capable of generating future sources of profits (Rothaermel and Deeds, 2004; Nooteboom et al., 2007; Gilsing et al., 2008); however, degree centrality saturates the processing capacity and the search for novel solutions (Gilsing, 2016), which are the fundamental objectives of the exploration projects. Otherwise, we have found a positive relationship between the eigenvector centrality of project/partner and the performance of the exploration project. This result suggests that richness of information, in terms of technical solutions and their adaptation to the market (Dosi, 1982; Rothaermel and Deeds, 2004; Nooteboom et al., 2007), benefits the performance of exploration projects. Also, betweenness centrality has a significant positive impact on the project
performance. This result is in line with the works of Gilsing (2016), which indicates how access to different kinds of information, operating in different market segments and industries, utilizing different technologies has a positive effect on the development of exploration projects. When we compare betweenness and eigenvector centrality, our results highlight that eigenvector centrality has a higher impact on the performance of exploration joint R&D projects, that betweenness centrality. This shows the need for the adequacy of technical solutions in exploration R&D projects, as opposed to access to novel information, derived from betweenness centrality, that can provide unsuitable or unapproachable solutions (Rothaermel and Deeds, 2004), and over-optimism, which can reduce the capacity of project evaluation (Carsrud and Brännback, 2011).
In the case of exploitation projects, as we have seen, their objective consists of the extension and refinement of existing technologies, paradigms and competencies, emphasizing the efficiency of the project (March 1990, Rothaermel and Deeds, 2004). Our results suggest that, in exploitation projects, the quantity of information may be more beneficial than the novel information. Thus, the quantity of information to solve complex tasks (Grenwal et al., 2006) and to search for technical solutions (Levinthal, 1994) is perceived in this type of project as more significant. First, our work corroborates the hypothesis of Gilsing (2016) of the inadequacy of a bridge position between non-connected clustering and reinforces the argument put forward by Fleming and Sorenson (2001) that the novel information can lead to a random drift and continuous change of the knowledge base of a project. Second, when comparing the contribution of eigenvector and degree centrality in the exploitation project performance, we show that the influence of eigenvector centrality on project/partners performance will be more positive than degree centrality. These results corroborate the hypothesis of Perez (1983), that a better position on the main technological trajectory, has a greater effect on the performance of innovation project than the indiscriminate amount of information.
Conclusion
As conclusion, our study extends the current literature on joint R&D projects and improves our understanding of it. First, it extends the project management literature, showing empirical evidence on the performance of joint R&D projects. Our contribution shows the importance of the position of a project in the projects/partners network on the performance of joint R&D projects. Moreover, our research fills the gap in the literature by explaining that not only the
position of the project in the network of relationships but also the position of the partner, has a significant effect on the performance of the project. We found that each of the centralities have a differential effect on project performance, where eigenvector centrality gives a greater impact on the performance of both exploration and exploitation projects. Eigenvector centrality favours the richness of information, as well as the relationship between information and technology, which provides technical and marketing solutions. These results increase our understanding of project management since they include the effect that the acquisition of external knowledge has on the performance of the project. Moreover, our study is in line with the stream of literature that calls for the development of integrative models, which account for the complex, multi-dimensional nature of projects (Scott-Young and Samson, 2008).
Second, we extend the social capital theory by analysing the impact of network embeddedness on projects, taking into account the different objectives of joint R&D projects. We include the permeability of projects through the partner, confirming the contribution of Grewal et al. (2006), and extending the contingency characteristic of the received information. Consistent with the social capital theory, our results corroborate that project embeddedness has a differential impact on the performance of exploration and exploitation projects, which supports the contingency nature of the network embeddedness. From an empirical point of view, our analysis offers evidence regarding the performance implications of the eigenvector, degree and betweenness centrality on R&D projects. Although previous research has highlighted the positive contribution of network embeddedness to the performance of partnership relations, our results suggest a need to explore more carefully the exploration/exploitation nature of projects to predict the effect of network embeddedness on project performance.
From a managerial point of view, our paper contributes firstly to the joint project literature (Bendoly et al., 2014), showing the effects of project configuration in the R&D performance from the structural perspective of networks. Thus, the partner selection and negotiation of agreements entail important decisions for firms' managers that are traditionally explained in the framework of resources and capabilities of partners (see for example Miotti and Sachwald, 2003). While aspects such as the technological intensity, the membership to a group or the geographical location, among others, are widely explored in order to identify the profile of the possible partner with which to participate, our paper shows another criterion based on the
embeddedness of the partner/project, revealing the effects of degree, eigenvector and betweenness centrality on project performance. Thus, our results provide other selection criteria of the partner/project in function of their access to information as a consequence of their position in the network. This aspect complements the classic factors of partner selection and sheds light on the contingent nature of network embeddedness. Secondly, analysing separately exploration and exploitation projects, which is especially important in the context of the R&D process (Rothaermel and Deeds, 2004; Hoang and Rothaermel, 2010), we emphasize the different components of the R&D activity chain. Maximizing the partner/projects' outcomes from an R&D network requires that managers recognize that the different types of R&D projects are influenced not only by the expected potential results but also by its network position.
Finally, like any other, our study is not free from limitations. While the theoretical mechanisms underlying our hypotheses point out towards a causal relation from network embeddedness to project performance, a conservative reader should interpret the results as associations rather than as causal effects, since the effects analysed occur in an endogenous system of strategic choices (firms selectively decide to enter a project and the partners). Furthermore, we recognise that the results provide weak support for some hypotheses because of the low significance level of some variables, p<0.10.
References
Agostini, L. and Nosella, A. (2017). ‘Inter-organizational relationships involving SMEs: A bibliographic investigation into the state of the art’. Long Range Planning,
https://www.sciencedirect.com/science/article/pii/S0024630117305083.
Almirall, E. and R. Casadesus-Masanell (2010). ‘Open versus closed innovation: A model of discovery and divergence’. Academy of Management Review, 35(1), pp. 27–47.
Ariño, A., J. Torre and P.S. Ring (2005). ‘Relational Quality and Inter-personal Trust in Strategic Alliances’, European Management Review, 2(1), pp.15-27.
Arranz, N. and Fernandez de Arroyabe, J.C. (2012). ‘Effect of Formal Contracts, Relational Norms and Trust on Performance of Joint Research and Development Projects’. British Journal Management, 23, pp. 575–588.
Arranz, N. and Fernandez de Arroyabe, J.C. (2013). ‘Network Embeddedness and Performance of Joint R&D Projects’. In Network Governance (pp. 33-50). Physica, Berlin, Heidelberg. Arroyabe, M. F., Arranz, N., and Fernandez de Arroyabe, J.C. (2015). ‘R&D partnerships: An
exploratory approach to the role of structural variables in joint project performance’.
Technological Forecasting and Social Change, 90, pp. 623-634.
Atkinson, R. (1999). ‘Project management: cost, time and quality, two best guesses and a phenomenon, its time to accept other success criteria’. International Journal of Project Management, 17(6), pp. 337–342.
Atuahene-Gima, K. (2003). ‘The Effects of Centrifugal and Centripetal Forces on Products Development Speed and Quality: How does Problem Solving Matter?’. Academy of Management Journal, 46, pp. 359-373.
Bendoly, E., M. Swink and W.P. Simpson (2014). ‘Prioritizing and Monitoring Concurrent Project Work: Effects on Switching Behavior’. Production and Operations Management, 23, pp. 847–860.
Bendoly, E., J.E. Perry-Smith and D.E. Bachrach (2010). ‘The perception of difficulty in project-work planning and its impact on resource sharing’. Journal of Operations Management, 28(5), pp. 385-397.
Bonacich, P.B. (1987). ‘Power and centrality: a family of measures’. American Journal of Sociology, 92, pp. 1170–1182.
Borgatti, S.P. and P.C. Foster (2003). ‘The network paradigm in organizational research: a review and typology. Journal Management 29, pp. 991–1013.
Borgatti, S.P. and D.S. Halgin (2011). ‘On Network Theory’. Organization Science, 22(5), pp. 1168-1181.
Borgatti, S.P., M.G. Everett and L.C. Freeman (2002). Ucinet for Windows: Software for Social Network Analysis. Analytic Technologies, Harvard.
Bouncken, R. B. (2011). ‘Innovation by Operating Practices in Project Alliances – When Size Matters’. British Journal of Management, 22, pp. 586–608.
Brown, J. S. and Duguid, P. (2001). ‘Knowledge and organization: A social-practice perspective’. Organization Science, 12(2), 198-213.
Burt, R.S. (1992). Structural holes: The social structure of competition. Harvard University Press, Cambridge, MA.
Burt, R.S. (2004). ‘Structural holes and good ideas’. American Journal of Sociology, 110 (2), pp. 349–399.
Carsrud, A., Brännback, M. (2011). ‘Entrepreneurial motivations: what do we still need to know?’. Journal of Small Business Management, 49, 9–26.
Cassiman, B. and R. Veugelers (2006). ‘In search of complementarity in innovation strategy: Internal R&D and external knowledge acquisition’. Management Science, 52, pp. 68–82. Chesbrough, H., W. Vanhaverbeke and J. West (Eds.) (2006). Open innovation: Researching a
new paradigm. Oxford University Press, Oxford, UK.
Chiaroni, D., V. Chiesa and F. Frattini (2010). ‘Unravelling the process from closed to open innovation: Evidence from mature, asset-intensive industries’. R&D Management, 40(3), pp. 222–245.
Cohen, W.M. and D.A. Levinthal (1990). ‘Absorptive capacity: A new perspective on learning and innovation’. Administrative Science Quarterly, 35, pp. 128–152.
Coleman, J.S. (1988). ‘Social capital in the creation of human capital’. American Journal of Sociology, 94, pp. 95-120.
Cuevas-Rodríguez, G., Cabello-Medina, C. and Carmona-Lavado, A. (2014). ‘Internal and External Social Capital for Radical Product Innovation: Do They Always Work Well Together?’. British Journal of Management, 25, pp. 266–284.
De Meza, D. and Southey, C. (1996). ‘The borrower's curse: optimism, finance and entrepreneurship’. Economic Journal, 106, 375–386.
Dosi, G. (1982). ‘Technological paradigms and technological trajectories’. Research Policy, 11(3), 11(3), pp. 147–162.
Eisenhardt, K. M. and J.A. Martin (2000). ‘Dynamic capabilities: What are they?’. Strategic Management Journal, 21, pp. 1105–1121.
Eisenhardt, K.M. and C.B. Schoonhoven (1996). ‘Resource-based view of strategic alliance formation: Strategic and social effects in entrepreneurial firms’. Organization Science, 7(2), pp. 136-150.
Fleming, L., Mingo, S. and Chen, D. (2007). ‘Collaborative brokerage, generative creativity, and creative success’. Administrative Science Quarterly, 52(3), 443-475.
Fleming, L. and Sorenson, O. (2001). ‘Technology as a complex adaptive system: evidence from patent data’. Research Policy, 30(7), 1019-1039.
Franke, N. and Shah, S. (2003). ‘How communities support innovative activities: an exploration of assistance and sharing among end-users’. Research Policy, 32(1), 157-178.
Freeman, L.C. (1979). ‘Centrality in social networks: Conceptual clarification’. Social Networks, 1, pp. 215-239.
Gilsing V, B. Nooteboom, W. Vanhaverbeke, G. Duysters and A. van den Oord (2008). ‘Network Embeddedness and the Exploration of Novel Technologies: Technological Distance, Betweenness Centrality and Density’. Research Policy, 37, pp. 1717-1731.
Gilsing, V.A. (2005). The Dynamics of Innovation and Interfirm Networks: Exploration, Exploitation and Co-evolution. Edward Elgar, Cheltenham.
Gilsing, V.A. and B. Nooteboom (2005). ‘Density and strength of ties in innovation networks, an analysis of multimedia and biotechnology’. European Management Review, 2, pp. 179–197. Gilsing, V.A. and B. Nooteboom (2006). ‘Exploration and exploitation in biotechnology’.
Research Policy, 35, pp. 1-23.
Gnyawali, D. R. and Madhavan, R. (2001). ‘Cooperative networks and competitive dynamics: A structural embeddedness perspective’. Academy of Management Review, 26(3), 431-445.
Granovetter, M. (1973). ‘The Strength of Weak Ties’. American Journal of Sociology, 78, pp. 1360-1380.
Granovetter, M. (1985). ‘Economic action and social structure: The problem of embeddedness’.
American Sociological Review, 15, pp. 478-499.
Grewal R, G. Lilien and G. Mallapragada (2006). ‘Location, Location, Location: How Network Embeddedness Affects Project Success in Open Source Systems’. Management Science, 52, pp. 1043-1056.
Gulati, R. (1995). ‘Social structure and alliance formation pattern: a longitudinal analysis’.
Administrative Science Quarterly, 40, pp. 619-642.
Gulati, R. (1998). ‘Alliances and network’. Strategic Management Journal, 19, pp. 293-317. Gulati, R. and M. Gargiulo (1999). ‘Where do interorganizacional networks come from?’.
American Journal of Sociology, 104, pp. 1439-1493.
Gulati R., N. Nohria and A. Zaheer (2000). ‘Strategic Networks’, Strategic Management Journal, 21(3), pp. 203-215.
Gupta, A. K., K.G. Smith and C.E. Shalley (2006). ‘The interplay between exploration and exploitation’. Academy of Management Journal, 49, pp. 693–706.
Hagedoorn, J., A. Link and N. Vonortas (2000). ‘Research partnerships’. Research Policy, 29, pp. 567-586.
Hargadon, J. and R. Sutton (1997). ‘Technology Brokering and Innovation in a Product Development Firm’. Administrative Science Quarterly, 42, pp. 716-749.
Henderson, R. M. and I. Cockburn (1994). ‘Measuring Competence? Exploring firm effects in pharmaceutical research’, Strategic Management Journal, 15, pp. 63–84.
Hoang, H. A., and Rothaermel, F. T. (2010). ‘Leveraging internal and external experience: exploration, exploitation, and R&D project performance’. Strategic Management Journal, 31(7), pp. 734-758.
Koka, B.J. and J.E. Prescott (2002). ‘Strategic alliances as social capital: a multidimensional view’. Strategic Management Journal 23: 795-816.
Koza M.P. and A. Y. Lewin (1998). ‘The co-evolution of strategic alliances’. Organization Science, 9(3), pp. 255–264.
Lavie D. and L. Rosenkoph (2006). ‘Balancing exploration and exploitation in alliance formation’. Academy Management Journal, 49(4), pp. 797-818.
Lee, J. Y., M. Swink and T. Pandejpong (2011). ‘The Roles of Worker Expertise, Information Sharing Quality, and Psychological Safety in Manufacturing Process Innovation: An Intellectual Capital Perspective’. Production and Operations Management, 20, pp. 556–570. Lee, B., O'Brien, J. and Sivaramakrishnan, K. (2008). ‘An analysis of financial analysts'
optimism in long-term growth forecasts’. The Journal of Behavioral Finance, 9(3), 171-184. Liu Y, Y. Luo and T. Liu (2009). ‘Governing Buyer-Supplier Relationships through
Transactional and Relational Mechanism: Evidence from China’. Journal of Operations Management 27, pp. 294-309.
Maltz, E. and Kohli, A. K. (1996). ‘Market intelligence dissemination across functional boundaries’. Journal of Marketing Research, 47-61.
March, J.G. (1991). ‘Exploration and exploitation in organizational learning’. Organization Science, 2, pp. 71-87.
Meyer, Ch. (1994). ‘How right measures help teams excel’. Harvard Business Review, 72, pp. 95-103.
Miotti, L. and F. Sachwald (2003). ‘Co-operative R&D: why and with whom? An integrated framework of analysis’. Research Policy, 32, pp. 1481-1499.
Mitsuhashi, H., and Min, J. (2016). ‘Embedded networks and suboptimal resource matching in alliance formations’. British Journal of Management, 27(2), pp. 287-303.
Moran, P. (2005). ‘Structural vs. relational embeddedness: social capital and managerial performance’. Strategic Management Journal, 26, pp. 1129-1151.
Nahapiet, J. and S. Ghoshal (1998). ‘Social capital, intellectual capital, and the organizational advantage’. Academy of Management Review, 23, pp. 242-266.
Nelson, R. R. (2005). ‘Project retrospectives: Evaluating project success, failure and everything in between’. MIS Quarterly Executive, 4(3), pp. 361–372.
Newman, M. E. J. (2003). ‘The structure and function of complex networks’. SIAM Review, 45, pp.167–256.
Ning, Y. (2014). ‘Quantitative effects of drivers and barriers on networking strategies in public construction projects’. International Journal of Project Management, 32(2), pp. 286-297. Nooteboom, B., W. Vanhaverbeke, G. Duysters, V. Gilsing and A. van den Oord (2007).
‘Optimal cognitive distance and absorptive capacity’. Research Policy, 36, pp. 1016–1034. Nyström, H. (1979). Creativity and innovation. John Wiley & Sons Inc.
Pek-Hooi. S. and E.B. Roberts (2005). ‘Technology alliances and networks: an external link to research capability’. IEEE Transactions on Engineering Management, 52, pp. 419-428. Pennings, H. and F. Harianto (1992). ‘Technology networking and innovation implementation’.
Organization Science, 3, pp. 356–382.
Perez, C. (1983). ‘Structural change and assimilation of new technologies in the economic and social systems’. Futures, 15(5), pp. 357–375.
Perry-Smith, J. E.and Shalley, C. E. (2003). ‘The social side of creativity: A static and dynamic social network perspective’. Academy of Management Review, 28(1), 89-106.
Pinto, M.B., J.K. Pinto and J.E. Prescott (1993). ‘Antecedents and consequences of project team cross functional cooperation’. Management Science 39, pp. 1281-1297.
Poppo, L. and T. Zenger (2002). ‘Do Formal Contracts and Relational Governance Function as Substitutes or Complements?’ Strategic Management Journal, 23, pp. 707-725.
Prahalad, C.K. and R.A. Bettis (1986). ‘The dominant logic: a new linkage between diversity and performance’. Strategic Management Journal, 7(6), pp. 485–501.
Raghunathan, R. and Pham, M. T. (1999). ‘All negative moods are not equal: Motivational influences of anxiety and sadness on decision making’. Organizational Behavior and Human Decision Processes, 79(1), 56-77
Reuer, J. and A. Ariño (2007). ‘Strategic Alliance Contracts: Dimensions and Determinants of Contractual Complexity’, Strategic Management Journal, 28(3), pp. 313-330.
Rosa, J.A., J.F. Porac, J. Runser-Spanjol and M.S. Saxon (1999). ‘Sociocognitive dynamics in a product market’. Journal of Marketing, 63, pp. 64-77.
Rothaermel, F. and D. Deeds (2004). ‘Exploration and Exploitation Alliances in Biotechnology: A System of New Product Development’. Strategic Management Journal, 25, pp. 201-221. Ruef, M., H.E. Aldrich and N.M. Carter (2003). ‘The structure of founding teams: Homophily,
strong ties, and isolation among U.S. entrepreneurs’. American Sociological Review, 68, pp. 195-222.
Sarin S. and V. Mahajan (2001). ‘The effect of reward structures on the performance of cross-fu