Public Health
Authors: Patrick Kinney,1,2 Perry Sheffield,3 Richard S. Ostfeld,4 Jessie Carr,2 Robin Leichenko,5 and Peter Vancura5 1 Sector Lead
2 Columbia University
3 Mount Sinai School of Medicine 4 Cary Institute of Ecosystem Studies 5 Rutgers University
Contents
Introduction...398
11.1 Sector Description ...398
11.1.1 New York State Public Health System...398
11.1.2 New York City Public Health System...399
11.1.3 Public Health Funding: Sources and Targets ...399
11.1.4 Emergency Preparedness...399
11.1.5 Current Health Status for Climate-sensitive Diseases...400
11.1.6 Economic Value ...402
11.2 Climate Hazards ...402
11.2.1 Temperature...402
11.2.2 Precipitation...403
11.2.3 Changing Patterns of Monthly Temperatures and Precipitation ...403
11.3 Vulnerabilities and Opportunities ...403
11.3.1 Temperature-Related Mortality ...404
11.3.2 Air Pollution and Aeroallergens...405
11.3.3 Infectious Diseases...409
11.4 Adaptation Strategies ...409
11.4.1 Key Adaptation Strategies ...410
11.4.2 Larger-scale Adaptations ...411
11.4.3 Co-benefits and Opportunities ...411
11.5 Equity and Environmental Justice Considerations ...412
11.5.1 Vulnerability ...412
11.5.2 Adaptation ...413
11.6 Conclusions ...413
11.6.1 Main Findings on Vulnerability and Opportunities ...413
11.6.2 Adaptation Options...414
11.6.3 Knowledge Gaps ...414
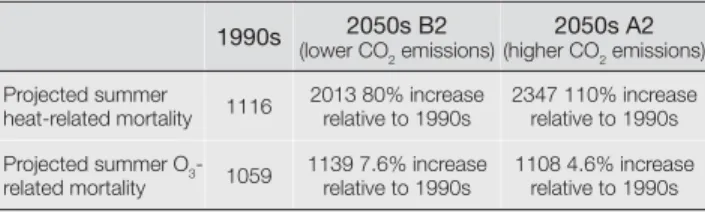
Case Study A. Heat-related Mortality among People Age 65 and Older...414
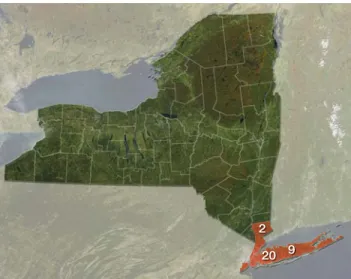
Case Study B. Ozone and Health in New York City Metropolitan Area ...420
Case Study C. Extreme Storm and Precipitation Events ...421
Case Study D. West Nile Virus...423
References ...424
Appendix A. Stakeholder Interactions ...429
Appendix B. Technical Information on Heat Wave Cost ...435
Appendix C. Annotated Heat-Mortality, Wildfires, and Air Pollution Methods References ...436
Introduction
Greenhouse gas emissions have already altered Earth’s climate, and substantial global and regional climate changes over at least the next 100 years are virtually guaranteed. This will include continued warming, along with changing patterns of floods, droughts, and other extreme events. The consequences of these climate changes for public health in New York State are likely to be dramatic, particularly for people who are more vulnerable because of age, pre-existing illness, or economic disadvantage.
A range of potential health vulnerabilities related to climate change (Confalonieri et al., 2007; CCSP, 2008) are relevant to New York State, including the following: • more heat-related deaths
• diverse consequences as a result of more intense rainfall and flooding events
• worsening air quality (due to increasing smog, wildfires, pollens, and molds) and related respiratory health impacts
• changing patterns of vector-borne and other infectious diseases
• risks to water supply, recreational water quality, and food production due to shifting precipitation patterns
The first four of these issues are the focus of this chapter, which presents both public health vulnerabilities and adaptation options available for reducing future climate-related risks. The ClimAID health assessment has been carried out through a combination of research, analysis, and interactions with relevant New York State stakeholders. The broader interdisciplinary, multi-sector ClimAID team also contributed to this sector’s work. Case studies highlight the interplay of risks and responses for key health outcomes.
11.1 Sector Description
An overview of the public health system of New York State is essential for understanding potential climate change vulnerabilities as well as opportunities for increased resilience.
11.1.1 New York State Public Health
System
The New York State public health infrastructure adheres to the Centers for Disease Control and Prevention’s (CDC’s) 10 essential public health services and core functions of assessment, policy development, and assurance of services (Figure 11.1). A diverse state, with populations spread unevenly over urban and rural service areas, New York is one of 26 states that rely primarily on a county-based system for public health service delivery (NYSPHC, 2003).
Local health departments operate under the authority of either the county legislature or local board of health. The result is a highly decentralized system with a non uniform provision of core services. For example, local health departments provide environmental health services in 37 out of New York’s 62 counties, while the State Department of Health (NYSDOH) provides service to the other areas (PHANYC, 2001). The New York State Public Health Council has identified this decentralization of public health service delivery as a key obstacle to efficient coordination of programming and data resources for climate-health preparedness. The Council has recommended regional, multi-county initiatives, which are proven models for more efficient and equitable distribution of expertise and services (NYSPHC, 2003).
Source: CDC
Figure 11.1 Core functions and 10 essential services of public health
In an effort to improve healthcare provision, in 1996 New York State initiated a data and knowledge communication program linking a wide range of partners, including hospitals, local health departments, nursing homes, diagnostic centers, laboratories, insurance provider networks, and federal agencies. Current communication networks—the Health Alert Network (state and city levels), the Health Provider Network, and the Health Information Network—are viewed as “both very helpful and very underutilized” by the Public Health Association of New York City (PHANYC, 2001). However, as a result of non-standardized data systems, the value of these networks across user groups is often compromised (PHANYC, 2001). These would be appropriate organizations to target for climate-health educational outreach and to evaluate climate-health interventions.
11.1.2 New York City Public Health System
New York City has been at the forefront of public health programming and policy since the founding of the Board of Health in 1866, the first such agency in the United States. More recently, New York City conducted the nation’s first regional Health and Nutrition Examination Survey (NYC HANES), modeled after the CDC’s National Health and Nutrition Examination Survey, providing policymakers and public health professionals with invaluable population-based health information (NYC DOHMH, 2007).
In 1995, the New York City Department of Health and Mental Hygiene (DOHMH) instituted a system of syndrome-based surveillance to locate potential disease outbreaks through ongoing monitoring of public health service use patterns and analysis for time- and location-related deviations. What started primarily as a means to detect waterborne illnesses that cause diarrhea through tracking influenza-like symptoms has evolved into electronic reporting of diverse health-related data. It now incorporates city emergency departments, pharmacy and over-the counter medication purchases, employee absenteeism, and ambulance dispatch calls (Heffernan et al., 2004). With 39 city emergency departments participating, the electronic surveillance system covered about 75 percent of annual emergency department visits in its first year of operation alone (Heffernan and Mostashari et al., 2004).
11.1.3 Public Health Funding: Sources and
Targets
Local health departments are funded by a combination of federal and state income streams and grants, complemented by fees levied through the local tax base and distributed by the State in proportion to county population. According to the Public Health Association of New York City (PHANYC), in 2001, New York City accounted for 46 percent of State aid, with the next six largest counties (Suffolk, Nassau, Erie, Westchester, Monroe, and Onondaga) receiving an additional 22 percent. Together these most-populous counties, which contain 72 percent of the state’s population, accounted for 70 percent of the State aid to local health departments (PHANYC, 2001). In the 2001 fiscal year, the New York City Department of Health and Mental Hygiene budget drew 62 percent of funding from city tax revenues (PHANYC, 2001).
There is growing concern among public health practitioners that the confluence of State budget tightening with increasing needs of emerging chronic illnesses and emergency programming may threaten provision of basic healthcare services—both climate and non-climate related (NYS ACHO, 2008). While post-September 11 federal funding for emergency preparedness programming has benefitted the entire state and many aspects of surveillance and programming, the sufficiency and security of these funds into the future is a matter of serious concern (NYSPHC, 2003). It is also important to note that the federal health care landscape is evolving in significant ways as a result of the recent passage of health care reform legislation.
11.1.4 Emergency Preparedness
Projected changes in frequency and severity of extreme weather events will call upon the emergency preparedness plans within New York State. The New York State Disaster Preparedness Commission, made up of 23 State agencies and the American Red Cross, is responsible for disaster planning as well as communications with all levels of local, state, and federal-related bodies. The attacks of September 11 highlighted both strengths and gaps in New York City’s public health infrastructure and underscored the importance of preparedness for the state in general. Immediate responses demonstrated the coordination
of multiple health agencies to quickly and effectively react to threats to the public health of the city (Rosenfield, 2002). Transfer of the Office of Emergency Management command center from the World Trade Center (a high-profile, vulnerable location) to its current location in Brooklyn was one of the lessons learned. Most important, the events made clear that investments in preparedness infrastructure benefit the daily operations and effectiveness of the public health system.
In 2002, Congress designated Centers for Disease Control and Prevention funding for nationwide capacity building and emergency response training initiatives and research through the Academic Centers for Public Health Preparedness program (Rosenfield, 2002). Columbia University in New York City was one of these centers and continues to provide valuable contributions in research and training to public health professionals through its National Center for Disaster Preparedness.
11.1.5 Current Health Status for
Climate-sensitive Diseases
People whose health is already compromised by pre existing disease are likely to be among the most vulnerable to emerging climate impacts. This is likely
to be the case for a wide range of disease types. We can also identify a subset of diseases that may be particularly climate sensitive, either because the existing burden of disease is especially high or because climate change could directly impact the incidence or severity of the disease. Here we highlight three broad disease categories—asthma, cardiovascular, and infectious diseases—that are likely to be particularly climate sensitive in New York State. These were selected based on the limited evidence that currently exists on climate change and health. However, we do not mean to imply that these are the only disease categories for which climate change is or will be relevant in New York State. Ongoing research and reassessment will be critical to identify and target emerging health risks.
Asthma
Asthma is potentially a climate-sensitive disease. It is already well established that asthma is exacerbated by certain weather patterns, pollen and mold seasons, and air pollution, and also is affected by indoor allergens like dust mites. Asthma can have allergic (such as pollen) or non-allergic (such as ozone) triggers, with the majority being of the allergic type. Many asthmatics are considered of mixed type, i.e., they are potentially sensitive to both types of triggers.
Hospital discharge rate
0 – <8.3 : Q1 & Q2 8.3 – <12 : Q3 12 + : Q4 Asthma hospital discharge rate
Asthma hospital discharge rate Asthma hospital discharge rate 70 70 60 60 50 50 40 40 30 30 20 20 10 10 0 0
Region 1Region 1 Region 2Region 2 Region 3Region 3 Region 4Region 4 Region 5Region 5 Region 6Region 6 Region 7Region 7 Region 8Region 8
12 + : Q4 8.3 – <12 : Q3 0 – <8.3 : Q1 & Q2
Hospital discharge rate
Note: Counties are shaded based on quartile distribution. Source: Adapted from Figure 7-13 of New York State Asthma Surveillance Report, October 2007, accessed March 18, 2009 at http://www.health.state.ny.us/diseases/asthma/ Figure 11.2 Hospital discharge rate for asthma per 10,000 population age 5 to14, 2005–2007 for (left) ClimAID regions (see Chapter 1, "Climate Risks," for definition of regions) and (right) for New York State counties
Childhood asthma is an important current health challenge in many parts of New York State—especially in the five counties that comprise New York City. Asthma events can be severe enough to require hospital admission (see Figures 11.2 and 11.3). However, the threshold of severity that triggers a hospital visit and
Source: Figure 3-1 of New York State Asthma Surveillance Report, October 2007, accessed March 18, 2009 at http://www.health.state.ny.us/diseases/asthma/ Figure 11.3 Asthma surveillance pyramid
Percent 10
8
6
4
Source: Figure 5-1 of New York State Asthma Surveillance Report, October 2007, accessed March 18, 2009 at http://www.health.state.ny.us/diseases/asthma/
1996 1998 2000 2002 2004 2006
Figure 11.4 Prevalence of current asthma among adults: 1996-2006 in New York State
1996–1997 Percent 1999–2000 10 2001–2002 2003–2004 2005–2006 8 6 4
New York City Rest of state New York StateNew York State
Source: Figure 5-2 of New York State Asthma Surveillance Report, October 2007, accessed March 18, 2009 at http://www.health.state.ny.us/diseases/ asthma/ Figure 11.5 Prevalence of current asthma among adults, by region
admission likely differs by socioeconomic status. Wealthier individuals with health insurance, under doctor supervision, and with access to controller medications are less likely to have asthma attacks and are less likely to go to the hospital for care than are lower-income individuals lacking these resources.
Figure 11.4 shows that the percentage of New York State adults reporting that they currently have asthma that was diagnosed by a physician (based on survey methods) has trended generally upward between 1996 and 2006. In terms of prevalence as opposed to hospital admissions, New York City shows similar trends to the remainder of New York State (Figure 11.5).
Cardiovascular Disease
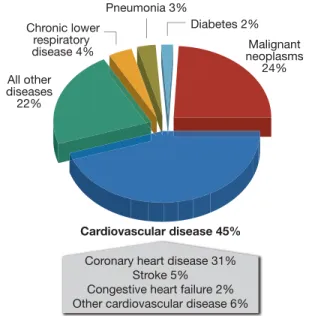
Cardiovascular disease is the leading cause of death in New York State (Figure 11.6). Underlying cardiovascular disease can interfere with a body’s ability to regulate temperature in response to heat stress and, thus, can be an important predisposing factor for vulnerability to heat-related deaths. In addition, air pollution is a risk factor for cardiovascular disease (Kheirbek et al., 2011).
Cardiovascular disease is composed of several disease conditions, the most prevalent of which is coronary heart disease. Coronary heart disease, which is the single-greatest killer of New York State residents, occurs
Source: New York State Vital Statistics, 1999 Figure 11.6 New York State causes of death
due to thickening and hardening of arteries, resulting in insufficient blood supply and potentially severe damage to heart tissue and other organ systems in the body. Age-adjusted coronary heart disease mortality for persons aged 35 and older in New York State is the highest in the nation, mostly due to coronary heart disease in persons 65 and older. Fortunately, however, there has been a steady reduction in cardiovascular death rates in the state, from the 1979 level of about 600 per 100,000 residents to the 1999 level of less than 400 per 100,000 residents (Fisher et al., 2000).
Infectious Diseases
Infectious diseases were the most important health challenge in New York City during the 1800s and were the prime focus of the New York City Department of Health activities starting in 1866. The advent of antimicrobial drugs in the 1900s strongly reduced the burden of infectious disease. However, the end of last century and the early part of this century have seen the emergence and re-emergence of infectious pathogens in New York State and globally. Climate-sensitive infectious diseases include those spread by contaminated food (Figure 11.7) and water as well as those transmitted by insects and other vectors. New York State has experienced the emergence of several vector-borne diseases in the past few decades. For instance, the state leads the nation in numbers of Lyme disease cases. Between 2002 and 2006, the top two counties in the United States for number of cases,
Number of outbr Number of outbreakseaks
180 180 160 160 140 140 120 120 100 100 80 80 60 60 40 40 20 20 0 0 1980 1980 19841984 19881988 19921992 19961996 200020002000 200420042004
Source: Adapted from Figure 1 of Foodborne Disease Outbreaks in New York State, 2005, NYS DOH, Bureau of Community Environmental Health and Food Protection, January 2005; accessed March 19 2009 at http://www.health.state.ny.us/statistics/ diseases/foodborne/outbreaks/2005/ report.htm
Figure 11.7 Reported food-borne disease outbreaks in New York State, 1980–2005
and four of the top 10 counties in Lyme disease incidence rate (cases per 100,000 people) were in New York State. Illness caused by West Nile virus in the state peaked in 2002 at 82 cases, and the state has had the highest numbers of cases on the East Coast since 2005. Both Lyme disease and West Nile virus tend to be most prevalent in the Hudson Valley, Long Island, and New York City areas with dense and growing human populations. The factors responsible for the concentration of Lyme disease and West Nile fever in the southeastern region of the state are not well understood. Similar southeastern concentrations of
Borrelia burgdorferi-infected blacklegged ticks, as well as of West Nile virus in mosquitoes and wild birds, suggest that ecological conditions, possibly including warmer climate, might be important.
11.1.6 Economic Value
The size of the public health sector is roughly reported in the official State GDP figures issued by the U.S. Bureau of Economic Analysis. The New York State full- and part-time employment in health care and social assistance for 2008 was 1,486,598 (New York State Department of Labor, 2008). The 2008 current dollar state GDP was $1.144 trillion; of this total, more than $82 billion was in the public health sector (U.S. Department of Commerce Bureau of Economic Analysis, 2009). (See also the ClimAID economic analysis in Annex III to the full report.)
11.2 Climate Hazards
Climate factors and measures that are particularly relevant to the health of New Yorkers are highlighted and briefly introduced below. Some of these factors are discussed in more detail in Vulnerabilities and Opportunities (Section 11.3) and in case studies at the end of the chapter.
11.2.1 Temperature
Historical observations over the past 40 years provide clear evidence of increasing average temperatures in New York State. Projected increases in average temperatures in the coming decades will also be associated with increases in other temperature
measures, such as the minimum and maximum temperature and the minimum, average, and maximum daily apparent temperature (perceived outdoor temperature, including factors such as wind and humidity, as well as air temperature). Other temperature measures of relevance to public health include the number of days with temperature exceeding 85, 90, and 95ºF, all of which are projected to increase. Consequently, heat-related mortality could increase, and persons with heat-sensitive conditions are at particular risk.
As temperature increases, and with potential increases in the frequency of stagnant air events over New York State, conditions favoring high ozone days could increase. Daily maximum 8-hour ozone concentrations and the number of days with 8-hour ozone concentrations above 60–70 parts per billion (ppb) represent useful measures of changing ozone-related risks for respiratory irritation and damage. These risks are particularly relevant for people working or exercising outdoors, including children and those with respiratory disease.
11.2.2 Precipitation
Extreme precipitation and flooding events can have significant direct health impacts due to injury and drowning, and can have a wide range of indirect impacts such as diminished water and food supply and quality, interruption of healthcare service delivery, mental health consequences, and respiratory responses to indoor mold. The most relevant precipitation metrics are not yet known and will likely vary for different health-related outcomes. Research is needed to elucidate the links between precipitation metrics and health in New York State.
11.2.3 Changing Patterns of Monthly
Temperatures and Precipitation
Average temperature and precipitation pattern shifts can impact ecosystems (see Chapter 6, “Ecosystems”) and can affect vector habitats and prevalence. West Nile virus as well as other diseases carried by mosquitoes, ticks, or other vectors could change their distribution or pattern of occurrence. In addition, allergy triggers such as pollen and molds could change in timing and intensity.
11.3 Vulnerabilities and Opportunities
Climate change vulnerabilities in the public health sector are, to a large extent, ones in which public health and environmental agencies are already engaged. However, climate change places an additional burden on public health agencies that are already burdened by low levels of staffing and funding. Climate-related risk factors include heat events, extreme storms, disruptions of water supply and quality, decreased air quality, changes in timing and intensity of pollen and mold seasons, and alterations in patterns of infectious disease vectors and organisms. Climate-sensitive health vulnerabilities include heat-related mortality (death) and morbidity (illness), respiratory disorders stemming from aeroallergen and/or air pollution exposures, trauma and complex downstream effects related to storm events, and a range of infectious diseases. In later sections of this chapter, we present case studies to highlight a subset of health vulnerabilities for New York State over coming decades for which adequate information and expertise currently exists to make qualitative or in some cases quantitative assessments. The case studies examine health impacts related to heat, ozone, extreme storms, and West Nile virus. These were chosen as examples based on the current (albeit limited) knowledge base, and should not be viewed as a complete list of future health vulnerabilities for New York State. Evolving science and experience will continue to clarify the picture of health vulnerabilities in coming years. In the present section, our goal is to provide a broad sense of the range of potential health vulnerabilities.
Information on public health vulnerabilities to climate variability and change in New York State is available from a series of assessments carried out over the past decade, including the Metropolitan East Coast Climate Impact Assessment (Rosenzweig and Solecki, 2001), the New York Climate and Health Project (www.globalhealth.columbia.edu/projects/RES0716289. html), and the Northeast Climate Impact Assessment (Frumhoff et al., 2007). Based on an assessment of this and subsequent work, a review of current health challenges in New York State, and on our engagement with stakeholders, several climate-related health vulnerabilities emerged. These include increased risk for all natural-cause mortality associated with more frequent and severe heat waves (Knowlton et al., 2007; Kinney et al., 2008), asthma exacerbations and
mortality associated with ozone air pollution (Knowlton et al., 2004), allergy and asthma associated with altered pollen and mold seasons, water- and food-borne diseases, emergence and/or changing distributions of vector-borne diseases, and impacts of extreme storm events, especially coastal storms in the New York City metropolitan area and Long Island.
These vulnerabilities span a range from the relatively direct, data-rich, and well-understood to more complex, multi-factorial systems for which both data and models are currently underdeveloped. Even the direct and relatively well-studied effects of heat waves on mortality among the urban elderly and those with low incomes require further work to assess potential future impacts of climate change against a backdrop of changing economics, energy constraints, demographics, and adaptation responses (Kinney et al., 2008).
Uncertainties pervade any effort to predict either direct or indirect health impacts of climate change. These uncertainties relate to projections of site-specific climate change itself, due to uncertain future pathways of global greenhouse gas emissions and the behavior of the climate system in response. This complicates future projections of climate metrics, including temperature, sea level rise, and the effects of changing temperature and humidity on health outcomes like communicable and vector-borne diseases. Additional uncertainties arise in projecting future health impacts due to potential future pathways of population demographics, economic development, and adaptation measures. These multiple uncertainties increase the importance of building resilience into the public health system to cope with inevitable surprises to come. Vulnerability assessments combined with a full accounting of uncertainties will help in prioritizing climate-health preparedness plans, informing communities on which actions should be taken first, and which information gaps are most critical to fill.
11.3.1 Temperature-Related Mortality
Extreme temperature events have been linked with higher mortality rates and premature death, in particular among vulnerable populations (elderly, young children, or those suffering from cardiovascular or respiratory conditions) (WHO, 2004; Basu and Ostro, 2009). More than 70,000 deaths were associated with the heat wave in Western Europe during the
summer of 2003 (Robine et al., 2008). In the United States, mortality rates from higher than normal temperatures have also been documented, with approximately 10,000 deaths during the summer of 1980 (Ross and Lott, 2003). Large metropolitan areas where the heat-island effect is prevalent are particularly affected. It has been estimated that in Chicago, between 600 (Dematte, 1998) and 739 (Klinengberg, 2002) people died during the July 1995 heat wave, and an additional 80 cases were attributed to a second extreme heat episode during the summer of 1999. Similarly, 118 died in Philadelphia during the July 6–14, 1993 heat wave. Moreover, the combined effects of extreme temperature and air pollution have been seen to increase morbidity and mortality cases during heat waves (Cheng, 2005).
There is also emerging evidence for effects of heat on hospital admissions for respiratory and cardiovascular diseases. For example, in a study of summertime hospital admissions in New York City during the period from 1991 to 2004, Lin and colleagues (2009) from the NYSDOH found significant associations between high temperatures and increased risk of both respiratory and cardiovascular admissions. While effects were seen throughout the population, elderly and Hispanic residents appeared to be especially vulnerable.
Those at higher risk for heat-related health effects are among the most vulnerable urban residents: the elderly, those with low incomes, those with limited mobility and social contact, those with pre-existing health conditions and belonging to nonwhite racial/ethnic groups, and those lacking access to public facilities and public transportation or otherwise lacking air conditioning. Children, urban residents, and communities in the northern parts of the state that are not adapted to heat may also be vulnerable subgroups for temperature-related mortality (death) and morbidity (illness). As stated earlier, cardiovascular disease can impair a body’s ability to regulate temperature in response to heat stress and thus can be an important predisposing factor for vulnerability to heat-related deaths. Further, persons with cardiovascular disease are often under close medical supervision and care, and thus may be especially vulnerable to disruptions of health care access following extreme storm and flood events. Since physical activity reduces the risk of cardiovascular disease, changing patterns of physical activity due to climate change could impact disease in either positive or negative directions.
As a result of climate change, New York State will experience increased temperatures that could have significant health consequences. Climate change is shifting the overall temperature distribution in the United States such that extreme high temperatures will become hotter. This will change the timing of heat waves and also increase their frequency. Urban areas are especially vulnerable because of the high concentrations of susceptible populations and the influence of the urban heat island effect. Thus, preparing for and preventing heat-related health problems is likely to be of growing importance in urban areas. Health departments, city planners, and emergency response agencies all can benefit from assessments aimed at determining future heat/health vulnerabilities under a changing climate. While the largest changes may lie 50 to 100 years in the future, smaller but still health-relevant changes are likely to occur over time horizons of interest to planners, e.g., 20 to 30 years. However, to be useful, future projections should take account not only of climate change, but also changes in population characteristics, infrastructure, and adaptive measures.
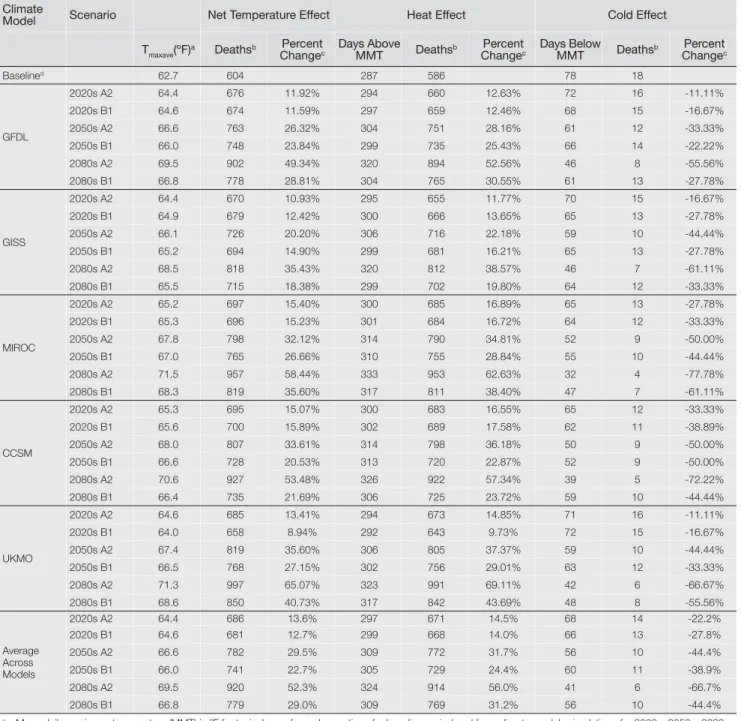
In a relevant recent study, Knowlton et al. (2007) examined potential climate change impacts on heat-related mortality in the New York City metropolitan area. Current and future climates were simulated at a 36-kilometer grid scale over the northeastern U.S. with a global-to-regional climate modeling system. Summer heat-related premature deaths in the 1990s and 2050s were estimated using a range of scenarios and approaches to modeling acclimatization. Acclimatization describes physiological adaptation in the human body that allows for maintenance of normal body temperature range during heat exposure through increased evaporative cooling (sweating), thereby mitigating cardiovascular system stress. Projected regional increases in heat-related premature mortality by the 2050s ranged from 47 to 95 percent, with a mean 70 percent increase as compared to the 1990s. Acclimatization reduced regional increases in summer heat-related premature mortality by about 25 percent. Local impacts varied considerably across the region, with urban counties showing greater numbers of deaths and smaller percentage increases than less urbanized counties. While considerable uncertainty exists in climate forecasts and future health vulnerability, the range of projections developed suggested that by mid-century acclimatization may not completely mitigate the effects of temperature change
in the New York metropolitan region, resulting in an overall net increase in heat-related premature mortality.
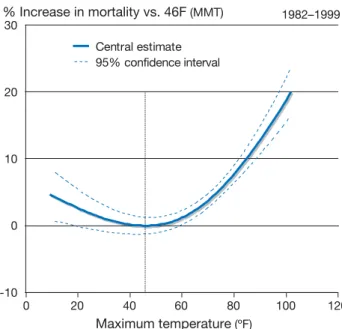
It is important to note that more people die on average in winter than in summer in New York State and in the United States as a whole. However, winter mortality is heavily influenced by influenza and other viral infections, which are more prevalent during the winter season, likely due to low indoor and outdoor humidity and activity patterns. Temperature per se appears to play a minor role. Thus, it appears unlikely that climate warming will significantly reduce winter mortality in the foreseeable future. To examine this issue further, we present below a new case study of the impacts of daily temperature throughout the year on daily mortality due to all natural causes in New York County (i.e., Manhattan). We first fitted the U-shaped exposure-response function linking temperature with mortality over the full year using an 18-year record of daily observations. The analysis controlled for seasonal and day-of-week cycles in the data. We then used the fitted function to compute future mortality under the alternative climate models and scenarios included in the ClimAID project. While temperature-related mortality was projected to diminish slightly in winter under climate change, increases in warm-season mortality far outweighed this benefit in all cases. Further, we noted that, on a percentage basis, future mortality increases will be most prominent in the spring and fall seasons.
11.3.2 Air Pollution and Aeroallergens
Climate variables such as temperature, humidity, wind speed and direction, and mixing height (the vertical height of mixing in the atmosphere) play important roles in determining patterns of air quality over multiple scales in time and space. These linkages can operate through changes in air pollution emissions, transport, dilution, chemical transformation, and eventual deposition of air pollutants. Policies to improve air quality and human health take meteorologic variables into account in determining when, where, and how to control pollution emissions, usually assuming that weather observed in the past is a good proxy for weather that will occur in the future, when control policies are fully implemented. However, policymakers now face the unprecedented challenge presented by changing climate baselines. Air quality planning is a very important
function of the New York State Department of Environmental Conservation, which is charged with the difficult task of developing and implementing strategies to achieve air quality standards despite being downwind of several states that host major emission sources. There is growing recognition that development of optimal control strategies to control future levels of key health-relevant pollutants like ozone and fine particles (PM2.5)* should incorporate assessment of potential future climate conditions and their possible influence on the attainment of air quality objectives. Given the significant health burdens associated with ambient air pollution, this is critical for designing policies that maximize future health protection. Although not regulated as air pollutants, naturally occurring air contaminants of relevance to human health, including smoke from wildfires and airborne pollens and molds, also may be influenced by climate change. Thus there is a range of air contaminants, both anthropogenic and natural, for which climate change impacts are of potential importance.
In spite of the substantial successes achieved since the 1970s in improving air quality, many New Yorkers continue to live in areas that do not meet the health-based National Ambient Air Quality Standards for ozone and PM2.5 (www.epa.gov/air/criteria.html). Ozone is formed in the troposphere mainly by reactions that occur in polluted air in the presence of sunlight. The key precursor pollutants for ozone formation are nitrogen oxides (emitted mainly by burning of fuels) and volatile organic compounds (VOCs, emitted both by burning of fuels and evaporation from stored fuels and vegetation). Because ozone formation increases with greater sunlight and higher temperatures, it reaches unhealthy levels primarily during the warm half of the year. Daily peaks occur near midday in urban areas, and in the afternoon or early evening in downwind areas. It has been firmly established that breathing ozone can cause inflammation in the deep lung as well as short-term, reversible decreases in lung function. In addition, epidemiologic studies of people living in polluted areas have suggested that ozone can increase the risk of asthma-related hospital visits and premature mortality (Peel et al., 2005; Peel et al., 2007; Kinney et al., 1991; Levy et al., 2005). Vulnerability to ozone effects on the lungs is greater for people who spend time outdoors during ozone periods, especially those who engage in physical exertion, which results in a higher cumulative dose to the lungs. Thus,
children, outdoor laborers, and athletes all may be at greater risk than people who spend more time indoors and who are less active. Asthmatics are also a potentially vulnerable subgroup.
is a complex mixture of solid and liquid particles PM2.5
that share the property of being less than 2.5 μm (millionths of a meter) in aerodynamic diameter. Because of its complex nature, PM2.5 has complicated origins, including primary particles emitted directly from a variety of sources and secondary particles that form via atmospheric reactions of precursor gases. PM2.5 is emitted in large quantities by combustion of fuels by motor vehicles, furnaces and power plants, wildfires, and, in arid regions, windblown dust (Prospero et al., 2003). Because of their small size, PM2.5 particles have relatively long atmospheric residence times (on the order of days) and may be carried long distances from their source regions (Prospero et al., 2003; Sapkota et al., 2005). For example, using satellite imagery and ground-based measurements, Sapkota and colleagues tracked a wildfire plume over 621 miles (1,000 km) from northern Quebec, Canada, to the city of Baltimore, Maryland, on the East Coast of the U.S. (Sapkota et al., 2005). Research on health effects in urban areas has demonstrated associations between both short-term and long-term average ambient PM2.5 concentrations and a variety of adverse health outcomes, including premature deaths related to heart and lung diseases (Samet et al., 2000; Pope et al., 2002; Schwartz, 1994). In addition, smoke from wildfires has been associated with increased hospital visits for respiratory problems in affected communities (Hoyt and Gerhart, 2004; Johnston et al., 2002; Moore et al., 2006). In a study of acute asthma emergency room visits in NYC, the pollutants most associated were ozone, sulfur dioxide and one-hour PM2.5. A more robust health impact was observed for the daily maximum PM2.5 concentration than the 24-hour mean, suggesting peak exposure may have larger health impacts (NYSERDA, 2006).
Airborne allergens (aeroallergens) are substances present in the air that, upon inhalation, stimulate an allergic response in sensitized individuals. Aeroallergens can be broadly classified into pollens (e.g., from trees, grasses, and/or weeds), molds (both indoor and outdoor), and a variety of indoor proteins associated with dust mites, animal dander, and cockroaches. Pollens are released by plants at specific times of the year that depend to varying degrees on temperature,
sunlight, moisture, and CO2. Allergy is assessed in humans either by skin prick testing or by a blood test, both of which involve assessing reactions to standard allergen preparations. A nationally representative survey of allergen sensitization spanning the years 1988–1994 found that 40 percent of Americans are sensitized to one or more outdoor allergens, and that prevalence of sensitization had increased compared with data collected in 1976–1980 (Arbes et al., 2005). Allergic diseases include allergic asthma, hay fever, and atopic dermatitis. More than 50 million Americans suffer from allergic diseases, costing the U.S. healthcare system over $18 billion annually (American Academy of Allergy, Asthma, and Immunology, 2000). For reasons that remain unexplained, the prevalence of allergic diseases has increased markedly over the past three to four decades. Asthma is the major chronic disease of childhood, with almost 4.8 million U.S. residents affected. It is also the principal cause for school absenteeism and hospitalizations among children (O’Connell, 2004). Mold and pollen exposures and home dampness have been associated with exacerbation of allergy and asthma, as has air pollution (Gilmour et al., 2006; IOM, 2000; IOM, 2004; Jaakkola and Jaakkola, 2004).
The influence of climate on air quality is substantial and well established (Jacob, 2005), giving rise to the expectation that changes in climate are likely to alter patterns of air pollution concentrations. Higher temperatures hasten the chemical reactions that lead to ozone and secondary particle formation. Higher temperatures, and perhaps elevated carbon dioxide (CO2) concentrations, also lead to increased emissions of ozone-relevant VOC precursors by vegetation (Hogrefe et al., 2005).
Weather patterns influence the movement and dispersion of all pollutants in the atmosphere through the action of winds, vertical mixing, and rainfall. Air pollution episodes can occur with atmospheric conditions that limit both vertical and horizontal dispersion. For example, calm winds and cool air aloft limits dispersion of traffic emissions during morning rush hour in winter. Emissions from power plants increase substantially during heat waves, when air conditioning use peaks. Weekday emissions of nitrogen oxides (NOx) from selected power plants in California more than doubled on days when daily maximum temperatures climbed from 75°F to 95°F in July, August,
and September of 2004 (Drechsler et al., 2006). Changes in temperature, precipitation, and wind affect windblown dust, as well as the initiation and movement of forest fires.
Finally, the production and distribution of airborne allergens such as pollens and molds are highly influenced by weather phenomena, and also have been shown to be sensitive to atmospheric CO2 levels (Ziska et al., 2003). The timing of phenologic events such as flowering and pollen release is closely linked with temperature.
Human-induced climate change is likely to alter the distributions over both time and space of the meterologic factors described above. There is little question that air quality will be influenced by these changes. The challenge is to understand these influences better and to quantify the direction and magnitude of resulting air quality and health impacts. Hogrefe and colleagues were the first to report results of a local-scale analysis of air pollution impacts of future climate changes using an integrated modeling approach (Hogrefe et al., 2004a; Hogrefe et al., 2004b). In this work, a global climate model was used to simulate hourly meteorologic data from the 1990s through the 2080s based on two different greenhouse gas emissions scenarios, one representing high emissions and the other representing moderate emissions. The global climate outputs were downscaled to a 36-kilometer (22 mile) grid over the eastern U.S. using regional climate and air quality models. When future ozone projections were examined, summer-season daily maximum 8-hour concentrations averaged over the modeling domain increased by 2.7, 4.2, and 5.0 ppb in the 2020s, 2050s, and 2080s, respectively, as compared to the 1990s, due to climate change alone. The impact of climate on mean ozone values was similar in magnitude to the influence of rising global background ozone by the 2050s, but climate had a dominant impact on hourly peaks. Climate change shifted the distribution of ozone concentrations toward higher values, with larger relative increases in future decades occurring at higher ozone concentrations.
The finding of larger climate impacts on extreme ozone values was confirmed in a study in Germany (Forkel and Knoche, 2006) that compared ozone in the 2030s and the 1990s using a downscaled integrated modeling system. Daily maximum ozone concentrations increased
by 2–6 ppb (6–10 percent) across the study region. However, the number of cases where daily maximum ozone exceeded 90 ppb increased by nearly four-fold, from 99 to 384.
More recently, the influence of climate change on PM2.5 and its component species have been examined in the northeastern U.S., including New York State, using an integrated modeling system (Hogrefe et al., 2006). Results showed that PM2.5 concentrations increased with climate change, but that the effects differed by component species, with sulfates and primary particulate matter increasing markedly but with organic and nitrated components decreasing, mainly due to transformation of these volatile species from the particulate to the gaseous phase.
The health implications of wildfire smoke have been tragically demonstrated by events in Russia during the summer of 2010. Because the risk of wildfire initiation and spread is enhanced with higher temperatures, decreased soil moisture, and extended periods of drought, it is possible that climate change could increase the impact of wildfires in terms of frequency and area affected (IPCC, 2007a; Westerling et al., 2006). Among the numerous health and economic impacts brought about by these more frequent and larger fires, increases in fine particulate air pollution are a key concern, both in the immediate vicinity of fires as well as in areas downwind of the source regions. Several studies have been published examining trends in wildfire frequency and area burned in Canada and the U.S. Most such studies report upward trends in the latter half of the 20th century that are consistent with changes in relevant climatic variables (Westerling et al., 2006; Gillett et al., 2004; Podur et al., 2002). Interpretation of trends in relation to climate change is complicated by concurrent changes in land cover and in fire surveillance and control. However, similar trends were seen in areas not affected by human interference (Westerling, et al., 2006) or under consistent levels of surveillance over the follow-up period (Podur et al., 2002). Several studies have looked at wildfire risk in relation to climate change (Lemmen and Warren, 2004; Williams et al., 2001; Flannigan et al., 2005; Bergeron et al., 2004).
Aeroallergens that may respond to climate change include outdoor pollens generated by trees, grasses, and weeds, and spores released by outdoor or indoor molds. Historical trends in the onset and duration of pollen
seasons have been examined extensively in recent studies, mainly in Europe. Nearly all species and regions analyzed have shown significant advances in seasonal onset that are consistent with warming trends (Root et al., 2003; Beggs, 2004; Beggs and Bambrick, 2005; Clot, 2003; Emberlin et al., 2002; Galan et al., 2005; Rasmussen, 2002; Teranishi et al., 2000; van Vliet et al., 2002; World Health Organization, 2003). There is more limited evidence for longer pollen seasons or increases in seasonal pollen loads for birch (Rasmussen, 2002) and Japanese cedar tree pollen (Teranishi et al., 2000). Grass pollen season severity has been shown to be greater with higher pre-season temperatures and precipitation (Gonzalez et al., 1998). What remains unknown is whether and to what extent recent trends in pollen seasons may be linked with upward trends in allergic diseases (e.g., hay fever, asthma) that have been seen in recent decades.
In addition to earlier onset of the pollen season and possibly enhanced seasonal pollen loads in response to higher temperatures and resulting longer growing seasons, there is evidence that CO2 rise itself may cause increases in pollen levels. Experimental studies have shown that elevated CO2 concentrations stimulate greater vigor, pollen production, and allergen potency in ragweed (Ziska et al., 2003; Ziska and Caufield, 2000; Singer et al., 2005). Ragweed is arguably the most important pollen species in the U.S., with up to 75 percent of hay fever sufferers sensitized (American Academy of Allergy, Asthma, and Immunology, 2000). Significant differences in allergenic pollen protein were observed in comparing plants grown under historical CO2 concentrations of 280 ppm, recent concentrations of 370 ppm, and potential future concentrations of 600 ppm (Singer et al., 2005). Interestingly, significant differences in ragweed productivity were observed in outdoor plots situated in urban, suburban, and rural locales where measurable gradients were observed in both CO2 concentrations and temperatures. Cities are not only heat islands but also CO2 islands, and thus to some extent represent proxies for a future warmer, high CO2 world (Ziska et al., 2003).
With warming over the longer term, changing patterns of plant habitat and species density are likely, with gradual movement northward of cool-climate species like maple and birch, as well as northern spruce (IPCC, 2007a). Although these shifts are likely to result in altered pollen patterns, to date they have not been assessed quantitatively.
As compared with pollens, molds have been much less studied (Beggs, 2004). This may reflect in part the relative paucity of routine mold monitoring data from which trends might be analyzed, as well as the complex relationships between climate factors, mold growth, and spore release (Katial et al., 1997). One study examining the trends in Alternaria spore counts between 1970 and 1998 in Derby, U.K., observed significant increases in seasonal onset, peak concentrations, and season length. These trends parallel gradual warming observed over that period.
In addition to potential effects on outdoor mold growth and allergen release related to changing climate variables, there is also concern about indoor mold growth in association with rising air moisture and especially after extreme storms, which can cause widespread indoor moisture problems from flooding and leaks in the building envelope. Molds need high levels of surface moisture to become established and flourish (Burge, 2002). In the aftermath of Hurricane Katrina, very substantial mold problems were noted, causing unknown but likely significant impacts on respiratory morbidity (Ratard, 2006). There is growing evidence for increases in both the number and intensity of tropical cyclones in the north Atlantic since 1970, associated with unprecedented warming of sea surface temperatures in that region (IPCC, 2007a; Emanuel, 2005).
Taken as a whole, the emerging evidence from studies looking at historic or potential future impacts of climate change on aeroallergens led Beggs to state (Beggs, 2004):
[This] suggests that the future aeroallergen characteristics of our environment may change considerably as a result of climate change, with the potential for more pollen (and mold spores), more allergenic pollen, an earlier start to the pollen (and mold spore) season, and changes in pollen distribution.
11.3.3 Infectious Diseases
Infectious diseases that are transmitted by arthropod vectors, such as mosquitoes and ticks, are highly sensitive to climate change. Effects of even small increases in average temperatures can increase rates of population growth and average population
densities of mosquitoes and other vectors (Harvell et al., 2002; Epstein, 2005). In addition, both the biting rates of mosquitoes and the replication rates of the parasites and pathogens they transmit increase with increasing temperatures (Harvell et al., 2002). Nevertheless, the degree to which recent and future climate change affects the distribution and intensity of vector-borne diseases remains controversial (Harvell et al., 2002; Ostfeld, 2009). One common criticism of the contention that climate warming will cause vector-borne diseases to spread geographically is that, just as some areas that are below the suitable temperature range will move into this range, others that are currently suitable might become too warm. Evidence to support this contention, however, is scant (Ostfeld, 2009). Moreover, because the overall climate of New York State appears to be well below any detectable upper thresholds for vector-borne disease, it seems that climate warming is more likely to increase, rather than decrease, the burden of vector-borne disease in the state.
In the case of Lyme disease, a climate-based spatial model (Brownstein, et al., 2005) suggested that the conditions under which blacklegged tick populations can be supported will expand northward into Canada as the climate warms. However, this model assumed that ticks currently occupy the entire state of New York and therefore was unable to make predictions relevant to the expansion of Lyme disease within the state. Other models (Ogden et al., 2005) also predict northward expansion of blacklegged ticks into areas currently assumed to be too cold to support them. These models are based on assumed, rather than empirically verified, relationships between temperature and tick demography (Killilea et al., 2008). In contrast, the relationships between specific climatic parameters and cases of West Nile virus illness or mosquito vector demography are better established. Therefore, this chapter focuses on West Nile virus in Case Study D.
11.4 Adaptation Strategies
Climate is often considered a factor that will change the frequency and severity of existing health problems more than create entirely new ones. From this point of view, the challenge is more about integrating specific information about climate-related vulnerabilities into ongoing programs of public health surveillance,
Air conditioner in home 73.7–82.8% 82.9–88.3% 88.4–92.2% 92.3–95.1% Neighborhood income
Very low poverty (<10%) Low poverty (≥10–<20%) Moderate poverty (≥20–<30%) High poverty (≥30%)
prevention, and response than developing new programs to deal with unique challenges. While largely valid, this view misses the mark in one important way, namely that changing climate brings the possibility of entirely new health risks, for example from new infectious diseases or coastal storm events of unprecedented magnitude.
Here we briefly review a range of adaptation options that should be considered in addressing climate-related health risks in New York State.
11.4.1 Key Adaptation Strategies
Avoiding or reducing the health impacts of climate change will ultimately depend on public health preparedness. In the sections that follow, a number of adaptations, or preparedness strategies, are discussed.
Heat Adaptation
Heat-related mortality has been recognized as an important public health challenge for many decades. As a result, heat warning and response systems have been implemented in many cities in the United States and Europe, including New York City. These warning systems include collaboration with local meteorologists for forecasting as well as coordination with multiple agencies and community groups. The goal is to maximize dissemination of actionable information for both immediate health protection and provision of additional services during the period of intense heat. Often the additional services include longer hours at community centers for seniors (called cooling centers during the time they are open during a heat wave) as well as reduced fare on public transportation or the implementation of neighborhood buddy systems. In addition, the NYSDOH distributes statewide a fact sheet entitled “Keep Your Cool During Summer Heat” that provides information on what to do before and during a heat event, how to recognize and act on heat-related illness, and who is most vulnerable. The NYSDOH also has worked with the State Environmental Health Collaborative Climate Workgroup to develop several climate indicators. These include indicators for the vulnerable population (elderly and people living in low-income neighborhoods), cardiovascular disease, hospital readmissions for respiratory diseases due to heat, maximum/minimum
temperature, and air pollution change due to heat. One important priority with respect to these efforts is to evaluate their effectiveness in reducing morbidity and mortality.
Home air conditioning is a critical factor for prevention of heat-related illness and death (Bouchama et al., 2007). Air conditioning is especially important for elderly, very young, and health-compromised individuals, all of whom have a lower internal capacity to regulate body temperature (CDC, 2009).
Within New York City, approximately 84 percent of housing units had some form of indoor air conditioning in 2003. Air conditioning rates are not uniform across the city, however. Neighborhoods with higher poverty rates, including Central Harlem, Washington Heights, Fordham, the South Bronx, Greenpoint, Williamsburg, Bedford-Stuyvesant, and others, have lower rates of in-home air conditioning than more affluent parts of the city (Figure 11.8). These differences suggest that many residents living in lower-income neighborhoods of the city may be more vulnerable to heat-related illness and mortality. e m o h in r ione it d n o c r i A % 8 2. 8 – .7 3 7 % 3 8. 8 – .9 2 8 % 2 2. 9 – .4 8 8 % 1 5. 9 – .3 2 9 Neighborhood incom V Low Moderate High e Neighborhood incom ) (<10% poverty low ery V ) <20% – 10 ≥ ( poverty Low ) <30% – 20 ≥ poverty ( Moderate ) 30% ≥ poverty ( High
Note: Percentages are age adjusted. Poverty is categorized by the percent of residents in each neighborhood living below the federal poverty level. Source: NYC Community Health Survey 2007; Bureau of Epidemiology Services, NYC DOHMH; U.S. Census 2000/NYC Department of City Planning
Figure 11.8 Air conditioning distribution and neighborhood-level poverty in New York City
The presence of an air conditioner does not necessarily equate to its effective use during a heat wave. Also, while fans can be helpful at moderate temperatures, Wolfe (2003) points out that their effectiveness diminishes at very high temperatures and humidity. As noted in the Chapter 8 (“Energy”), energy costs associated with use of air conditioning are a major concern for lower-income households and particularly for lower-income elderly populations (Tonn and Eisenberg, 2007). Even during periods of extreme heat, low-income elderly residents, particularly those living alone, may be reluctant to use their air conditioners due to concerns about energy costs. While age and social isolation were key factors in predicting mortality in the 1995 Chicago heat wave (Semenza et al., 1996), presence of air conditioning in the home did not necessarily have a mitigating effect. Many of the Chicago heat wave’s elderly victims had working air conditioners in their apartments, but the machines were not in use at the time of death (Klinenberg, 2003). Thus, to improve the effectiveness of air conditioning as an adaptive measure, it will be important to develop strategies to ensure energy access for low-income, vulnerable individuals, as well as ensure that functional, high-efficiency air conditioners are widely available and in use. Possible measures include monetary support of low-income populations to ensure the use of air-conditioning and programs for peak load and or voltage reduction (Warren and Riedel, 2004). The costs to implement such measures are not well documented.
In addition to these measures, infrastructure investments, particularly in vulnerable urban neighborhoods, could yield substantial health benefits. Urban greening programs, green roofs, and building codes requiring reflective exterior surfaces are among the options that should be considered.
Air Pollution
Implementation strategies addressing ozone and fine particles are well developed in New York State and are described on the New York State Department of Environmental Conservation website (www.dec.ny.gov/ chemical/8403.html; see State Implementation Plan). However, integrating climate forecasts into ongoing planning for air quality is a challenge that must be addressed in collaboration with stakeholders at the New
York State Department of Environmental Conservation and the U.S. Environmental Protection Agency.
11.4.2 Larger-scale Adaptations
Comparative health-risk assessments of climate change adaptation (and also mitigation) measures, such as the health effects of the combustion byproducts of biofuels and gases of varying ethanol blends, are important. Data gaps, such as the specifics of relationships between certain climate factors and some health outcomes and projections of climate impacts on multiple types of disease and vulnerable subpopulations, and the specific ongoing need for increased environmental monitoring linked to health outcome reporting, are also key to adaptation. Additionally, stakeholders have voiced the importance of public health communication. Alerts regarding known health risks should be tested and tailored to most effectively convey information and needed action to vulnerable communities. Cross cutting environment and health initiatives that bridge the divide in legislation between ecosystems and human health should also be developed.
11.4.3 Co-benefits and Opportunities
This chapter has focused primarily on potential negative health impacts of a changing climate in New York State. However, it is possible that climate change may bring some positive impacts on health. For example, warmer winters may reduce the burden of some cold-related health effects (e.g., hypothermia among the homeless, snow-related accidents and injuries) and could encourage greater physical activity during extended periods of mild weather. In addition, policies enacted in New York State to reduce greenhouse gas (GHG) emissions by curtailing fossil fuel burning will reduce emissions of other pollutants, and may deliver health benefits as well. Furthermore, unlike climate benefits, these health co-benefits accrue locally in space and time, enhancing their value in economic analyses (Burtraw et al., 2003; Dessus and O’Connor, 2003; Proost and Van Regemorter, 2003; Wang and Smith, 1999; Bloomberg and Aggarwala, 2008). For 20 years at least, researchers have attempted to quantify co benefits (Ayres and Walter, 1991; Viscusi, 1994). Most studies have found that the magnitude of the ancillary benefits are large, even relative to the large outlays required by GHG mitigation. Most of the literature to
date emphasizes co-benefits that accrue from reductions in air pollution, particularly PM2.5 and ozone precursors. However, GHG mitigation policies may improve health in other ways, e.g., via increased physical activity, decreased meat consumption, and reduced traffic accidents. For comprehensive reviews see Bell et al. (2008) and Nemet et al. (2010).
11.5 Equity and Environmental Justice
Considerations
Climate change is an evolving problem for human health conditioned by unequal access to resources and differential exposure to unhealthy landscapes. The negative impacts of climate change on health may be particularly consequential for people living in poverty or communities segregated by race.
11.5.1 Vulnerability
There are two important pathways for climate-related health inequities. First, lower-income populations and communities of color may be concentrated in areas exposed to more climate-sensitive health risks. For example, compared to higher-income white populations, low-income segregated African-American and Hispanic communities tend to have greater exposure to allergens and smog, and live in homes that are less able to regulate temperature and humidity (Williams and Collins, 2001; Evans and Kantrowitz, 2002). Second, exposure may impose added burdens on pre-existing vulnerabilities of health, living conditions, and socioeconomic position. For example, low-income communities tend to have inferior public infrastructure, higher risk of underlying health conditions such as cardiovascular disease, and less access to quality, affordable health care (Williams and Collins, 2001; Evans and Kantrowitz, 2002). Other indicators of pre existing vulnerabilities to climate-related health shocks include lower wages or unemployment, lack of insurance, occupational stresses, and poor nutrition. Higher temperatures will likely increase the duration and intensity of heat waves and associated heat-related health stresses. Heat-related health stresses are felt disproportionately in inner-city urban areas, where a preponderance of heat-trapping surfaces and a scarcity of heat-reducing infrastructure (trees, parks, water)
contribute to the urban “heat island” effect (Rosenzweig et al., 2006). The urban heat island effect has been implicated in past heat wave events (Kunkel et al., 1996). Because of residential segregation patterns, these inner-city neighborhoods also tend disproportionately to house low-income communities of color (Williams and Collins, 2001).
Health risks can be intrinsic or extrinsic. Intrinsic heat-related health risks include age, disability, and underlying medical conditions, such as depression or cardiovascular problems (Stafoggia, 2006; Worfolk, 2000). Some of these medical conditions are more prevalent in low-income communities or within communities of color. Extrinsic risks encompass contextual factors such as behavior, quality of housing, community integration, and access to cooling infrastructure and transportation (Kovats and Hajat, 2007; Epstein and Rogers, 2004; Klinenberg, 2003). Some of these risks are also associated with lower-income status, such as the higher probability of residing in heat-trapping buildings and lacking air conditioning (Klinenberg, 2003). All these risks generally interrelate to create unique, magnified vulnerabilities. For example, elderly persons may be medically sensitive to heat stress (intrinsic), while at the same time may lack coping strategies such as access to community support networks (extrinsic) (Worfolk, 2000; Klinenberg, 2003). Heat-related morbidity also has its own suite of inequities (Lin et al., 2009). Those most likely to die from heat stress are not necessarily those who would suffer the contextual and indirect harms associated with heat morbidity, such as lost wages and productivity and health care expenses.
Air pollution and respiratory health is another area in which environmental justice concerns arise in the context of climate change. African Americans tend to live in urban centers that are more exposed to primary air pollutants. They also are significantly more likely to be hospitalized and die from asthma (Prakash, 2007). Rising temperatures and increasing emissions create conditions for ozone formation and further inequitably distributed health burdens.
Another climate impact is the probability of increased levels of mold and other allergens. This also contributes to respiratory health problems (Beggs, 2004). Dampness of households, a key variable for mold growth, is associated with socioeconomic status (Gold, 1992).
Environmental justice activists have become increasingly concerned about the contribution of mold to the high rates of hospitalization for asthma among African Americans in cities such as New York (NYS Department of Environmental Conservation, 2008). Tackling these high rates of urban asthma or home allergens through health adaptation programs is one way to reduce health disparities.
Securing access to affordable, good quality, nutritious food for lower-income urban communities of color is a priority area for environmental justice advocates in New York State (NYS Department of Environmental Conservation, 2008). Impacts of climate change on local agriculture could make this goal more challenging to achieve.
11.5.2 Adaptation
Some cities, such as New York, have begun developing adaptation programs because of existing health burdens related to heat stress (Rosenzweig et al., 2006). Other more northerly cities in the state may confront new emergent heat stress. They will need to be proactive to avoid any evolving health inequities related to differential coping capacities within their populations. Since heat danger is frequently mediated by underlying vulnerabilities, one way to build equity into climate change adaptation mechanisms is a broad-based effort to improve health and reduce social isolation among vulnerable populations, including increasing access to health insurance and social support systems, broadening and diversifying economic activities, and improving education. More targeted adaptations include short-term social mechanisms such as warnings and outreach in conjunction with long-term technical design approaches that reduce ambient heat (Bernard and McGeehin, 2004; Rosenzweig et al., 2006). Ensuring equitable implementation of social prevention requires tailoring messages among and within groups. This means confronting language barriers in outreach and warning systems and targeting at-risk groups, such as elderly, disabled, or otherwise isolated persons. For example, the Phoenix heat wave in 2005 took a particular toll on homeless people (Epstein, 2005). Designing a warning for itinerants with tenuous access to information is a challenge for any outreach system. Through the CDC's Climate-Ready States and Cities Initiative, the New York State Department of Health is conducting an
assessment that will examine a range of health outcomes related to extreme weather events, as well as waterborne, food-borne, and vector-borne diseases (www.cdc.gov/climatechange/climate_ready.htm). One way to build social justice into heat adaptive design is to prioritize energy efficiency and retrofits of public housing, such as installing cooling surfaces and insulation. These synergistic approaches are also discussed in Chapter 8, “Energy.” Other strategies that enforce climate-adaptive regulations, such as new building codes, might need to provide support mechanisms, funding incentives, or loans for low-income homeowners and small businesses.
11.6 Conclusions
This ClimAID assessment has identified a set of key existing and future climate risks for public health in New York State. Some health risks arise from increases in the frequency, duration, or intensity of weather events, such as diverse health consequences from more storms and flooding events, and from heat-related mortality and morbidity. Other risks may arise due to gradual shifts in weather patterns, such as changes in vector-borne disease prevalence and distribution, worsening air quality (smog, wildfires, pollen), and related cardiovascular and respiratory health impacts. Similarly, risks to water supply and food production may arise due to increased temperatures and shifting precipitation patterns. While the analyses presented here have been from the perspective of New York State, it is important to note that many of our findings can be generalized to other U.S. locations.
11.6.1 Main Findings on Vulnerability and
Opportunities
• Climate will likely change the frequency and severity of existing health problems, while also bringing the possibility of entirely new health risks. • Impacts of climate change will be particularly
significant for people in New York State made more vulnerable because of age, preexisting illness, and/or poverty.
• Illness and death from heat will particularly impact low-income urban residents, the elderly, and those with pre-existing health conditions.
• Climate-related changes in air pollution patterns will be particularly significant for asthmatics and for persons who work, play, or exercise out of doors.
11.6.2 Adaptation Options
Adaptation to climate-related health vulnerabilities in New York State is an evolving process. Aside from heat wave warning and response planning, few climate-specific adaptation strategies yet exist in New York State. Climate impacts and adaptation strategies for the health sector build upon the existing public health system of New York State, which is already engaged to some extent with most of the health domains likely to be relevant to climate change. However, there is the possibility that future climate impacts in the health sector may fall outside of historical experience, presenting new challenges. Of particular concern is that information and capacity for integrating climate change into public health planning remains limited at the local level.
Future adaptations in the health sector should begin by enhancing capacity for climate planning within the existing public health system of New York State, and also by strengthening linkages between health and environmental initiatives.
One key objective is to expand ongoing surveillance of climate-sensitive environmental and health indicators. Surveillance is a central public health function that can inform periodic assessments of emerging risks and anticipated future impacts, and help to guide ongoing adaptation planning.
Another key area of focus should be the development of early warning systems and response plans for a broader range of climate risks, building on the experience with heat systems. Adaptation strategies and messaging should be particularly targeted at, and tailored for, protecting vulnerable populations.
Air quality control efforts will need to increasingly take climate change into account, as well as be integrated with greenhouse gas mitigation strategies, so that maximal health co-benefits are achieved.
A general point worth emphasizing is the importance of integrated health planning across multiple sectors, including environmental quality, parks and recreation, urban planning, food and water supply, and others.
With respect to equity and environmental justice, care is called for in designing both adaptation and mitigation strategies so that disparities can be reduced. Without making this an explicit goal, existing health disparities are likely to be worsened by climate change. People in northern parts of the state may be at particular risk for heat-related health impacts due to lack of adaptation to high temperatures. Mitigation and adaptation actions by New York State should ensure an equitable distribution of costs and benefits.
11.6.3 Knowledge Gaps
Future efforts to address health risks due to climate change will require ongoing, state-based research to inform periodic policy developments. Of particular importance is research to identify cross-sectoral interactions and win-win options for adaptation/mitigation, including extensive health co benefits assessments.
It is also important to develop and analyze local health impact project