2014
The effects of hotel performance characteristics on
customer online ratings
Wanchen Yu
Iowa State University
Follow this and additional works at:https://lib.dr.iastate.edu/etd
Part of theBusiness Administration, Management, and Operations Commons, and the Management Sciences and Quantitative Methods Commons
This Thesis is brought to you for free and open access by the Iowa State University Capstones, Theses and Dissertations at Iowa State University Digital Repository. It has been accepted for inclusion in Graduate Theses and Dissertations by an authorized administrator of Iowa State University Digital Repository. For more information, please contactdigirep@iastate.edu.
Recommended Citation
Yu, Wanchen, "The effects of hotel performance characteristics on customer online ratings" (2014).Graduate Theses and Dissertations. 13994.
The effects of hotel performance characteristics on customer online ratings by
Wanchen Yu
A thesis submitted to the graduate faculty
in partial fulfillment of the requirements for the degree of MASTER OF SCIENCE
Major: Hospitality Management Program of Study Committee: Nicholas Thomas, Co-Major Professor
Thomas Schrier, Co-Major Professor Lisa Young Thomas
Telin Chung
Iowa State University Ames, Iowa
2014
TABLE OF CONTENTS Page LIST OF FIGURES ... iv LIST OF TABLES ...v ACKNOWLEDGMENTS ... vi ABSTRACT ... vii CHAPTER 1. INTRODUCTION ...1
Background of the Study ...1
Statement of the Problem ...3
Purpose of the Study ...3
Significance of Study ...4
CHAPTER 2. LITERATURE REVIEW ...5
WOM in the Hospitality Industry ...5
Overview and Role of Electronic Word-of-Mouth ...8
Transformation ...8
Use of Online Resources ...9
Use of eWOM ...10
Impact on the Lodging Industry ...11
Effect of Customer Rating on Tourism ...13
Hotel Performance Characteristics ...15
Summary ...16
CHAPTER 3. METHODOLOGY ...17
Introduction ...17
Population and Sample ...17
Secondary Data ...18 Sample Collection ...20 Variables ...21 Hypotheses ...21 Data Analysis ...23 Summary ...24 CHAPTER 4. RESULTS ...25 Introduction ...25
Reliability and Validity ...25
Descriptive Data Summary ...26
Variation in Lodging Property Ratings ...29
Variations among Independent Variables versus Lodging Property Ratings ...33
Regression Model ...34 Linearity ...35 Independence of Errors ...35 Normality ...36 Equality of Variance ...40 Regression Results ...41 Summary ...43 CHAPTER 5. DISCUSSION ...44 Findings...44 Limitations ...47
Recommendations for Future Research ...50
LIST OF FIGURES
Figure 1. Graphic representation of the variables used in Hypothesis ... 23
Figure 2. Graphic representation of distribution of hotel rating (stars) for all cities ... 30
Figure 3. Graphic representation of distribution of hotel rating (stars) for each city ... 32
Figure 4. Rating variable normality histogram ... 36
Figure 5. ADR variable non-normality histogram ... 37
Figure 6. Occupancy variable non-normality histogram ... 37
Figure 7. Census Property variable normality histogram ... 38
Figure 8. Log ADR variable normality histogram ... 39
Figure 9. Log Occupancy variable normality histogram ... 39
LIST OF TABLES
Table 1. Percentages of hotels included in the sample for each market ... 20
Table 2. Independent variables and their definitions ... 21
Table 3. Descriptive statistics for Los Angeles-Long Beach, CA ... 27
Table 4. Descriptive statistics for Washington, DC ... 27
Table 5. Descriptive statistics for Orlando, FL ... 28
Table 6. Descriptive statistics for Chicago, IL ... 28
Table 7. Descriptive statistics for New York, NY ... 29
Table 8. Regressed rating on Chicago, Los Angeles-Long Beach, Orlando, and Washington, DC ... 33
Table 10. Variance inflation factor (VIF) of the variables ... 35
Table 11. Breusch-Pagan test for heteroscedasticity ... 40
Table 12. Hypothesized model ... 41
Table 13. ANOVA ... 42
ACKNOWLEDGMENTS
I am grateful to many people who have helped me throughout my graduate program of studies at Iowa State University. First, I would like to thank my parents, who supported me mentally and financially throughout my entire study in the U.S. Their love and assistance have provided me with a special experience and a truly wonderful life.
I am sincerely thankful to my co-major professor, Dr. Nicholas J. Thomas, whose expertise, guidance, and encouragement have enabled me to grow as a person and conduct meaningful research. In addition, I would also like to thank to my committee members, Dr. Thomas Schrier, who served as a co-major professor, as well as Drs. Lisa Y. Thomas and Telin Chung, for their guidance and support throughout the course of this research.
I am also grateful to my editor, Pat Hahn, whose skills improved the quality of the written thesis. Finally, special thanks to my friends for making my life at Iowa State University a wonderful and unforgettable experience—we traveled many hills and valleys along the way.
ABSTRACT
Due to rapid development and consumer adoption of technology, the hospitality industry has dramatically increased online-based consumer reviews for a variety of hospitality services such as those found in foodservice and lodging segments (e.g., Litvin, Goldsmith, & Pan, 2008). This study focused on the lodging industry, and investigated the relationship between characteristics of lodging industry performance and user-generated customer reviews on a popular website, TripAdivsor.com, by analyzing five of the top U.S. lodging US markets. Data from these cities included: (a) the top 100 highest ranked hotel ratings based on online customer reviews; (b) total number of hotels; (c) the average daily rate (ADR) for hotels; and (d) the occupancy percentage of hotels in a selected city.
Customer hotel ratings were collected from TripAdvisor.com and city characteristics were collected from Smith Travel Research (STR), a leader in hotel industry data collection and analytics. The results of this study revealed that customer ratings differ by location, which can impact the destination image in the mind of customers and influence their
destination travel choices. Results also revealed that ADR, occupancy rate, and the number of total number of hotel properties could be used to predict customer ratings on a lodging property or an overall average rating for a market. The study concludes with a discussion of the findings, implications for practice, and recommendations for future research.
CHAPTER 1. INTRODUCTION Background of the Study
Due to rapid development and consumer adoption of technology, the hospitality industry has dramatically increased consumer reviews for a variety of hospitality services such as those found in foodservice and lodging segments (e.g., Ye, Law, Gu, & Chen, 2011). Word of mouth (WOM) is the transmission of products or companies information among people by face-to-face communication (Arndt, 1967). WOM communication is not a new concept. It has been well researched, and is an essential marketplace phenomenon that enables consumers to share information and opinions relating to specific products, brands, and services (Hawkins, Best, & Coney, 2004; Laczniak, DeCarlo, & Ramaswami, 2001). People pay great attention to other’s opinions (Banerjee, 1992). Weak ties, which have been defined as information from strangers or acquaintances, play a more crucial role in the flow of WOM information than strong ties, which is information from family, friends and relatives (Brown & Reingen, 1987). Additionally, personal sources and experiences have a greater influence on the purchase of services, referred to as “experience goods”, than purchases of other products (Murray, 1991).
Experience goods are defined as products or services wherein the product
characteristics, such as quality, are difficult to observe prior to consumption (Pine & Gilmore, 1998). For experience goods, consumers will actively seek other information to help them make a final purchase decision (Hu, Liu, & Zhang, 2008). Thus, consumers tend to rely on WOM to reduce their level of perceived risk and uncertainty in the purchase decision (Klein, 1998).
Lodging and tourism products are seen as high-risk purchases and, thus, the influence of WOM is essential in the management of hospitality industry operations, particularly those found in the lodging and food service segments (Lewis & Chambers, 2000). Seeking positive and negative WOM information from consumers who have experienced a particular service is important for consumers who are unfamiliar with a service provider, which is often the case for making travel-related decisions (e.g., Chatterjee, 2001; O’Neill, Palmer, & Charters, 2002; Shanka, Ali-Knight, & Pope. 2002).
Advances in information technology has transformed the way information flows across social circles and customers can use it to gather, distribute, and publish information (Cakim, 2009). The form of WOM has changed from a face-to-face interaction to one that is now based online. This new method of exchanging and experiencing WOM electronically has been referred to as electronic word of mouth (eWOM). This unique way of
communicating enables interaction between consumers, themselves, as well as between consumers and producers (Goldsmith, 2006).
The hospitality industry is intensely competitive, and the use of eWOM influence may provide an important competitive advantage for firms that are early adopters (Litvin et al., 2008). Results from research conducted by Mauri and Minazzi (2013) show that “more than 75% of respondents consult comments of other customers before booking a hotel” (p. 103). Thus, the influence of eWOM is valuable for the information gathering process, especially for information used in the travel-related planning processes in the hospitality industry and reducing the uncertainty and the loss that these decisions may create (Chatterjee, 2001; Sparks & Browning, 2011). Customer reviews and ratings can act as indicators in
assisting in efficient information processing and helping consumers making potential decisions (Sparks & Browning, 2011).
Statement of the Problem
Although the impact of eWOM in the hospitality industry has been widely studied (e.g., Gretzel & Yoo, 2008; Litvin et al., 2008; Ong, 2012; Sparks & Browning, 2011; Stringam & Gerdes Jr., 2010), the majority of studies published in the academic literature have used qualitative data (i.e., customer reviews and open-end surveys) for analysis (e.g., Mauri & Minazzi, 2013; Ye et al., 2011). After a cursory review of the existing literature, it appears there is a gap that exists related to research that uses quantitative data (i.e., customer ratings, reputation rates, occupancy percentages, etc.). Moreover, literature focused on the influence of eWOM in the lodging industry has traditionally highlighted the findings on lodging properties rather than whole markets. Literature focused on the relationship between eWOM and market characteristics are limited.
Purpose of the Study
This study was conducted to investigate the relationship among two commonly used lodging property performance metrics (average daily rate and occupancy percentage), total lodging properties in a particular city, and the overall ratings of the top 100 highest ranked lodging properties found on TripAdvisor.com. The objectives of the study were to:
1. Determine the variability of hotel ratings in the top lodging U.S. lodging markets based on their overall size and performance; These cities are (a) Los Angeles – Long Beach, CA; (b) New York, NY; (c) Washington DC; (d) Orlando, FL; and (e)
2. Determine which, if any, characteristics of a lodging property and city have the influential power on hotel rating.
3. Identify which characteristics of a lodging property and city can be used to predict hotel ratings.
Significance of Study
In the hospitality industry, quantitative customer ratings, as one of the forms of eWOM, have received little attention compared to qualitative customer reviews. The influence of online customer ratings in the hospitality industry should be researched to fill existing gaps in the literature. Additionally, this study, will contribute to filling the gap between customer ratings and destination image. The findings of this study will provide hoteliers, event managers, and investors with insight into the impact of eWOM on different cities and, in turn, enable them to make more informed decisions related to their businesses.
CHAPTER 2. LITERATURE REVIEW
Most electronic word-of-mouth (eWOM) research has focused on the interaction between eWOM and customer behavior (e.g., Gretzel & Yoo, 2008; Liu, 2006; Mauri & Minazzi, 2013; Vermeulen & Seegers, 2009). The current research was conducted to add to the existing literature by focusing on the relationship between eWOM, in the form of TripAdvisor ratings, and lodging industry attributes and lodging property performance metrics. This literature review is divided into four primary sections: (a) word-of-mouth (WOM) in the hospitality industry, with a specific focus on the lodging segment; (b) eWOM, and its impact on travel-related products, especially in the lodging segment; (c) customer ratings and destination images that affects travel-related decisions; and (d) two hotel performance metrics—average daily rate (ADR) and occupancy—that are not only used to assess a firm’s operation but also to make forecasts and plans.
WOM in the Hospitality Industry
Westbrook (1987) defined word-of-mouth (WOM) as“…communications directed at
other consumers about the ownership, usage, or characteristics of particular goods and services or their sellers” (p. 261). Dickinger and Basu (1994) defined WOM as “…a volitional post-purchase communication by consumers” (p. 107). The importance of WOM has been widely researched. Westbrook (1987) highlighted that consumers are more likely to engage in WOM when they experience notable emotional experiences. Specifically,
consumers are more likely to voice their product experiences to other consumers to the extent that those experiences involve notable affective elements. A review of the literature has indicated that most people place a significant weight on other people’s opinions, so much so
that they may even ignore their own personal information (Banerjee, 1992). Consumer decision-making processes are strongly influenced by WOM from other consumers (Goldenberg, Libai, & Muller, 2001). WOM information influences consumer’s purchase decisions when WOM information is actively sought (Bansal & Voyer, 2000). People talk about their service-related experiences, specifically if the experiences were good or bad (Susskind, 2002). Kim, Han, and Lee (2001) highlighted the positive relationship between effective use of relationship marketing strategies, and repeat guests and positive WOM.
The nature of personal interactions is critical to understanding people’s behavior (Butcher, 2005). Brown and Reingen (1987) presented an analysis of WOM referral behavior on an interpersonal network perspective demonstrating different roles played by weak ties (acquaintances) and strong ties (close friends) in a natural environment. Results showed that weak ties would be more likely than strong ties to serve as bridges through which WOM referrals flows. By using actual WOM information, Liu (2006) examined the dynamic patterns of WOM and how it helps explain box office revenue in the movie industry. Results showed that WOM information offered significant explanatory power, which mainly
increases the awareness among potential consumers, for both aggregate and weekly box office revenue. A study conducted by Chevalier by Mayzlin (2006) of book sales and user reviews on Amazon.com and Barnesandnoble.com suggested that consumer WOM affects consumer-purchasing behavior. A study by Chen, Wu, and Yoon (2004) revealed that more recommendations are positively associated with book sales. Although positive reviews increase sales, negative reviews can still have a positive effect on boosting book sales (Berger, Sorensen, & Rasmussen, 2010). Research has shown that negative WOM has a greater effect on product attitudes, decisions, and judgments of other customers (Laczniak et
al., 2001). Positive WOM endorsement in university foodservice establishments has been shown to strengthen customer loyalty. It will in further improve the reputation for dining and increasing revenue (Kim, Ng, & Kim, 2009).
The influence of user reviews (e.g., Consumer Reports) is significant for experience goods, which are defined as products or services where product characteristics such as quality are difficult to observe prior to their consumption (Klein, 1998; Nelson, 1970; Pine & Gilmore, 1998). Lodging property services, or amenities, are examples of experience goods. Experience goods have a higher risk of uncertainty, which refers to the costs associated with unexpected outcomes tied to information asymmetry (Murray, 1991). Murray posited that services are more risky than goods, suggesting that consumers engage in comparatively less outright purchase of products high in service attributes and implying that extended
information acquisition may be preferred for services. Personal information sources (others recommendations or complaints) have a greater influence on purchase of services than purchase of products (Murray, 1991).
Service purchasers have greater confidence in personal sources of information as well as greater pre-purchase preference for personal information sources. Consumers tend to rely on WOM as a risk-reducing process to reduce their level of perceived risk and uncertainty (Klein, 1998). This concept is not unique to the hospitality industry. Researchers have illustrated the significance of WOM within a service context, especially for travel-related decisions (e.g., Crotts & Erdmann, 2000; Gretzel & Yoo, 2008; McCarthy, Stock, & Verma, 2010). According to Gretzel and Yoo (2008), travelers commonly use the comments of other consumers as information sources when planning travel. O’Neill et al. (2002) highlighted the positive relationship between visitors’ WOM recommendations and beverage sales. Shanka
et al. (2002) examined the intrastate travel behavior and perceptions of Western Australia University students. They found that a majority of Western Australians travel decisions were based on WOM communication. By using Hofstede’s model of cross-cultural differences to test if national culture influences consumers’ evaluation of travel services, Crotts and Erdmann (2000) found that those who share different cultures would pass along travel complaints via WOM. Additionally, leisure travelers typically use quantity sources for hotel information than do business travelers (McCarthy et al., 2010). Thus, WOM plays an
essential role in lodging industry.
Overview and Role of Electronic Word-of-Mouth Transformation
Along with the development of the Internet, Web 2.0, defined by O’Reilly (2007) as “…the network as a platform, spanning all connected devices” (p. 17), has transformed the way of information flows (Ye et al., 2011; O’Reilly, 2007). Online searching has become a main source of information (Chatterjee, 2001; Litvin et al., 2008). Electronic word-of-mouth (eWOM) has been defined by Litvin et al. (2008) as “…all informal communications directed at consumers through Internet-based technology related to the usage or characteristics of particular goods and services, or their sellers” (p. 461). Electronic WOM differs significantly from its offline form because it includes many-to-many communication since most eWOM is between strangers who do not necessarily share any social ties. Additionally, eWOM is much more voluminous in quantity than traditional WOM (Chatterjee, 2001). The speed and the breadth of distribution allows information broadcast widely through the Internet (Stringam & Gerdes Jr., 2010).
Use of Online Resources
An increasing number of travelers are using the Internet for travel planning and decision-making, especially by using travel-related social media websites such as
TripAdvisor.com, Expedia.com, Hotels.com, and Yelp.com (e.g., Cox, Burgress, Sellitto, & Buultjens, 2009; Litvin et al., 2008; McCarthy et al., 2010; Xiang & Gretzel, 2010). The share of U.S. Internet visits to travel websites was up 8% year-on-year in April, 2008 and travel subcategories, including travel parent category and destinations and accommodation, has experienced positive growth year-over-year (Hopkins, 2008). The importance of the travel-related use of social media websites has been widely studied in recent years (e.g., Fotis, Buhalis, & Rossides, 2012; Gretzel & Yoo, 2008; McCarthy et al., 2010; Xiang & Gretzel, 2010).
The use of travel-related social media websites by consumers commonly occurs prior to consumers’ actual travel (Cox et al., 2009). However, Fotis et al. (2012) revealed that some social media websites, such as TripAdvisor.com, are used during all stages of the travel planning process (before, during and after travel) for different demands. In their research, 65% of respondents stated that they made some form of change to their original plans
because of the exposure to online reviews on social media websites, regardless the valence of reviews. The study also examined the perceived level of trust among official tourism
websites and advertisements through mass media (i.e., TV or radio shows and documentaries, newspapers and magazines’ articles). The end results showed that comments made by other travelers on travel-related social media websites are trusted more than official tourism websites and travel agents.
Xiang and Gretzel (2010) noted the growing importance of social media websites for the process of gathering travel-related information. Specifically, they revealed that consumer review sites, such as TripAdvisor.com, are becoming an increasingly popular forum for online travelers to share their experience. Xiang and Gretzel (2010) have shown that social media websites play an important role of trip planning using a search engine. The percentage of consumers consulting reviews prior to their booking has steadily increased from 28% to 36% over two years. The number of reviews consumers read before they make their final choice is growing as well, increased from 3.71 visits to 4.72 visits per reservation over two years (Anderson, 2012).
Use of eWOM
Consumer reviews and ratings are the most accessible and prevalent form of eWOM (Chatterjee, 2001). More than 30% of Internet users have rated products online (Lenhart, 2006), and up to 70% of adults in the U.S. currently use consumer ratings and reviews (Forrester Research, 2006). Previous studies have illustrated that online reviews and ratings can influence travelers’ decision-making and have important implications for tourism firms in terms of brand building, product development, and quality assurance. (e.g., Dellarocas, 2003; Mauri & Minazzi, 2013; Nielsen Global Consumer Report, 2010; Pan, MacLaurin, & Crotts, 2007; Ye et al., 2011).
A study by Vermeulen and Seegers (2009) revealed that the exposure to online reviews would increase consumers’ awareness of hotels. Additionally, consumers’
consideration of a hotel was enhanced by exposure to both negative and positive consumer reviews. The persuasive effect of online reviews was stronger in lesser-known hotels than for
well-known hotels. Expert reviews did not make a difference regarding consumer attitudes toward hotels more than non-expert reviews. However, reviewer expertise had a moderating role in the decision making process to stay at a particular hotel.
Findings of a study by Gretzel and Yoo (2008) revealed that travel reviews play an important role in travel-related decision making. Online travel review readers use online reviews during different stages of their travel planning. Reading reviews can help travelers reduce risks and increase confidence in their purchase decision. Although reading reviews can be a time consuming process, it helps travelers making the purchase decision more efficient and more enjoyable.
Most TripAdvisor.com users think that reading the reviews to decide where to stay is extremely or very important (Gretzel & Yoo, 2008). Mauri and Minazzi (2013) revealed the persuasive effects of positive comments on the decision-making process, with online reviews influencing expectations and purchasing intentions of more than 75% of respondents who consulted other customers before booking a hotel. The results also revealed that eWOM is an antecedent of customer expectation. Findings of a study by Ye et al (2011) that focused on investigating the effects of eWOM on hotel online bookings indicated that online reviews have a significant impact on online hotel bookings and confirm the importance of eWOM for tourism firm performance.
Impact on the Lodging Industry
Findings of a study by Ong (2012) revealed that consumers tend to use online reviews and customer rating systems to help them narrow down their choice. Specifically, 47% of the respondents stated that they would use the customer rating system to narrow down their
choice in making a choice between multiple lodging properties and 21% of the respondents stated that they would use the customer rating system to make the final choice of where to stay. Anderson’s (2012) study on the customer review score after the purchase reveals that a 1-point increase in the customer review score will increase the chance of hotel being selected by 14.2 percent. Sparks and Browning (2011) pointed out that using categories or heuristics, such as “recent reviews” or “numerical ratings”, as indicators can assist consumers in efficient information processing and with a potential to influence decision-making. Using customer ratings as one of the independent variable in study, Sparks and Browning (2011) also found that positive framed reviews together with customer ratings will result in a significantly higher level of booking intentions and trust in the target hotel, compared to the reviews contained no customer rating. Using both quantitative (i.e., review scores) and qualitative reviews (i.e., customer reviews) provide a different perspective of word usage that impacts the travelers’ opinion (Stringam & Gerdes Jr., 2010).
Changes in online reviews are associated with the changes in sales (e.g., Ye et al., 2011). Beside the review scores, consumers pay attention to qualitative aspects of online reviews such as reviewer quality and reviewer exposure (Vermeulen & Seegers, 2009). Hu et al. (2008) noted that consumers have a stronger reaction to reviews on items that have less product coverage; that is, new online reviews are more informative when items have fewer pre-existing reviewers. Cezar and Öğüt (2012) collected the data for Paris hotels from www.booking.com for both domestic and international bookings, the number of domestic booking and international bookings, average room price, total number of customer reviews, average customer ratings, star rating, and local information as provided. Their findings illustrated that review volume is significant and negatively associated with the domestic
sales, regardless of the valence of reviews. Their findings also revealed that customers’ rating score might be (higher) lower although hotels has a higher (lower) performance in terms of services offered to customer.
Effect of Customer Rating on Tourism
Studies have revealed that people tend to rely on shortcuts and easy-to-process information, such as customer ratings, to make evaluations or decisions when they are faced with a large quantity of information (Fiske & Taylor, 1991; Sparks & Browning, 2011). Drawing on a personal perception aspect, it may be possible that customers use categorical thinking processes when making sense of information in order to make evaluations (Sparks & Browning, 2011). Van Schaik and Ling (2009) noted that an easy information processing approach is preferred when the customer is in a goal-orient mode (i.e., online booking) in online contexts. Customers use evaluations by others as an indicator of product quality (Park & Lessig, 1977). Thus, customer ratings tend to be quite influential in product choice (Chen, 2008). Additionally, Tsang and Prendergast (2009) showed that customer ratings, as the independent variable in the study, could provide potential customers with a shortcut to assess a product and influence their purchase attention.
Previous research has highlighted that rating valance is significantly associated with initial sales (Basuroy, Chatterjee, & Ravid, 2003). Anderson (2012) reported on the impact of social media on lodging performance, highlighting the result that a 1-point increase in user review rating (on a 5-point scale) will enable a property to increase its room price by 11.2% and maintain the same occupancy or market share. Similarly, Ye et al. (2011) suggested that a 10% improvement in a reviewer’s rating can increase sales by more than 5%. Additionally,
a higher variance in ratings does not hurt online bookings for a hotel, which implies that travelers take the overall opinion into account, not only the good ones (Ye et al., 2011).
From the aspect of tourism, customer ratings may be influential in destination choice. Destination image may be formed in the mind of customers based on the information that customers have provided qualitatively (recommendations, customer reviews, etc.) and
quantitatively (customer ratings). Destination image has been defined by Crompton (1979) as “…the sum of beliefs, ideas, and impressions that a person has of a destination” (p. 18). Previous studies have indicated that destination image plays two roles in customer behaviors that not only influence the destination choice decision-making process (e.g., Crompton, 1979; Crompton & Ankomah, 1993; Mayo, 1973), but also condition the after-decision-making behaviors, such as satisfaction, intention to revisit, and willingness to recommend (e.g., Bigne, Sanchez, & Sanchez, 2001; Chen & Tsai, 2007; Chi & Qu, 2008). This implies that destination image is not limited to the stage of selecting the destination, but also affects the behavior of tourists in general (Bigne et al., 2001)
Based on the path of destination image that Bigne et al. (2001) proposed, destination image → quality → satisfaction → post-purchase behavior, destination image is believed to affect a tourist’s choice of destination since the nature of the travel destination products are intangible (e.g., Chen & Hsu, 2000; Chon, 1990; Tasci & Gartner, 2007). Chen and
Kerstetter (1999) suggested that destination choice is related to its positive overall image. They postulated that travelers choose one destination over another only when its positive image aspects exceed its negative image aspects. Moreover, Chen and Hsu (2000) proposed that distinctive images of destinations with different style from travelers’ everyday life style should be highlighted to raise interest in visiting. Different components and dimensions of
destination image were proposed to influence customer decision-making. Additionally, some researchers suggested that evaluative images are influential in discretionary trip-making behavior than descriptive image do (Crompton, 1979; Tapachiai & Waryszak, 2000).
Hotel Performance Characteristics
Venkatraman and Ramanujam (1986) proposed three dimensions of a firm’s success: the financial, operational, and organizational dimensions. Prices and occupancy are two of the commonly used indicators that stakeholders use for operationalizing the three dimensions (Sainaghi, 2011). Average daily rate, which is often referred to by the acronym ADR, is one of the commonly used financial indicators in the lodging industry to measure the quality of revenue per room relative to the number of rooms actually sold (Vallen & Vallen, 2009). It has been ranked as the first crucial operating indicator by lodging executives (Singh & Schmidgal, 2002). Additionally, it is one of the valuable top-line financial indicators for hospitality executives and managers (O’Neill & Mattila, 2006). ADR is a reliable predictor of hotel sale price (O’Neill, 2003). The equation for calculating ADR is:
Occupancy is one of the commonly used indicators and is used to measures the hotel’s “share of the market” (Vallen & Vallen, 2009). Jeffrey and Barden (2000) suggested that “…room occupancy offers greater credence from a managerial point of view” (p. 385). ADR and occupancy are the foundation of a property’s financial performance (Reid & Bojanic, 2009). The equation for calculating occupancy is:
Summary
This review of literature provided an overview of the relationship between WOM and service industry firms, especially those in the lodging segment of the hospitality industry. Prior research on the lodging industry related to eWOM was reviewed. Customer ratings and destination image toward tourism were also discussed to provide an overview of how eWOM can influence destinations and travel-related purchase decisions. Finally, two hotel corporate performance indicators (ADR and occupancy) were addressed. The next chapter will discuss the methodology that was undertaken in this research study.
CHAPTER 3. METHODOLOGY Introduction
This study analyzed the relationship that two commonly used hotel performance indicators (ADR and occupancy) and lodging market attributes (total lodging properties in a city) have with the lodging destinations ratings found on TripAdvisor.com. This chapter discusses the population and sample used in this study, and the procedures used for data collection and analysis.
Population and Sample
The population of this study was the lodging industry in the United States. For this study, due to the accessibility, availability, and cost, it was not feasible to collect and analyze the information pertaining to the entire population. Thus, a sample was utilized to address this limitation, as is common in social science research. The sample was comprised of data from the top five lodging markets in the United States, based on their overall size and performance according the Smith Travel Research (STR). STR, one of the hospitality industry’s top data collection and analytics firms, has a proven track record of providing valid and reliable data for academic researchers looking to study large samples of the lodging industry.
The sample cities (markets) used in this research were: Los Angeles-Long Beach, CA; Washington, DC; Orlando, FL; Chicago, IL; and New York, NY. Although Las Vegas, NV is in the top five U.S. markets, it was omitted due to the unique industry characteristics of the casino industry. Thus, in actuality, the markets used in this sample were from the top six. While casinos are not unique to Las Vegas, the large quantity of them in Las Vegas meant
that the metrics for occupancy and ADR become outliers when compared to other
destinations (markets) that lack the casino infrastructure of Las Vegas. For example, Chicago, IL has several casinos in the areas outside of the downtown area, but most of these do not have a lodging component and are a fraction of the size of those found in Las Vegas.
Secondary Data
Secondary data were used for analysis in this study. Secondary data are those which have not been collected with a specific research purpose and are commonly collected for management-related activities, control functions, and research use in many fields (Hearst & Hulley, 1988; Sørensen, 1992). Secondary data are not gathered by the researcher but by secondary parties, such as governments, commercial firms, the press, or other academic researchers.
In the case of this research, data were collected from two primary sources: STR and TripAdvisor.com. The data from the STR dataset were collected directly from individual properties in a respective market (called a “competitive set” by STR). STR represents one of the most valid and reliable sources of accessible lodging industry performance metrics. STR tracks, among other things, lodging industry supply, demand and performance data from lodging properties in more than 160 countries. Like other collegiate hospitality programs, researchers from Iowa State University have a well-established history of using STR data in their scholarly activities.
Academic research advocates the use of secondary data for research and analysis (e.g., Kiecolt & Nathan, 1985; Rew, Koniak-Griffin, Lewis, Miles, & O’Sullivan, 2000; Sørensen, Sabroe, & Olsen, 1996; Wunsch, Harrison, & Rowan, 2005). The main advantage
of using secondary data for research is the cost reduction since the data already exist (Sørensen et al., 1996), and are generally less expensive when compared to primary data (Cowton, 1998). Time reduction is also another advantage of using secondary data. Compared to the primary data, Cowton (1998) noted that “...secondary data may have
attributes which render them highly attractive when compared to interview and questionnaire results” (p. 432).
There are, however, some disadvantages to using secondary data for research
analysis. One limitation is that control of the data is limited (Sørensen et al., 1996). Cowton (1998) posited, “…the researcher is unable to exercise any control over their generation” (p. 428). This makes it difficult to ensure that all research methods are validated. One way to alleviate this concern is to ensure the researcher’s data are from validated and reliable sources such as government agencies and commercial firms such as STR.
Although using secondary data is an attractive proposition, sometimes the expense of using it can be quite high (Cowton, 1998). Some online services for commercial use may charge expensive fees for using their data. Additionally, timeliness may be a problem when using secondary data since the data may no longer be of relevance.
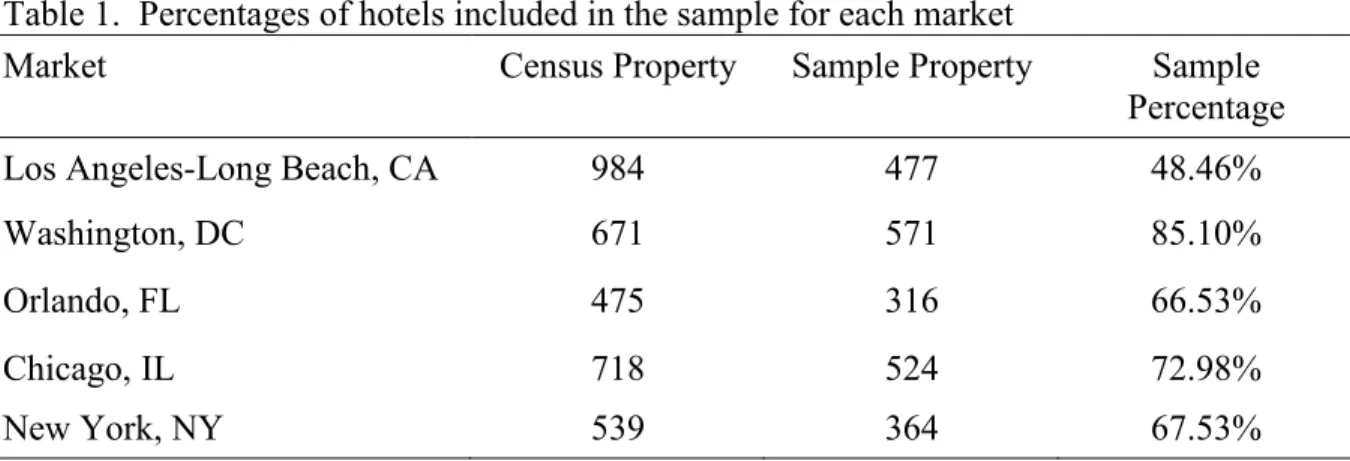
For this current research study, the researcher countered these limitations by ensuring the following. First, the data were recent. The analytics data provided by STR represent information collected recently (from January, 2010 to December, 2012). Additionally, STR, through their partnerships with the lodging industry, is able to collect performance data from a clear majority of lodging properties in a respective market. Table 1 provides the
Sample Collection
This study was designed to investigate the presence of relationships for multiple independent variables and the TripAdvisor.com ratings for the top 100 highest ranked lodging property ratings for specific markets (cities) in the United States. The STR dataset contains occupancy, ADR, RevPAR, supply, demand, room revenue, census properties, census rooms, sample properties, and sample rooms for each city for each month over a three-calendar-year (from January, 2010 to December, 2012). Table 2 summarizes the variables, and their definitions, provided in the STR dataset. For the lodging property’s ranking, a summary of the top hundred hotels in each city from the ranking index on TripAdvisor.com was recorded manually on Jan. 22th, 2014. To represent the dependent variable, the accumulative customer rating of the top 100 highest ranked hotels from the top five lodging markets was collected. In TripAdvisor.com, the rating is presented on a 5-point scale at .5 intervals (i.e., .5, 1.0, 1.5, etc.).
Table 1. Percentages of hotels included in the sample for each market
Market Census Property Sample Property Sample
Percentage
Los Angeles-Long Beach, CA 984 477 48.46%
Washington, DC 671 571 85.10%
Orlando, FL 475 316 66.53%
Chicago, IL 718 524 72.98%
Variables
In order to investigate the relationship among lodging property performance and total lodging properties, 8 independent variables were selected from the default variables provided in the STR dataset. The independent variables and their definitions are provided in Table 2. Table 2. Independent variables and their definitions
Independent variable Definition
Occupancy Percentage of available rooms that were sold during a
specified period of time. ADR (Average Daily
Rate)
Average rate paid for rooms sold; calculated by dividing the total guest room revenue by the number of guest rooms sold. RevPAR (Revenue Per
Available Room)
Total guest room revenue divided by the total number of available guest rooms.
Supply Total number of lodging property’s rooms available.
Demand Total number of lodging property’s rooms occupied.
Room Revenue Total room revenue generated from the sale or rental of
rooms.
Census Property Total number of lodging property in a particular market.
Census Rooms Total number of lodging property’s rooms in a particular
market.
Hypotheses
Three independent variables were selected to determine which independent variables have a significant relationship with the overall ratings of lodging properties found on
TripAdvisor.com (dependent variable Y), and whether those independent variables are the predictors toward the overall ratings of lodging properties on TripAdvisor.com (dependent Y). Previous research has used both the RevPAR and ADR as independent variables upon a property’s performance (e.g., Ismail, Dalbor, & Mills, 2002; Chen, Koh, & Lee, 2011). This
research did not use both; rather it focused on ADR since it is one of the most commonly cited metrics of hotel performance.
Additionally, ADR is the one of the variables that drives RevPAR. In other words, if ADR increases, then RevPAR also increases. It is unnecessary to have both variables as the independent variables in the regression analysis. Based on the fact that ADR and occupancy are both popular metrics of hotel performance throughout the literature, they were selected in the model as independent variables to determine whether they can predict the overall ratings of lodging properties (dependent Y). The total number of lodging properties was also selected in the model as an independent variable based on its robust effect in a bivariate analysis. The following regression model and corresponding hypotheses is proposed for analysis:
In this model, μ is the intercept of Y, X1 is the log ADR of the property, β1 is the coefficient
(slope) of X1, X2 is the log occupancy percentage of the property, β2 is the coefficient (slope)
of X2, X3 is the total number of lodging property in a city (market), β3 is the coefficient
(slope) of X3, and ε is the notation for the model deviations. Additionally, H0 is the null
hypothesis and H1 is the alternative hypothesis:
H0: The mean rating of lodging property in the five top cities (markets) that examined on
TripAdvisor.com cannot be predicted by the log ADR, log Occupancy, and Census Property
H1: The mean rating of lodging property in the five top cities (markets) that examined on
TripAdvisor.com can be predicted by the log ADR, log Occupancy, and Census Property
Data Analysis
All data analyses were run in SPSS (version 21.0). Before formal analysis, data were screened for accuracy of data entry, normality of distribution, and outliers. Histograms were examined for evidence of problematic departures from normal distributions and data were transformed if needed. Bivariate effects were conducted attempting to investigate the most impactful variable(s).
The hypothesis was tested using regression analysis. Regression analysis attempts to isolate the independent variable that has a significant relationship with the overall rating of lodging property and to determine whether ADR, occupancy, and total hotel properties in a market are the predictors toward hotel property ratings on TripAdvisor.com (see Figure 1).
Figure 1. Graphic representation of the variables used in Hypothesis ADR
Occupancy TripAdvisor Hotel
Rating
Total Hotel Properties in
Summary
This chapter discussed the methodology used to conduct this study. Data were collected from STR and TripAdvisor.com and analyzed by utilizing quantitative analysis. Ratings of the top 100 highest ranked lodging property in top five markets were collected. Occupancy, ADR, RevPAR, room revenue, supply, demand, census property, census rooms, sample property, and sample rooms were also collected. The hypothesis used to predict hotel ratings was also presented. The next chapter will examine the results of the data analysis.
CHAPTER 4. RESULTS Introduction
This study analyzed the relationship that two commonly used hotel performance indicators (ADR and Occupancy) and lodging market attributes (total lodging properties in a city) have with the lodging destinations ratings found on TripAdvisor.com. This chapter is divided into five sections:
1. Background on reliability and validity;
2. Summary of the descriptive data that pertain to the five individual cities (markets). It provides an introduction of the five markets, which will assist in interpreting
implications discussed in the following chapter;
3. Examination of the variation of lodging property ratings;
4. Bivariate effects between lodging property rating and each independent variable; and 5. Findings based on the hypothesis.
Reliability and Validity
According to Zikmund (2002), the term reliability refers to a level by which measures are free from errors and therefore produce consistent results. The secondary data in this research were obtained from two sources: TripAdvisor.com and STR. Both organizations are well known throughout the hospitality industry for their credibility. Based on this, the data used in this research appear to be reliable and accurate.
Zikmund (2002) also indicated that reliability is necessary to ensure validity. Content validity, also referred to as face validity, is achieved by conducting pilot studies in hopes of developing a scale that is actually measuring what it is intended to measure. Due to the
secondary nature of this data, it was not possible for the researcher to independently ensure content validity of the survey.
Descriptive Data Summary
Table 3 through Table 7 provide the detailed descriptive data for each of the five markets analyzed from STR dataset in this research. The results of these descriptive statistics show both similarities and differences between the five markets. These descriptive statistics also provide an overview of how similar and different the markets are from one another based on various metrics and market characteristics.
Census Property, Census Rooms, ADR, Occupancy, and RevPAR
Los Angeles-Long Beach had the largest average census property total, with 984 hotels (29.05%) among the five markets, while Orlando had the lowest average census property total, with 475 hotels (14.02%). Orlando had the largest average census rooms with 118,057 (22.42%) among the five markets, while Los Angeles-Long Beach had the least average census rooms with 97,330 (18.48%). This implies that, while Los Angeles may have more hotels, the hotels in Orlando are on average, larger.
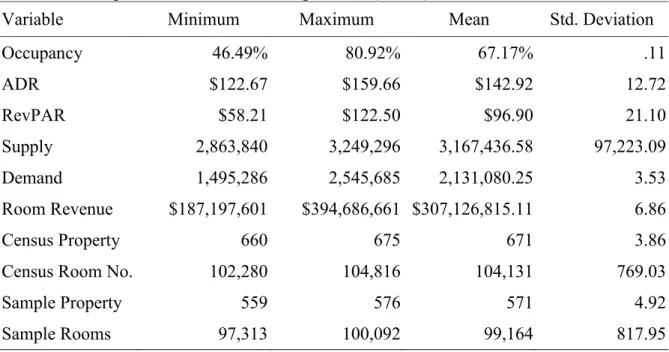
New York has the highest average price with $239.94 a room per night, while
Orlando has the lowest average price with $93.66 a room per night. Additionally, New York has the highest average occupancy percentage with 81.78% and Chicago has the lowest average occupancy percentage with 64.11%. Moreover, New York has the highest average RevPAR with $197.96 and Orlando has the lowest average RevPAR with $62.93.
Table 3. Descriptive statistics for Los Angeles-Long Beach, CA (n=100)
Variable Minimum Maximum Mean Std. Deviation
Occupancy 58.53% 83.84% 71.61% .07 ADR $110.84 $136.25 $123.11 6.98 RevPAR $64.88 $114.23 $88.50 12.49 Supply 2,716,336 3,037,163 2,960,411.67 85,342.05 Demand 1,753,667 2,527,596 2,119,962.67 2.07 Room Revenue $196,251,084 $342,131,991 $261,992,026.28 3.78 Census Property 981 988 984 1.84
Census Room No. 96,472 97,983 97,330 480.07
Sample Property 472 479 477 1.76
Sample Rooms 72,572 74,222 73,609 495.79
Table 4. Descriptive statistics for Washington, DC (n=100)
Variable Minimum Maximum Mean Std. Deviation
Occupancy 46.49% 80.92% 67.17% .11 ADR $122.67 $159.66 $142.92 12.72 RevPAR $58.21 $122.50 $96.90 21.10 Supply 2,863,840 3,249,296 3,167,436.58 97,223.09 Demand 1,495,286 2,545,685 2,131,080.25 3.53 Room Revenue $187,197,601 $394,686,661 $307,126,815.11 6.86 Census Property 660 675 671 3.86
Census Room No. 102,280 104,816 104,131 769.03
Sample Property 559 576 571 4.92
Table 5. Descriptive statistics for Orlando, FL (n=100)
Variable Minimum Maximum Mean Std. Deviation
Occupancy 50.24% 82.47% 66.81% .07 ADR $77.57 $109.25 $93.66 8.07 RevPAR $38.97 $89.46 $62.93 11.40 Supply 3,291,008 3,712,126 3,590,919.03 1.05 Demand 1,787,071 3,005,551 2,395,718.17 2.66 Room Revenue $138,623,305 $325,998,668 $225,720,838.03 3.99 Census Property 472 480 475 2.79
Census Room No. 117,286 119,746 118,057 542.96
Sample Property 308 321 316 3.54
Sample Rooms 76,288 82,447 79,877 1,630.80
Table 6. Descriptive statistics for Chicago, IL (n=100)
Variable Minimum Maximum Mean Std. Deviation
Occupancy 39.10% 80.86% 64.11% .12 ADR $86.32 $147.05 $116.50 16.02 RevPAR $33.75 $114.15 $76.28 22.19 Supply 2,985,164 3,350,945 3,272,721.69 96,635.71 Demand 1,301,329 2,615,887 2,102,011.44 4.01 Room Revenue $112,332,935 $372,326,684 $250,014,085.81 7.39 Census Property 712 724 718 3.26
Census Room No. 106,613 108,116 107,594 360.87
Sample Property 519 527 524 2.31
Table 7. Descriptive statistics for New York, NY (n=100)
Variable Minimum Maximum Mean Std. Deviation
Occupancy 63.06% 89.03% 81.78% .07 ADR $183.75 $295.64 $239.94 38.07 RevPAR $117.14 $260.89 $197.96 42.82 Supply 2,596,860 3,232,680 3,028,809.78 1.43 Demand 1,825,699 2,863,586 2,481,467.47 2.86 Room Revenue $336,231,292 $839,092,909 $602,536,178.11 1.44 Census Property 503 568 539 18.34
Census Room No. 92,590 104,280 99,568 3,478.78
Sample Property 324 391 364 20.40
Sample Rooms 76,111 87,921 83,260 3,689.03
Variation in Lodging Property Ratings
The histogram of the distribution of hotel ratings from TripAdvisor.com illustrates that the data are normally distributed (see Figure 2). From the histogram of the distribution of all hotel ratings, there is very little variation in the total sample. Upon further investigation, the sample of 100 hotels from each city (500 total) only provided a variance from 3.5 – 5 stars. This is not that unusual since the top 100 highest ranked hotels for each market were analyzed. Thus, there is only a slight variance in the top 100 highest ranked hotel ratings by city.
Due to the rating scale that TripAdvisor has adopted (1-5, with increments of .5) most lodging properties are mostly clustered at either 4 stars or 4.5 stars. Approximately 40% of lodging properties received 4 stars, while more than 50% of lodging properties were rated 4.5 stars. In the sample, lodging properties that were rated 3.5 stars or 5 stars ratings are very rare,
with less than 10% in the total sample. From one point of view, this is not a good thing to see. Larger variation in hotel ratings could provide researchers with a greater opportunity to
explain variations in hotel ratings. With such limitation, it can be difficult for the researcher to identify the causes of ratings. This will be discussed in more depth in the final chapter.
Figure 2. Graphic representation of distribution of hotel rating (stars) for all cities
The box-plots of the distribution of hotel ratings on TripAdvisor.com (see Figure 3) show the ratings for each city. It shows the means and the rating ranges for the top 100 highest ranked lodging properties in each city as well as the outliers if it has. There are three interesting findings from this figure.
The first one is Chicago and Washington, DC share the same rating range and interquartile range within the sample. The ratings for Chicago and Washington, DC range
from 3.5 stars to 5 stars on a 5-point scale with .5 intervals, as well as the interquartile range from 4 stars to 4.5 stars on a 5-point scale with .5 intervals. This may reveals that both cities share some common characteristics. The second one is Los Angeles and New York both have so little variation in the interquartile range identified by the right and left side of the boxes, which means there is no box or whiskers revealed in the figure. Specifically, the interquartile range for Los Angeles identified at 4 stars with outliers plotted at 3.5 stars and 4.5 stars. This means that the majority of ratings for Los Angeles top 100 highest ranked lodging properties are 4 stars and very few lodging properties have been rated at 3.5 stars or 4.5 stars.
Moreover, there is no lodging property has been rated at 5 stars. The interquartile range for New York identified at 4.5 stars with outliers plotted at 4 stars and 5 stars. In other words, the majority ratings for New York’s top 100 highest ranked lodging properties were 4.5 stars and very few lodging properties have been rated at 4 stars or 5 stars. In addition, there is no lodging property has been rated at 3.5 stars. In the third plot, for Orlando, there is no whisker revealed in the figure, with only a box range from 4 stars to 4.5 stars on a 5-point scale with .5 intervals. This means that the entire ratings sample for the top 100 highest ranked lodging properties in Orlando have two possible outcomes, either 4 stars or 4.5 stars.
Figure 3. Graphic representation of distribution of hotel rating (stars) for each city
It becomes clear that greater variation exists by location. In Los Angeles-Long Beach and New York, virtually no variation exists in the top 100 highest ranked hotel TripAdvisor rating, unlike Chicago, Orlando, and Washington D.C., where a variation, although minimal, exists.
To further explain the differences in rating among the five cities, the rating has been regressed on a dummy variable for four of the cities to determine how different these four cities are from the dummy variable. In this case, New York is selected as it has the highest ratings among the cities. By setting New York as the reference group, results show how differences the four cities are from the New York (see Table 8). The _cons is the average rating for New York. The coefficients for each of the four cities show how different each city is in its average rating, compared to New York. The Los Angeles-Long Beach market has the most different rating with an average rating of .51 points below New York. For a comparison,
Orlando is the most similar market with only an average rating of .155 points below New York.
Table 8. Regressed rating on Chicago, Los Angeles-Long Beach, Orlando, and Washington, DC
City Coefficients
_cons (New York) 4.505
Orlando -.155
Chicago -.275
Washington, DC -.35
Los Angeles-Long Beach -.51
Variations among Independent Variables versus Lodging Property Ratings In order to provide greater detail pertaining to each of the independent variables versus the hotel rating, a bivariate effect analysis was conducted (see Table 9). This table represents the p-value and R2 for each independent variable against the hotel rating. By
comparing the p-value, which is a simple way of seeing if the variables have a statistically significant effect on ratings, between different independent variables, some interesting points reveal themselves.
Six variables -- (1) Log of Occupancy; (2) Log of ADR; (3) Log of RevPAR; (4) Log of Room Revenue; (5) Census Property and (6) Demand -- have a statistically significant impact on hotel ratings since the p-values are less than .05. The impacts of other variables Supply and Census Rooms are not significant against hotel ratings since their p-values are equal or larger than .05.
Based on these findings, comparing the R2, which indicates the proportion of the
variation on ratings that is explained by the independent variables, the researcher could identify the most impactful variable (see Table 8). Census Property, which is the total number of lodging properties in a particular market, is the most impactful variable with a R2
value of .221. This implies that 22.1% of the variability in hotel ratings is explained by Census Property.
Table 9. Bivariate effects
Variables p-value R-squared
Log of Occupancy 0.093 0.006
Log of ADR 0.000 0.041
Log of RevPAR 0.000 0.029
Log of Room Revenue 0.000 0.045
Supply 0.050 0.008
Demand 0.000 0.028
Census Property 0.000 0.221
Census Rooms 0.151 0.004
Regression Model
Prior to running the regression, the assumptions were verified. There are four
principle assumptions that justify the use of regression models for the purposes of predictions: (1) linearity of the relationship between dependent and independent variables; (2)
independence of the errors (no serial correlation); (3) constant variance of the errors (homoscedasticity); and (4) normality of the error distribution.
Linearity
The relationship between dependent and independent variables represents the degree to which the change in the dependent variable is associated with the independent variables. The Variance Inflation Factor (VIF) is an indicator that multicollinearity is present in the multiple regression models. The VIF is as a rule of thumb that a value will be equal to 1 if a set of explanatory variables is uncorrelated. A higher value of VIP (exceeding 10 and above) are not desired by researchers, which indicates collinearity exist in the model. The VIF for the variables are listed below (see Table 10). Because the VIF values are around 1, and don’t exceed 10, the assumption is met.
Table 10. Variance inflation factor (VIF) of the variables
Model VIF (Constant) Census Property 1.051 Log ADR 2.609 Log Occupancy 2.554 Independence of Errors
It is assumed that each predicted value is not related to any other prediction. The Durbin-Watson test was used for testing the independence. The Durbin-Watson statistic is always between 0 and 4. There is no autocorrelation in the sample when Durbin- Watson statistic is equal to 2. The result shows that the Durbin-Watson statistic is equal to 1.885, which means that the sample is independent, and thus this assumption is met.
Normality
Normality identifies if the means of the distribution of a dependent variable is normal. To test normality, a histogram was run on the dependent variable (see Figure 4). The result of the histograms shows that the data for the dependent variable of “rating” is normally
distributed and thus this assumption for dependent variable is met.
Histograms were also conducted on independent variables (see Figure 5, 6, & 7). The results of histograms only show that the data for independent variable “Census Property” is normally distributed. Both histograms for independent variable “ADR” and “Occupancy” are positively skewed, which means a few large outliers exist in these two variables. Thus, log transformations of these two variables were undertaken to fix these problems.
Figure 5. ADR variable non-normality histogram
Figure 7. Census Property variable normality histogram
After the log transformation, the results of histograms show that both Log ADR and Log Occupancy are distributed normally (see Figure 8 & 9) and, thus, the assumption for independent variables is met. It should be noted that, although the histogram for the Log Occupancy variable is slightly skewed to the right, it does still indicate a normal distribution.
Figure 8. Log ADR variable normality histogram
Equality of Variance
Equality of Variance is used to determine if different response variables have the same variance in their errors, regardless of the predictor variables values. Once the assumption of normality was met the assumption of equality of variance was tested. The initial tests of equality of variance were not met through the interpretation by a Levene’s test. Because of this, an additional Breusch-Pagan test was run to verify this assumption (see Table 11). The Breusch-Pagan statistical significance tests for the null hypothesis that the variances are equal. Since the Chi-squared test is significant (﹤.05), the null hypothesis was rejected in favor of unequal variances. Because of the unique attributes of our variables, this was to be expected.
Through this test, as well as the scatterplot (see Figure 10), it can be observed that there is less spread in the errors around the four stars than around 4.2, and there is also less spread around values at 4.5. This fact has much more to do with such a small range of variance on the TripAdvisor.com hotel ratings (3.5-4.5) in the top 100 values for each of the 5 markets. Essentially, the ratings are a very limited set of categories (3.5, 4, 4.5…) and, yet, this research is treating them as though it was a continuous variable. Because of this, this research can still proceed with the running of a regression analysis
Table 11. Breusch-Pagan test for heteroscedasticity
Test Statistic value Sig.
Figure 10. Scatterplot result of regression
Regression Results
The regression results are shown in Tables 12, 13, and 14. Table 12 presents the R2
result. The study’s multiple linear regression model has an R2 of .242 and adjusted R2 of .237.
Note that R2 is the proportion of variation in ratings that is explained by the Log of
Occupancy, Census Property, and the Log of ADR. A value of .242 suggests that 24.2% of the variability in rating is explained by those three variables, which is acceptable in social science research.
Table 12. Hypothesized model
Model R-Squared Adj. R-squared
Table 13 presents the ANOVA on regression. The regression model was found to be significant since F (3,496) = 52.736, P﹤.05. Therefore, the null hypothesis was rejected. This means that the variables Log of ADR, Log of Occupancy, and Census Property can be used to reliably predict the mean rating of lodging property on TripAdvisor.com in those five top markets (cities).
Table 13. ANOVA (n=500)
Sum of Squares df Mean Square F Significance
Regression 12.997 3 4.332 52.736 .000
Residual 10.748 496 .082
Total 53.745 499
Table 14 presents the summary of regression analysis for variables predicting hotel rating. The first variable (constant) represents the constant, which is the predicted value of a hotel’s rating when all other variables are 0. Column Beta contains the values for the
regression equation for predicting the dependent variable from the independent variables. Based on these results, the regression equation should be presented as:
Table 14. Summary of regression analysis for variables predicting hotel rating (n=500)
Variable Beta t Significance Std. Error
(Constant) 4.525 10.671 .000 .424
Census Property -.001 -11.012 .000 .000
Log of ADR .232 3.206 .001 .072
With a 2-tailed test and alpha of .05, it can be seen that both Census Property and Log of ADR have a value that is below .05. This implies that the coefficients of Census Property and Log ADR are significantly different from 0. Additionally, the impact of Census Property (number of hotels in a city) and Log of ADR on the markets ratings is statistically significant in the model. However, Log Occupancy was not found to be statistically significant in the hypothesized model since the p-value of the Log Occupancy equals to .175 which is above .05. In other words, the coefficient of the Log Occupancy is not significantly different from 0.
The coefficient for Census Property equals -.001 means that for every increase of one unit on the total number of lodging properties, the rating score is predicted to be lower by .001 units. Additionally, the coefficient for Log ADR equals .232. This means that for every unit increase in ADR, there is a .232 unit increase in the predicted rating, holding all other variables constant.
Summary
This chapter discussed the results derived from the data analysis. A total number of 500 lodging property rankings across five cities were analyzed. This information was used as part of a regression with three independent variables: Log ADR, Log Occupancy, and Census Property. Hypothesis testing was completed based on the research questions. The next
CHAPTER 5. DISCUSSION
This chapter presents a summary of the research and discussion based on the findings. Limitations of this study are presented, as well as recommendations for future research.
Findings
This study was conducted to ascertain the potential relationship between eWOM and lodging industry characteristics and performance metrics. It is important to note that
customer ratings, as one of the most accessible and prevalent forms of eWOM, is the first impression of a hotel or destination, in this case one of the five cities examined. Research has indicated that customers tend to rely on a categorical thinking approach when making travel decisions online (Sparks & Browning, 2011). Customer ratings could be viewed as an important competitive advantage for early adopters, which can indicate a strong case for selecting a hotel or destination to travelers. Easy-to-access and easy-to-process information requires the systems to be designed and developed in a way that makes customer ratings available and accessible.
Based on the results of this study, it is important to note that hotel customer ratings vary by locations. For this reason, differences in performance and market characteristics exist between cities. For example, there are a lot of luxury lodging properties that exist in New York, which will increase the average rates, and RevPAR. Orlando caters to families visiting the Disney theme parks, thus their average rates will be lower. This has an impact on the destination image in the minds of the customers, and will likely have an impact on their destination choice. Compared to a city with lower ratings, customers may be more willing to
visit a destination with high ratings, which they feel to be more attractive, interesting, or friendly.
The regression analysis results highlight that ADR and the total number of hotels a city can impact a market’s TripAdvisor ratings. The regression equation revealed that the ADR has a positive relationship with ratings, which means the higher the hotels nightly rate (ADR), the higher the average ratings will be. This result confirms the result by Anderson (2012) that there is a positive relationship between ADR and hotel customer ratings.
From the regression equation, the relationship between the total number of hotels and the TripAdviosor.com ratings is slightly negative. This indicates that the more hotel
properties that a market (city) has, the lower the overall ratings, while minimal. The total lodging property number could reflect the size of the city. The larger the city is, the more lodging properties it would traditionally have (i.e., New York, NY vs. Ithaca, NY).
According to Ye et al. (2011), hotels in larger cities tend to have more bookings. Thus, the more total lodging properties the city has, the more the bookings it supposed to have. Building more hotels, especially those with a high daily rate, will also have a higher average ratings.
If visitor’s bureaus or tourism boards are looking for a relatively higher overall
TripAdvisor rating, there are lots of methods they could take to accomplish this. Based on the findings of this research, one variable in particular, the nightly hotel rate of hotels has a positive correlation with consumers TripAdvisor ratings. Focusing on occupancy of a hotel, does not have a significant correlation with the change in consumer TripAdvisor ratings, although this was cited in the literature as being a common metric of industry performance. If
the goal is to get a higher rating on TripAdvisor, stakeholders, such as owners and managers, should possibly reconsider the weight they put on the metric of occupancy.
This does not imply that occupancy is a useless statistic in measuring performance. It is still a good indicator of how successful Sales & Marketing teams are in attracting guests to a hotel. Additionally, research has shown that higher hotel occupancy drives revenues in non-room revenue centers such as those found in foodservice (restaurants, in-non-room dining, mini-bar), retail (gift shops), and recreation (spa and golf). Simply put, the industry adage of “put more heads in beds” still applies, although this research shows that stakeholders should be aware that occupancy may not have a strong impact, compared to nightly rate, on elevating TripAdvisor ratings.
The literature has shown that eWOM has an influence on travel decisions. Consumers are more willing to purchase a product that has favorable or high ratings on user generated review sites like TripAdvisor. As a hotel owner or managers, if their objective is to get higher consumers TripAdvisor rating, and in turn, increase the chances that consumers will want to stay with them, this research has revealed some interesting findings. First, contrary to popular belief, occupancy may not highly correlate with consumer TripAdvisor ratings, although it's commonly used to measure a hotels performance. If a stakeholder’s objective is to get their hotel property a higher rating, they may actually want to instead be focused on the change in nightly room rate. This study has shown that hotels with a higher room rate could lead to a higher TripAdvisor rating, which means people will perceive the hotels as better products through eWOM.
Many hotels in the lodging industry, as well as cities as a whole, experience a fluctuation in demand. This fluctuation is commonly referred to as seasonality. In this