University of Wollongong University of Wollongong
Research Online
Research Online
University of Wollongong Thesis Collection
2017+ University of Wollongong Thesis Collections
2017
Data mining based strategies for building performance assessment
Data mining based strategies for building performance assessment
Rui YanUniversity of Wollongong
Follow this and additional works at: https://ro.uow.edu.au/theses1
University of Wollongong University of Wollongong
Copyright Warning Copyright Warning
You may print or download ONE copy of this document for the purpose of your own research or study. The University does not authorise you to copy, communicate or otherwise make available electronically to any other person any
copyright material contained on this site.
You are reminded of the following: This work is copyright. Apart from any use permitted under the Copyright Act 1968, no part of this work may be reproduced by any process, nor may any other exclusive right be exercised, without the permission of the author. Copyright owners are entitled to take legal action against persons who infringe
their copyright. A reproduction of material that is protected by copyright may be a copyright infringement. A court may impose penalties and award damages in relation to offences and infringements relating to copyright material.
Higher penalties may apply, and higher damages may be awarded, for offences and infringements involving the conversion of material into digital or electronic form.
Unless otherwise indicated, the views expressed in this thesis are those of the author and do not necessarily Unless otherwise indicated, the views expressed in this thesis are those of the author and do not necessarily represent the views of the University of Wollongong.
represent the views of the University of Wollongong.
Recommended Citation Recommended Citation
Yan, Rui, Data mining based strategies for building performance assessment, Doctor of Philosophy thesis, Sustainable Buildings Research Centre, University of Wollongong, 2017. https://ro.uow.edu.au/theses1/79 Research Online is the open access institutional repository for the University of Wollongong. For further information contact the UOW Library: [email protected]
Data mining based strategies for building
performance assessment
A thesis submitted in partial fulfilment of the requirements for the award of the degree of
Doctor of Philosophy
fromUniversity of Wollongong
byRui Yan
B.EngSustainable Buildings Research Centre
Faculty of Engineering and Information Sciences
i THESIS CERTIFICATION
CERTIFICATION
I, Rui Yan, declare that this thesis, submitted in partial fulfilment of the requirements
for the award of Doctor of Philosophy, in the Sustainable Buildings Research Centre,
Faculty of Engineering and Information Sciences, University of Wollongong, is
wholly my own work unless otherwise referenced or acknowledged. The document
has not been submitted for qualifications at any other academic institution.
Rui Yan
ii ABSTRACT
The operation of buildings and building Heating, Ventilation and Air-conditioning
(HVAC) systems may experience faults such as equipment malfunctions, sensor
reading faults, inappropriate operating procedures, incorrectly configured control
systems, and the degradation of equipment, which may deteriorate building
performance. Assessing building performance is therefore essential to understand
building performance levels and identify potential operational issues that may
influence building energy efficiency and indoor thermal comfort. Thanks to the wide
deployment of building automation systems and smart meters, a massive amount of
high resolution building operational data can now be easily accessed. This data
provides a great opportunity to better understand the characteristics of building
energy usage and operational performance. However, without advanced data
analytics, the valuable information underneath this massive amount of operational
data cannot be fully extracted and used to assess and improve building energy
performance.
Data mining is a proven method for extracting valuable and actionable information
from the massive data. The aim of this thesis sought to develop data mining based
strategies to evaluate the performance of building HVAC systems, individual
buildings, and multiple buildings to facilitate the initiatives for building performance
enhancement.
A strategy for detecting faults in the sensors of air handling units (AHUs) was first
developed using a data mining approach, where faults in the sensors were detected
by identifying the temporal and spatial separation between faulty and fault-free data.
iii
(PCA) based dimension reduction method with the Ordering Points to Identify the
Clustering Structure (OPTICS) based cluster analysis, while temporal separation was
checked using a boxplot. An interactive user interface was also developed to help
select the user defined parameters in cluster analysis and also visualise fault
detection results. An AHU simulation platform was developed to generate faulty and
fault-free data to evaluate this strategy, with the results showing that the proposed
strategy can successfully identify single and multiple sensor bias faults.
A decision tree based data-driven diagnostic strategy was developed to diagnose
AHU component faults. A regression model was also developed on the basis of
domain knowledge, which was used to reduce the complexity of the diagnostic
model. The experimental data from the American Society of Heating, Refrigerating
and Air-Conditioning Engineers (ASHRAE) RP-1312 was used to evaluate this
strategy, with the results indicating that its diagnostic accuracy was in line with other
strategies developed using Random Forest and Support Vector Machine methods. An
interpretation of this diagnostic model showed that some of the diagnostic rules
generated were unreliable due to the inherent limitation and issues with the training
data used. This further demonstrated the importance of interpretability of the
data-driven FDD strategies.
A strategy based on symbolic transformation, hierarchical clustering and advanced
visualisation techniques was then developed to evaluate the performance of
individual buildings and identify abnormal operational issues. The symbolic
transformation was achieved using a volatility change focused symbolic
transformation technique, Shape Definition Language (SDL). The performance
iv
usage data from a higher education building, and it showed that this strategy can
provide an intuitive way to understand building energy usage behaviours and identify
abnormal energy usage patterns. The patterns that were identified revealed the
potential energy inefficient operations and issues with regard to the thermal comfort,
which directly demonstrated the effectiveness of this proposed strategy
Considering that the symbolic transformation strategy developed requires a relatively
high computational cost and the visualisation techniques used may not be suitable for
performance evaluation of multiple buildings, a variation focused clustering strategy
using Partitioning Around Medoids (PAM) clustering algorithm and Pearson
Correlation Coefficient (PCC) dissimilarity measure was then developed to identify
typical daily load profiles. Those buildings with similar energy usage patterns were
then grouped together using hierarchical clustering, based on the identified typical
daily load profiles. Three year hourly district heating energy usage data from 19
higher education buildings were then used to evaluate this strategy. The results
showed that this strategy could discover the energy usage patterns from multiple
buildings, and these buildings were also classified into groups with distinctive energy
usage characteristics based on the energy usage patterns identified.
The strategies developed in this thesis can be adapted and used to evaluate the
performance of various types of buildings in order to better understand the energy
v
ACKNOWLEDGEMENTS
The road to the accomplishment of this thesis has been a long, winding and
challenging one, and also a truly life-changing experience for me. However, I would
not have reached this end without the support and guidance I received from many
people.
Firstly, I would like to express my sincere gratitude to my principal supervisor Dr.
Zhenjun Ma, for all the support and encouragement he gave me, during my entire
Ph.D. study. His contribution of time, ideas and guidance is really appreciated. I
would also like to thank my co-supervisor Dr. Georgios Kokogiannakis, for his
support and help in reviewing my work.
My gratitude also goes to Prof. Paul Cooper, the Director of Sustainable Buildings
Research Centre and the supervisor of my undergraduate thesis. Without him I would
not consider and have the opportunity to conduct Ph.D. study in this fantastic
research centre. I would also like to thank Mr. John Barron and Mr. Craig
McLauchlan, for their help in setting up the experiment test rig, although the result
from the experiment was not included in this thesis.
Thanks to all my colleagues at the Sustainable Building Research Centre. The long
road to accomplish this thesis is memorable because of their company.
Lastly, my utmost gratitude goes to my family, especially my parents, for their
endless love, support and encouragement provided during my most difficult time,
vi
LIST OF PUBLICATIONS
The contents in Chapters 3, 4, 5 & 6 of this thesis are based on the published articles
listed below.
Journal Papers Published
• Yan, R., Ma, Z., Kokogiannakis, G. and Zhao, Y., 2016, A sensor fault detection strategy for air handling units using cluster analysis. Automation in
Construction, 70, pp.77-88.
• Yan, R., Ma, Z., Zhao, Y. and Kokogiannakis, G., 2016, A decision tree based data-driven diagnostic strategy for air handling units. Energy and
Buildings, 133, pp.37-45.
• Ma, Z., Yan, R., Nord, N., 2017, A variation focused cluster analysis strategy
to identify typical daily heating load profiles of higher education buildings.
Energy, 134, pp.90-102.
Conference Paper
• Ma Z, Yan R, Fiorentini M, Cooper P. Team UOW Solar Decathlon House:
Refurbishment Demonstration. In: The 11th Conference on Advanced
vii TABLE OF CONTENTS THESIS CERTIFICATION ... i ABSTRACT ... ii ACKNOWLEDGEMENTS ... v LIST OF PUBLICATIONS ... vi
TABLE OF CONTENTS ... vii
LIST OF FIGURES ... xiii
LIST OF TABLES ... xxii
NOMENCLATURE ... xxiii
GLOSSARY ... xxvi
Chapter 1 Introduction ... 1
Background and motivation ... 1
Research aim and objectives ... 4
Research methodology ... 6
Thesis organisation ... 8
Chapter 2 Literature review ... 10
Overview of data mining and knowledge discovery from database ... 11
2.1.1 Predictive modelling ... 13
2.1.2 Descriptive modelling ... 15
viii
Data mining in fault detection and diagnosis (FDD) of building HVAC
systems ... 26
2.3.1 Data mining based online FDD strategies ... 27
2.3.2 Data mining based offline FDD strategies ... 33
Data mining in building energy performance assessment... 36
2.4.1 Data mining in energy performance assessment of multiple buildings . 37 2.4.2 Data mining in energy performance assessment of individual buildings ……….42
Data mining in building performance prediction ... 44
2.5.1 Building energy and load prediction ... 45
2.5.2 Building performance indexes prediction ... 49
Data mining in building control optimisation ... 50
Summary ... 52
Chapter 3 Application of cluster analysis in air handling units sensor fault detection ... 56
Development of a cluster analysis based fault detection strategy ... 57
3.1.1 Outline of the fault detection strategy for air handling units ... 57
3.1.2 OPTICS cluster analysis ... 60
3.1.3 User interface for thresholds selection ... 65
ix
Simulation of AHU and sensor faults ... 68
Performance test and evaluation of the fault detection strategy ... 73
3.3.1 Demonstration of the fault detection process of the proposed strategy . 73 3.3.2 Validation of the proposed strategy for single sensor fault detection .... 78
3.3.3 Validation of the proposed strategy for multiple sensor faults detection ……….82
Sensitivity analysis of OPTICS user defined parameters on the fault detection results ... 88
Summary ... 90
Chapter 4 A decision tree based data-driven diagnostic strategy for air handling units ... 92
Outline of the diagnostic strategy ... 93
Decision tree induction ... 95
Experimental AHU and experimental data ... 98
Validation and interpretation of the AHU diagnostic strategy ... 102
4.4.1 Classification tree induction ... 102
4.4.2 Decision tree interpretation ... 109
Performance comparison with other predictive models ... 117
x
Chapter 5 Development of a symbolic transformation based strategy to evaluate the
performance of individual buildings ... 120
Development of the symbolic transformation based strategy ... 121
5.1.1 Outline of the proposed strategy ... 121
5.1.2 Outlier removal with the generalised Extreme Studentised Deviate test method………...123
5.1.3 Symbolic transformation ... 124
5.1.4 Dice coefficient based dissimilarity ... 125
5.1.5 Hierarchical clustering ... 126
5.1.6 Visualisation assisted interpretation ... 127
Performance test and evaluation of the proposed strategy ... 129
5.2.1 Results of analysing the heating energy usage data ... 132
5.2.2 Results from analysing the electricity usage data ... 137
Interpretations of the information discovered ... 142
5.3.1 Interpretation of heating energy usage information ... 142
5.3.2 Interpretation of electricity usage information ... 144
5.3.3 Summary of the interpretation ... 146
Comparison between the proposed strategy with Symbolic Aggregate approXimation based strategy ... 147
xi
Chapter 6 Identifying typical daily load profiles of multiple buildings through
variation focuesed clustering... 152
Outline of the variation focused cluster analysis strategy ... 153
6.1.1 Pearson correlation coefficient (PCC) based dissimilarity measure .... 155
6.1.2 Partitioning around medoids clustering algorithm ... 156
6.1.3 Buildings classification with hierarchical clustering ... 158
Performance evaluation of the proposed strategy ... 158
6.2.1 Description of the case study buildings ... 158
6.2.2 Data pre-processing ... 162
6.2.3 Identification of typical daily heating energy usage profiles ... 164
6.2.4 Buildings classification based on the identified typical daily load profiles ………...168
Interpretation of the identified typical daily load profiles ... 171
6.3.1 Building 02 – Typical daily load profile 4 ... 172
6.3.2 Building 14 – Typical daily load profile 6 ... 173
6.3.3 Building 17 – Typical daily load profile 7 ... 174
6.3.4 Building 08 – Typical daily load profile 9 ... 175
6.3.5 Building 03 – Typical daily load profile 11 ... 175
Comparison between the use of ED based and PCC based clustering ... 176
xii
Chapter 7 Conclusions and recommendations ... 182
Summary of the main foundings ... 182
7.1.1 Fault detection of sensor faults in air handling units using cluster
analysis ... 182
7.1.2 The decision tree based data-driven diagnostic strategy for AHUs ... 183
7.1.3 Development of a symbolic transformation based strategy for individual
building performance assessment ... 184
7.1.4 Development of a variation focused cluster analysis strategy for
performance evaluation of multiple buildings ... 185
Recommendations for future work ... 187
xiii
LIST OF FIGURES
Figure 1.1 Example of levels of building performance data (Miller et al. 2015). ... 3
Figure 1.2 Illustration of different levels of building performance assessment in this
study. ... 5
Figure 1.3 Outline of the research methodology employed in this study. ... 7
Figure 2.1 The overall KDD process. ... 11
Figure 2.2 Classification of data mining tasks with typical corresponding algorithms.
... 12
Figure 2.3 Illustration of the partition boundaries (left) and the decision tree structure
(right) (Loh 2011). ... 14
Figure 2.4 Commonly used agglomerative hierarchical clustering linkage methods. 17
Figure 2.5 Three different types of points in DBSCAN (MinPts = 5) (Tan et al.
2006). ... 18
Figure 2.6 A three phase data analysis process for extracting knowledge from
building data (Yu et al. 2012). ... 20
Figure 2.7 Data mining framework for discovering knowledge from massive building
operational data (Fan et al. 2015b). ... 21
Figure 2.8 The workflow of CRoss-Industry Standard Process Model for Data
Mining (CRISP-DM) (Shearer 2000)... 22
Figure 2.9 A generalised data mining process for assessing and improving building
xiv
Figure 2.10 The use of data mining to assess and improve building performance. ... 25
Figure 2.11 Classification of FDD methods used in building HVAC systems
(Katipamula and Brambley 2005). ... 26
Figure 2.12 Typical workflow of data mining based online FDD strategy. ... 28
Figure 2.13 Schematic of model based fault detection methods (Cui 2005). ... 28
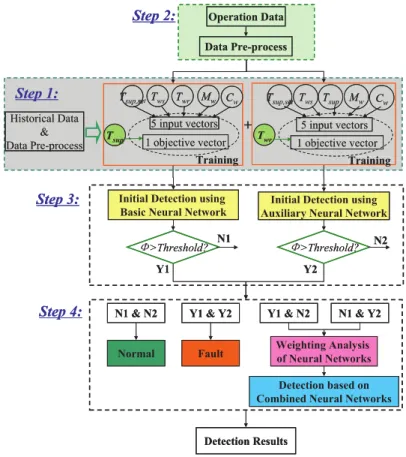
Figure 2.14 Flowchart of the AHU sensor fault detection strategy based on dual
ANN models (Du et al. 2014). ... 30
Figure 2.15 The residual (Q-statistic) and calculated threshold (Qa) associated with
using wavelet transformation (right) and without using wavelet transformation
(left) (Xu et al. 2008). ... 33
Figure 2.16 The workflow of FDD strategy based on ARM (Yu et al. 2012). ... 34
Figure 2.17 The topology of a BBN structure developed for FDD of VAV terminals
(Xiao et al. 2014). ... 36
Figure 2.18 The benchmarking system procedure proposed by Gao and Malkawi
(2014). ... 38
Figure 2.19 The typical daily load profiles and associated daily profiles (Do Carmo
and Christensen 2016). ... 40
Figure 2.20 The Sankey diagram and heatmap visualisation method to visualise
discords and motifs (Miller et al. 2015). ... 41
Figure 2.21 The overall process of the strategy for analysing VRF energy usage data
xv
Figure 2.22 The topology of the ANN model used by Kwok et al. (2011). ... 46
Figure 2.23 Comparison of the ANN and SVM based hourly cooling load prediction (a) predicted value, and (b) relative error (Li et al. 2009). ... 48
Figure 2.24 Typical surrogate model based building optimisation process. ... 51
Figure 3.1 Outline of the proposed fault detection strategy. ... 57
Figure 3.2 An illustration of boxplot. ... 60
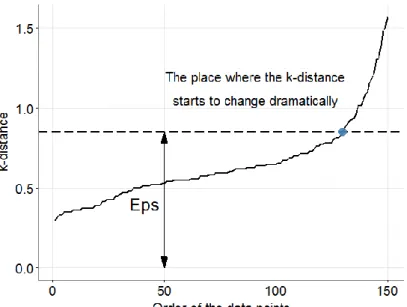
Figure 3.3 Illustration of the order of the points in the k-distance graph... 62
Figure 3.4 Illustration of how the three types of distances are defined, where c-d and r-d are abbreviations of core-distance and reachability-distance, respectively. The point p3 is directly density reachable from the point o (Ankerst et al. 1999). ... 63
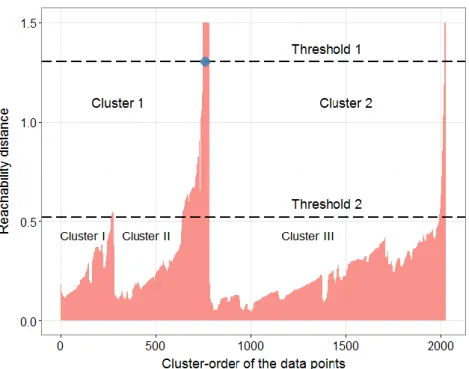
Figure 3.5 Illustration of the OPTICS outputs and how clusters are identified with the user-defined threshold. ... 64
Figure 3.6 The user interface for the two thresholds selection. ... 66
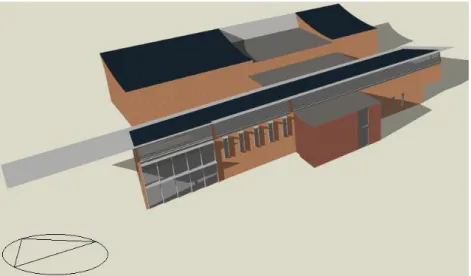
Figure 3.7 Perspective view of the SBRC building thermal model in DesignBuilder. ... 69
Figure 3.8 A snapshot of the simulation system built in TRNSYS. ... 70
Figure 3.9 Illustration of the measurement instruments of AHUs. ... 71
Figure 3.10 Temporal spread of the post-filtered observations (the system started to operate at the 53 hour)... 75
xvi
Figure 3.12 The reachability-distance of the cluster-order of the data point - Case 1.
... 77
Figure 3.13 Temporal distribution of the data points in clusters in Case 1 under (a)
Threshold 1; (b) Threshold 2. ... 77
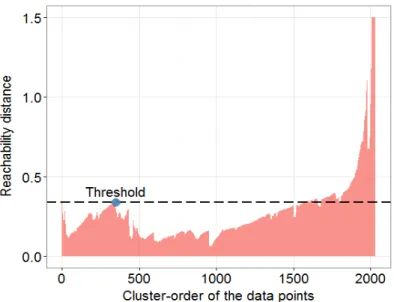
Figure 3.14 The reachability-distance of the cluster-order of the data point – Case 2
with fault-free operation. ... 79
Figure 3.15 Temporal distribution of the data points in the identified clusters – Case
2. ... 79
Figure 3.16 Temporal distribution of the data points in the identified clusters with
single sensor fault – Cases 3-7. ... 81
Figure 3.17 The reachability-distance of the cluster-order of the data points - Case 8.
... 83
Figure 3.18 Temporal distribution of the data points in clusters - Case 8. ... 83
Figure 3.19 The reachability-distance of the cluster-order of the data points - Case 9.
... 85
Figure 3.20 Temporal distribution of the data points in the identified clusters - Case
9. ... 85
Figure 3.21 The reachability-distance of the cluster-order of the data points - Case
10. ... 87
Figure 3.22 Temporal distribution of the data points in the identified clusters - Case
xvii
Figure 3.23 The reachability-distance of the cluster-order of the data points of
different input parameter combinations and the corresponding temporal
distribution of the identified clusters... 89
Figure 4.1 Outline of the proposed AHU fault diagnostic strategy. ... 93
Figure 4.2 Layout of the AHUs test facility at IOWA Energy Centre (Norford et al.
2002). ... 99
Figure 4.3 The schematic of the experimental AHU facility with monitored variables.
... 100
Figure 4.4 Illustration of the control signals and fans power under the fault-free test
condition. ... 100
Figure 4.5 Illustration of the air flow temperature and air flow rate under the
fault-free test condition. ... 101
Figure 4.6 The fully grown AHU fault diagnosis tree with the residual feature. .... 103
Figure 4.7 Number of splits in the sequence of the pruned subtrees with different
costs of complexity and the corresponding relative errors with the residual
feature. ... 105
Figure 4.8 Post-pruned AHU fault diagnostic tree with the residual feature. ... 106
Figure 4.9 Number of splits in the sequence of the pruned subtrees with different
costs of complexity and the corresponding relative errors without using the
residual feature. ... 108
xviii
Figure 4.11 Relationship between supply fan speed control signal and supply air flow
rate under the faulty and fault-free conditions. ... 110
Figure 4.12 Density distribution of the return fan power under the faulty and fault-free conditions. ... 111
Figure 4.13 Isolated fault boundaries in terms of the cooling coil valve control signal and outdoor air temperature. ... 114
Figure 4.14 Histogram plot of the number of the observations against different mixed air temperature. ... 115
Figure 5.1 Outline of the proposed symbolic transformation based strategy. ... 122
Figure 5.2 A dendrogram with three data points... 127
Figure 5.3 Illustration of the result visualisation using heatmap based hierarchical clustering. ... 128
Figure 5.4 An example of the calendar view based visualisation of cluster distribution. ... 129
Figure 5.5 The interface of the web based EMS used for data collection. ... 130
Figure 5.6 The profile of building 303. ... 130
Figure 5.7 The heating energy and electricity usage data of building 303. ... 132
Figure 5.8 Temporal distribution of the symbols and shapes for heating energy usage. ... 133
Figure 5.9 Dendrogram of the hierarchical clustering result for heating energy usage. ... 134
xix
Figure 5.10 Distribution of symbols in daily load profiles ordered by the dendrogram
for heating energy usage. ... 135
Figure 5.11 Typical daily heating load profiles formed by the identified clusters. . 136
Figure 5.12 Calendar view of the distribution of typical heating load profiles. ... 137
Figure 5.13 Temporal distribution of the symbols and shapes of electricity usage. 138
Figure 5.14 Dendrogram of the hierarchical clustering result of electricity usage. . 139
Figure 5.15 Distribution of symbols in daily load profiles as ordered by the
dendrogram for electricity usage. ... 139
Figure 5.16 Typical electricity load profiles formed by the identified clusters. ... 140
Figure 5.17 Calendar view of the distribution of typical electricity load profiles. .. 142
Figure 5.18 The heating energy usage data of a typical week and a non-typical week.
... 144
Figure 5.19 The actual electricity usage data of the four interesting weeks. ... 146
Figure 5.20 Distributions of the symbols in daily load profiles ordered by the
dendrogram (heating energy usage, SAX based). ... 148
Figure 5.21 Typical heating load profiles formed by the identified clusters (SAX
based). ... 149
Figure 5.22 Calendar view of the distribution of typical heating load profiles (SAX
based). ... 150
xx
Figure 6.2 Comparison between the PCC and ED based dissimilarity measures (a)
ED; (b)&(c) PCC. ... 156
Figure 6.3 Illustration of the NTNU campus and the district heating network. ... 159
Figure 6.4 The distribution of the construction year of the buildings in the study. . 160
Figure 6.5 The correlation between the buildings’ exterior wall U-value and the construction year. ... 160
Figure 6.6 Outdoor temperature variation in 2011. ... 161
Figure 6.7 Overview of the averaged building annual specific heating energy usage.
... 162
Figure 6.8 Illustration of the building heating energy usage and outliers identified -
building 03. ... 163
Figure 6.9 Dunn Index calculated for different numbers of the clusters. ... 164
Figure 6.10 Boxplot of the aggregated dissimilarities of the identified clusters. .... 165
Figure 6.11 Typical daily heating load profiles (red) with all corresponding daily
load profiles (gray) identified using the proposed strategy. ... 166
Figure 6.12 Weekday load profile distribution in different clusters identified. ... 167
Figure 6.13 Dendrogram of building classification results. ... 170
Figure 6.14 Heatmap of the typical daily load profiles in different buildings - PCC
based clustering. ... 171
Figure 6.15 Illustrations of the heating energy usage of the buildings in two
xxi
Figure 6.16 Water usage of building 14. ... 174
Figure 6.17 Dunn Index calculated for different numbers of the clusters - ED based
clustering. ... 177
Figure 6.18 Typical daily heating load profiles (red) with all corresponding daily
load profiles (gray) identified using the k-means clustering with ED based
dissimilarity measure. ... 178
Figure 6.19 Heatmap of the typical daily load profiles in different buildings - ED
xxii
LIST OF TABLES
Table 3.1 Description of major components used in the TRNSYS Simulation ... 70
Table 4.1 Summary of AHU faults considered and their abbreviations ... 102
Table 4.2 Number of splits, corresponding complexity parameter and relative error
... 105
Table 4.3 F-measures of different faults for pre-pruned and post-pruned diagnostic
trees ... 107
Table 4.4 Summary of the fault diagnostic performance result ... 118
Table 5.1 Description and definition of the symbols ... 124
Table 5.2 Description and definition of the shapes ... 125
Table 5.3 Key characteristics of the identified typical daily heating energy usage
profiles ... 136
Table 5.4 Key characteristics of the identified typical daily electricity usage profiles
... 141
Table 6.1 Major information of the case study buildings ... 161
Table 6.2 Key characteristics of the identified typical daily heating energy usage
profiles ... 168
Table 6.3 Summary of the first two most dominant profiles of individual buildings
xxiii
NOMENCLATURE
a1-a3 coefficients
c total number of class
C set of the identified clusters
cov covariance
d distance
D Dunn Index
Dice Dice coefficient
ED Euclidean distance
Eps a user defined radius
F flow rate (m3/min)
FN false negative
FP false positive
I impurity measure
IQR interquartile range
k number of clusters
m number of sample data
MinPts minimum number of data points
n number of observations or number of variables
xxiv
Nd number of days belongs to a typical daily load profile
Nd,max maximum number of days belongs to a typical daily load profile
NEps a set of data points within the Eps of a given point
o, q data point
p probability or data point
P power (W) or the proportion of the observations
PCC Pearson correlation coefficient
Q quartile
r node misclassification rate
R studentised deviate or misclassification rate
RP relative proportion
S a particular split
t t-distribution or the node for splitting
T temperature (oC)
TP true positive
U valve control signal (%)
x,y values of individual dimension
X, Y vectors
Greek letters
xxv λ critical value σ standard deviation ϕ identified clusters Subscripts cc cooling coil L left ma mixed air oa outdoor air R right rf return fan sa supply air sf supply fan
xxvi GLOSSARY
AHU air handling unit
ANN artificial neural network
ASHRAE American Society of Heating, Refrigerating and Air-conditioning
Engineers
BAS building automation system
CART classification and regression tree
DBSCAN density based spatial clustering of applications with noise
EMS energy monitoring system
FDD fault detection and diagnosis
ESD extreme studentised deviate
HVAC heating ventilation and air conditioning
OPTICS ordering points to identify the clustering structure
PAM partitioning around medoid
PCA principal component analysis
SAX Symbolic Aggregate approXimation
SDL shape definition language
1
Chapter 1
Introduction
Background and motivation
The growing population and continuous increase in living standards have increased
global energy usage over the past decades and also accelerated global warming due
to massive greenhouse gas emissions from fossil fuels (Ahmad et al. 2014).
Buildings account for a large proportion of total energy consumption worldwide. It is
estimated that 20-40% of final energy consumption comes from the building sector
in developed countries (Pérez-Lombard et al. 2008). Improving building energy
efficiency is therefore essential for reducing global energy usage and promoting
environmental sustainability.
The operation of existing buildings accounts for a large proportion of total building
energy usage, whereas replacing existing buildings by new-build is only around
1.0-3.0% per annum (Ma et al. 2012), and therefore enhancing the operational
performance of existing buildings is an essential part of reducing the energy
consumption of the whole building sector. There are many factors which influence
the performance of building operations, such as improper selection of building
systems and components, faults and degradation in sensors and components, and
inappropriate control of building service systems. For example, a 3.0oC bias in air
handling units (AHUs) supply air temperature sensor may increase the daily energy
consumption by 9.0% (Wang and Xiao 2004), and various faults in chillers and
2
Therefore, building performance assessment can help to detect problems and faults
related to building operation and thus reduce the consumption of energy.
The ongoing development of technology has made a vast amount of energy
production and consumption data available. This data provides opportunities to
tackle the challenges faced in the energy sector such as operational efficiency,
system maintenance, and control stability and reliability (Zhou et al. 2016). Similar
opportunities and challenges are also being faced by the building sector. A detailed
investigation of the measured building operational data is an effective way to
understand building performance levels and also elicit the information required to
support decision-making to improve building performance (Yu 2012). On the other
hand, the wide deployment of Building Automation Systems (BASs) makes the
retrieval of various operational data possible at a reasonably low cost. The massive
amount of data monitored and recorded by BASs provides opportunities for
discovering useful information and knowledge related to building operation and
further facilitates initiatives for enhancing building performance.
Great effort has been made to extract useful knowledge from building operational
data through statistical analysis, domain knowledge, and simple data visualisations,
but these conventional techniques cannot handle high resolution and
multi-dimensional data retrieved from BASs. Figure 1.1 is an example of different levels
of building performance data which shows the complexity of measured data from
buildings. For instance, the BAS installed in the Hong Kong International Commerce
Centre captures measurements from 950 sensors every 1 or 15 minutes, which results
3
recorded from BAS is often influenced by factors such as outliers, noise, and missing
data which makes knowledge discovery very challenging and time consuming.
Figure 1.1 Example of levels of building performance data (Miller et al. 2015).
Data mining is the process of discovering interesting and useful patterns and
relationships in large volumes of data (Clifton 2009). It has been used widely in
various industries such as the Internet, finance, aviation, etc. Data mining, unlike
traditional data analytics, is a systematic process which transforms raw data into
useful information. Data mining has been used to discover the information hidden in
the enormous volume of data collected from buildings to assess and improve their
performance (Yu et al. 2016). Typical applications include fault detection and
diagnosis of heating, ventilation, and air conditioning (HVAC) systems (Fan et al.
2010, Namburu et al. 2007, Mulumba et al. 2015), understanding the characteristics
4
2013, Santamouris et al. 2007), building load prediction (González and Zamarreño
2005, Kalogirou and Bojic 2000, Dong et al. 2005) and control optimisation (Kusiak
and Li 2010b, Zeng et al. 2015). However, most strategies developed using the data
mining approach relied mainly on the prior knowledge of data mining, whereas the
domain knowledge of buildings was rarely considered (Yu et al. 2016). This means
that these strategies are often difficult for engineers and building operators to use and
handle because they do not have enough knowledge of data mining. Moreover, the
lack of techniques to interpret and visualise the results of data mining also made
them difficult to understand and use, which prevents the use of the knowledge
extracted for daily building operations and decision making for energy efficiency
initiatives.
The use of data mining to assess the performance of building operations is still in its
infancy stage so there is an enormous potential for extracting useful information
from BAS data using data mining techniques. This research therefore focuses on
developing strategies based on data mining to assess building performance with
enhanced interpretability and visualisation to enable building operators and
practitioners to apply the knowledge and information extracted to improve building
operational performance.
Research aim and objectives
This research aims to develop building performance assessment strategies using data
mining techniques to better understand the operational performance of building
HVAC systems, individual buildings, and multiple buildings, as shown in Figure 1.2,
5
Figure 1.2 Illustration of different levels of building performance assessment in this study.
The aim of the research is achieved through the following objectives:
I. To develop a strategy for detecting sensor faults in Air Handling Units
(AHUs) using a data mining approach with an interactive user interface to
identify AHU single or multiple sensor faults;
II. To develop a diagnostic strategy using a data mining approach, which can be
interpretable with domain knowledge, to diagnose component faults related to
building AHUs;
III. To develop a strategy to evaluate the performance of individual buildings, in
order to identify typical and abnormal energy usage patterns for building
performance enhancement purpose, and;
IV. To develop a strategy based on data mining to characterise the energy usage
of multiple buildings and classify those buildings with similar energy usage
patterns, in order to support initiatives to improve buildings energy
performance.
6 Research methodology
This thesis follows the research methodology shown in Figure 1.3. Since this study
could be classified as interdisciplinary research, a literature review of building
performance assessment and data mining is carried out to identify research gaps and
suitable data mining techniques. Based on the understanding of the research
background, specific research areas and directions are then identified, with a focus
on building HVAC systems, individual buildings, and multiple buildings. At the
building HVAC system level, two methods for AHU sensor fault detection and
component fault diagnosis are developed and will be presented in Chapters 3 and 4,
respectively. At an individual building level, a strategy for understanding their
energy usage and identifying typical and abnormal patterns will be proposed, and
presented in Chapter 5. In Chapter 6, a strategy was developed for multiple buildings
which was focussed on identifying the typical daily load profiles of a group of
buildings and then grouping them into different clusters based on the identified
typical load profiles. The appropriate data mining techniques were identified through
the literature review and will be used to develop the strategies needed to meet the
defined objectives. Lastly, the performance and effectiveness of the proposed
strategies will be tested and validated based on building operational data collected
7
Data Mining in Building Performance Assessment Multiple buildings level (objective IV) Individual building level (objective III) Building system level (objective I & II)
AHU sensor fault detection (Chapter 3) AHU component fault diagnosis (Chapter 4) Understanding individual building energy behaviour (Chapter 5)
Identify typical load profiles and classification
of buildings (Chapter 6) Understand the research background Identify research areas and directions Literature review on building performance assessment
Develop strategies to accomplish the defined objectives with focus on interpretability,
visualisation and user-friendliness
Collect relevant data from real system or
simulation model
Test and evaluate the proposed strategies based
on the data collected
Literature review on data mining
Identify suitable data mining techniques
8 Thesis organisation
This chapter introduces the background and motivation for this research, including
the aim and objectives and the research methodology. The subsequent chapters are
structured as follows.
Chapter 2 provides a literature review of data mining techniques and their application
in assessing and improving the performance of building operations. It also identifies
relevant research gaps in this field.
Chapter 3 presents a strategy for detecting sensor faults using cluster analysis for air
handling units (AHUs), to identify single and multiple AHUs sensor faults from
historical data. This proposed strategy is evaluated based on the simulation data
collected from a virtual AHU system. A sensitivity analysis of the proposed strategy
against the user defined parameters and an interactive user interface are also
provided.
Chapter 4 presents a decision tree based strategy for diagnosing mechanical faults of
AHUs, which aims to couple domain knowledge with the data mining technique in
the development and interpretation of the diagnostic model. The experimental data
from the American Society of Heating, Refrigerating and Air-Conditioning
Engineers (ASHRAE) Research Project 1312 is used to train and evaluate the
decision tree based diagnostic model. An interpretation of this diagnostic model is
also provided from the perspective of domain knowledge.
Chapter 5 presents a strategy for understanding the energy usage behaviour of
9
approach. The symbolic transformation is based on the Shape Definition Language in
order to better identify and visualise building energy usage. District heating energy
and electricity usage data from an higher education building is used to test and
evaluate its performance.
Chapter 6 presents a strategy for identifying typical daily energy load profiles of
multiple buildings using a variation focused cluster analysis and classifying the
buildings with similar energy usage patterns based on the identified typical daily load
profiles. Three years of district heating energy usage data collected from 19 higher
education buildings are used to evaluate its performance.
Chapter 7 summarises the key findings from this study and also gives
10
Chapter 2
Literature review
With the widespread utilisation of building automation systems (BASs), massive
amounts of building operational data could easily be accessed. This provides a great
opportunity to use advanced data analytic techniques to better understand building
operational performance and identify areas for improvement. Data mining is an
interdisciplinary subfield of computer science (Clifton 2009) that was first applied in
commerce and finance analysis, and is now attracting increasing attention from
building researchers and practitioners. This chapter provides a literature review of
the research and application of data mining in building performance assessment and
improvement in order to identify the potential research gaps and opportunities for
applying data mining to discover useful information from BAS data to facilitate
building performance improvement
This chapter is organised as follows. Section 2.1 provides a brief introduction to data
mining and knowledge discovery from databases. Section 2.2 overviews the general
data mining frameworks developed for building applications. Sections 2.3 and 2.4
provide a review of the application of data mining technologies in building fault
detection and diagnosis (FDD) and building energy performance assessment. An
overview of the use of data mining to predict building performance and optimise
building control is presented in Sections 2.5 and 2.6 respectively, while Section 2.7
11
Overview of data mining and knowledge discovery from database
Data mining is a set of techniques for extracting information hidden in vast data by
discovering useful patterns automatically or semi-automatically (Witten and Frank
2005). From a board perspective, data mining can be viewed as an essential step in
an information retrieving process known as knowledge discovery from database
(KDD); it is a non-trivial process of identifying useful and ultimately understandable
patterns in a database (Fayyad et al. 1996, Sumathi and Sivanandam 2006). Figure
2.1 shows the overall process of KDD with three major steps, data pre-processing,
data mining, and data post-processing.
Data pre-processing Data Mining Data post-processing
Raw data Information
Data cleaning Data integration Data selection Data transformation Predictive tasks Descriptive tasks Pattern evaluation Visualisation
Figure 2.1 The overall KDD process.
Real world data is often incomplete and inconsistent, and contains many errors; this
is why data pre-processing is often used to make low quality raw data suitable for
further processing (Deshpande et al. 2016). The data pre-processing step normally
includes the following main tasks (Han et al. 2006):
• Data cleaning: to remove outliers, noise, and inconsistent data;
• Data integration: to combine the data from different sources;
• Data selection: to select an appropriate subset of the raw data that is relevant to the data mining task and;
12
• Data transformation: to transform the data into appropriate forms for mining.
The tasks performed in the data mining step can be roughly categorised as predictive
modelling and descriptive modelling. Predictive modelling analyses the data to
construct one or a set of models to predict the behaviour of new datasets. Descriptive
modelling describes the data in a concise and summative manner and presents any
interesting general properties (Han et al. 2006). Figure 2.2 classifies the data mining
tasks with corresponding typical algorithms; details of the predictive modelling
methods and descriptive modelling methods are provided in Sections 2.1.1 and 2.1.2.
Data mining Predictive modelling Cluster analysis Association analysis Ensemble
methods DBSCAN K-means
Decision tree Support vector
machine Artificial neural
network Apriori FP-growth
Descriptive modelling
Regression Classification
Hierarchical clustering
Figure 2.2 Classification of data mining tasks with typical corresponding algorithms.
Data post-processing evaluates the revealed patterns in ways such as visualisation so
that their significance can be understood and any spurious results eliminated, after
which the revealed information can be incorporated into the decision making
13
2.1.1 Predictive modelling
Predictive modelling can be further categorised as regression if the predicted
variables are continuous, and classification if the predicted variables are discrete
(Tan et al. 2006). Predictive models are generally built from the training data by
mapping the relationship between the target variables and predicted variables. As
Figure 2.2 shows, artificial neural network (ANN), support vector machine (SVM),
decision tree and ensemble methods are typical algorithms for predictive modelling.
ANN was developed by inspiration from the biological neural system and consists of
a number of nodes. The learning of an ANN model aims to minimise the sum of
squared error of the output by adjusting the weights of the network, and training will
be stopped if the error falls within an acceptable range. A commonly used ANN
learning algorithm is back propagation which propagates the errors generated at the
output nodes back towards the input nodes and updates the weights accordingly
(Leung and Haykin 1991). It should be noted that the structure of an ANN should be
built carefully otherwise it may result in overfitting whereby the predictive model
works well with the training data but poorly with the new data (Karsoliya 2012).
SVM is naturally defined for the linear separable binary classification of numeric
data by determining a maximum margining hyperplane (Aggarwal 2015). However,
it can also be applied in the nonlinear separable multiclass classification and
regression through several extensions. The prediction accuracy of SVM is among the
highest of the commonly used algorithms, as reported by Fernández-Delgado et al.
14
A decision tree is often implemented in the classification tasks and is referred to as a
classification tree, albeit it can be applied to both classification and regression. A
decision tree is expressed as a recursive partition of the instance space (Rokach
2008). There are two advantages to using decision trees; decision tree induction
algorithms (e.g. C4.5) can perform feature selection and therefore allow appropriate
features to be selected for classifier modelling (Ratanamahatana and Gunopulos
2003); and decision trees are a kind of symbolic classifier. Compared to black box
based models like ANN and SVM, a decision tree is interpretable, which enables
domain experts to understand the predictive model developed and map it with
domain knowledge (Perner 2011). Figure 2.3 shows a typical decision tree with the
corresponding partition boundaries.
Figure 2.3 Illustration of the partition boundaries (left) and the decision tree structure (right) (Loh 2011).
Ensemble methods are algorithms that combine a set of classifiers and classify new
data points by taking a weighted vote of their predictions (Dietterich 2000). Of the
15
widely applied ensemble method that was established based on building many
decision trees and determining the final prediction result through a majority vote.
Random forest incorporates two randomisations in the algorithm, the random
selection of features and training data. These two randomisations ensure that it has a
high predictive accuracy and significantly reduces the issue of over fitting (Breiman
2001).
2.1.2 Descriptive modelling
Descriptive modelling has two main analysis methods, i.e. cluster analysis and
association analysis, as shown in Figure 2.2. This section provides a review of the
commonly used cluster analysis and association analysis algorithms.
• Cluster analysis
Cluster analysis discovers the natural grouping(s) of a set of patterns, points or
objects by maximising the distance between inter-clusters and minimising the
distance between intra-clusters (Blockeel et al. 1998). Clustering based on
partitioning, density, and hierarchy are the most commonly used methods of cluster
analysis.
K-means is a clustering algorithm based on partitioning which was developed about
50 years ago and is still one of the most widely used algorithms due to its simplicity,
ease of implementation, and efficiency (Jain 2010). A K-means algorithm divides a
dataset into k clusters so that the within-cluster Sum of the Squared Error (SSE) is
minimised (Hartigan and Wong 1979). The K-means method chooses arbitrary k data
16
closest cluster centres. The algorithm then iteratively calculates the mean of the
clusters, which are then used as the centres of the new cluster and reassigns the data
points to the centre of the nearest cluster until the SSE does not decrease any more
(Han et al. 2006). Although K-means is straightforward and efficient, it has problems
working with non-globular (also known as non-spherical) clusters and clusters of
different sizes and densities, and it is also sensitive to noise (Tan et al. 2006). In the
K-means algorithm, the number of clusters is a user defined parameter which is
usually determined based on a certain type of cluster validation index. Commonly
used cluster validation indices include the Dunn Index, the Davies-Bouldin Index,
and the Silhouette Width (Handl et al. 2005).
Hierarchical clustering has two basic approaches, i.e. a bottom up (agglomerative)
approach and a top down (divisive) approach. The agglomerative approach begins by
placing each object in its own cluster and then merging the atomic clusters into larger
clusters until every object is in a single cluster, whereas the divisive approach begins
with all the data points in one cluster (Han et al. 2006). Agglomerative hierarchical
clustering is more common than the divisive counterpart in real applications. The
major difference between various agglomerative hierarchical clustering algorithms is
the linkage method which defines how the sub-clusters are merged. Commonly used
linkage methods include complete link, single link, and average link (Murtagh and
Contreras 2012). As Figure 2.4 shows, the complete link is the maximum distance
between the data points in two different clusters and the single link is the minimum
distance. The average link measures the average distance between two sub-clusters.
17
susceptible to noise and outliers but it can break large clusters and favours globular
shapes (Tan et al. 2006). The merging process of hierarchical clustering can be
visualised as a tree structure diagram called a dendrogram, which is useful way of
understanding the cluster structure. However, hierarchical clustering does not work
very well with noisy and high dimensional data because all the merges are final and
there is no global objective function (Tan et al. 2006).
Complete link Single link Average link
Figure 2.4 Commonly used agglomerative hierarchical clustering linkage methods.
Density based clustering methods search for connected dense spaces that are
separated by low dense spaces (Tan et al. 2006). Density Based Spatial Clustering of
Applications with Noise (DBSCAN) is a commonly used density based clustering
algorithm. DBSCAN identifies clusters through finding core points, border points
and noise points based on two user defined parameters, including MinPts and Eps, as
illustrated in Figure 2.5. Core points are those points with at least MinPts points in
their Eps distance; border points are points that do not meet this criterion but are
within the Eps range of a core point; and the remaining points are marked as noise
points. Clusters are formed by core points and border points that are
density-connected (Ester et al. 1996). Unlike algorithms based on partitioning and hierarchy,
DBSCAN can identify arbitrarily shaped clusters, it is robust to noise, and does not
18
Figure 2.5 Three different types of points in DBSCAN (MinPts = 5) (Tan et al. 2006).
• Association analysis
Association analysis focuses on discovering frequent itemsets, and was initially used
to analyse supermarket transactions. An association rule is of the form X→Y, where
X and Y are two items (e.g. two items in a transaction) while p is probability. This
rule is interesting if its support (defined in Eq.(2.1)) and confidence (defined in
Eq.(2.2)) are greater than the minimum values specified by the user (Zhang and Wu
2011).
( ) ( )
support X Y p XY (2.1)
( ) ( | )
confidence X Y p Y X (2.2)
The form of interesting association rules is simple, but it is computationally
infeasible to discover interesting association rules with brute force because the
number of association rules grows exponentially with the number of items in the
dataset (Tan et al. 2006). Different algorithms have therefore been proposed to
discover interesting association rules as efficiently as possible, of which Aprior is a
commonly used algorithm. The Aprior algorithm is based on the principle that an
19
and Wu 2011), so by identifying and pruning the infrequent itemsets, the Aprior
algorithm improves the searching efficiency of the association rules. Other
commonly used algorithms include Eclat (Equivalence Class Transformation) and FP
(frequent patterns)-growth algorithms.
These reviewed algorithms are among the most commonly adopted algorithms and
are the basis of many other algorithms. However, it should be noted that these
algorithms are only a small fraction of the developed data mining algorithms and
there is no algorithm that fits every situation, and therefore the data mining
algorithms should be selected on a case by case basis by considering the quality of
the data, the computational complexity, the accuracy required and the outcomes
expected.
Overview of general data mining frameworks for building applications
To support the use of data mining technologies for assessing and improving building
performance, several data mining frameworks have been developed. These
frameworks could potentially be used to guide the development of advanced data
mining strategies to discover useful information from building historical data.
A three phase data analysis process for extracting knowledge from building data, as
shown in Figure 2.6, has been proposed by Yu et al. (2013). The first phase is to
define the problem and set the objective which focusses on providing a clear
direction and scope for the data analysis. The second phase collects data from
different sources, including the BAS and field surveys, and then constructs a
20
the typical KDD process with three steps, including data pre-processing, data mining
and results interpretation.
Figure 2.6 A three phase data analysis process for extracting knowledge from building data (Yu et al. 2012).
Fan et al. (2015b) proposed a framework for discovering knowledge from massive
building operational data, as shown in Figure 2.7. This framework begins with data
exploration and data partitioning. The data exploration phase consists of data
pre-processing and data visualisation, where visualisation gives the users a preliminary
understanding of the data. The data partitioning phase is based on significance testing
and clustering analysis so that large BAS datasets can be partitioned into several
subsets for further analysis. The knowledge discovery phase and post-mining phases
21
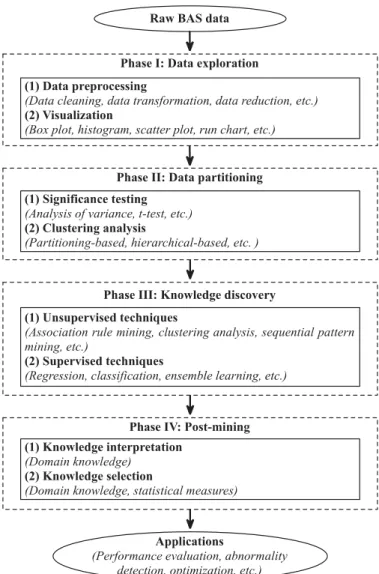
Figure 2.7 Data mining framework for discovering knowledge from massive building operational data (Fan et al. 2015b).
Buchheit et al. (2000) developed another framework for using data mining to
discover knowledge from an intelligent workplace where the framework focusses
more on understanding the domain and the data. Since most data analysis projects are
teamed with engineers with domain knowledge, this knowledge should be fully
utilised to guide the data analysis process, while the data understanding part of the
framework focusses on exploring and visualising the data to understand its
22
Figure 2.8 presents the CRoss-Industry Standard Process Model for Data Mining
(CRISP-DM), which is designed to provide a generic model of the data mining
process that can be specialised according to the needs of particular industries
(Shearer 2000). A CRISP-DM has six main steps, business understanding, data
understanding, data preparation, modelling, and evaluation and deployment.
Figure 2.8 The workflow of CRoss-Industry Standard Process Model for Data Mining (CRISP-DM) (Shearer 2000).
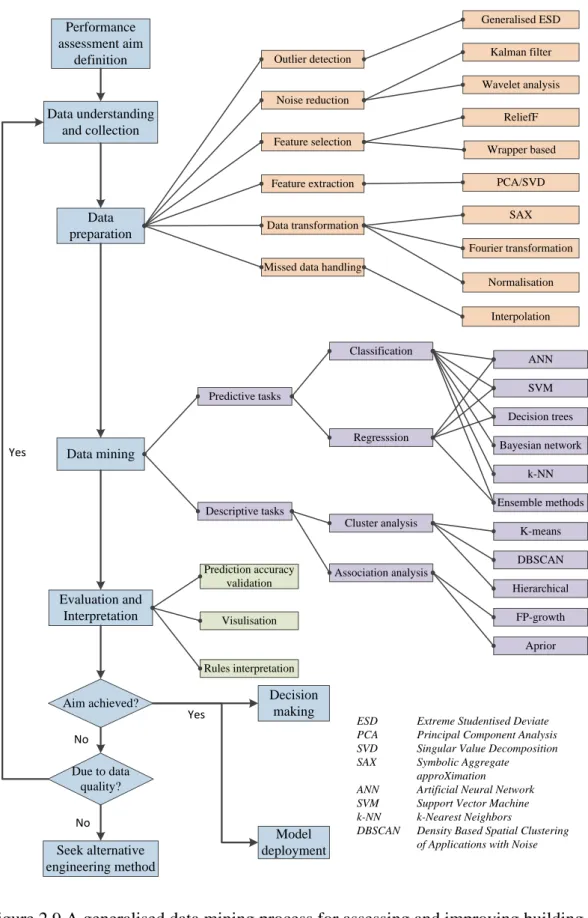
Based on this standard process model, a generalised process of using data mining to
assess and improve building performance is summarised and illustrated in Figure 2.9.
Here typical techniques that can potentially be used in different stages to assess and
improve building performance are also presented.
The process begins by defining the aim of the analysis, and then data from sources
such as BAS, Building Information Model (BIM), on-site measurements and
23
following analysis. The next three steps are the three core steps of the KDD process
in which data preparation (data pre-processing), data mining, and result evaluation
and interpretation (data post-processing) are carried out. The next step determines
whether the defined aim is achieved; if so, the extracted information and predictive
model will be used for decision making or model deployment. The quality of the data
will be checked if the aim is not achieved; if the problem is due to the data quality,
the process from data understanding and collection will be repeated, or alternative
engineering methods will be investigated to achieve the defined aim.
The techniques summarised in Figure 2.9 can serve as a tool box when developing
strategies based on data mining to assess and improve building performance, but
since there is no universal technique, the potential techniques should be selected and
24 Outlier detection Data preparation Noise reduction Feature selection Feature extraction Data transformation Data understanding and collection
Missed data handling
Data mining Evaluation and Interpretation Model deployment Kalman filter Wavelet analysis ReliefF PCA/SVD SAX Fourier transformation Generalised ESD Predictive tasks Descriptive tasks Classification Regresssion Cluster analysis Association analysis ANN SVM Decision trees Bayesian network k-NN Ensemble methods K-means DBSCAN Hierarchical FP-growth Aprior Normalisation Aim achieved? Yes Decision making Seek alternative engineering method Yes Prediction accuracy validation Rules interpretation Visulisation Wrapper based Interpolation Due to data quality? No No Performance assessment aim definition
ESD Extreme Studentised Deviate PCA Principal Component Analysis SVD Singular Value Decomposition SAX Symbolic Aggregate
approXimation ANN Artificial Neural Network SVM Support Vector Machine k-NN k-Nearest Neighbors
DBSCAN Density Based Spatial Clustering of Applications with Noise
Figure 2.9 A generalised data mining process for assessing and improving building performance and the typical techniques that can be used.
25
Over the last decade, a lot of effort has been made to develop advanced data mining
based strategies for assessing and improving building performance, all with different
scales and applications. Figure 2.10 shows the typical applications of data mining
for building performance assessment and improvement, which will be used to guide
the review in the following sections. It should be noted that this thesis mainly focuses
on building performance assessment (i.e. building fault detection and diagnosis and
assessing building energy performance), although literature on predicting building
performance and optimising control is briefly reviewed to better understand current
research in this field.
Data mining in building performance assessment and improvement Building energy performance assessment Bulding fault detection and diagnosis Building performance prediction Building control optimisation Online applications Offline applications Multiple buildings level Individual building level Energy and load
prediction Key performance indicator prediction Surrogate model based optimisation
26
Data mining in fault detection and diagnosis (FDD) of building HVAC
systems
Faulty building systems may result in unsatisfactory thermal control, excessive
energy consumption or even operating breakdowns. It has been found that up to 15%
of the energy used in buildings is wasted due to sensor faults, control faults,
component faults, and system degradation (Mills 2011, Xiao and Wang 2009).
Fault detection is a process to determine whether a system is healthy, whereas fault
diagnosis seeks to reveal the root cause of the fault(s). Katipamula and Brambley
(2005) classified the FDD methods used in building HVAC system as shown in
Figure 2.11. Conventional building FDD methods rely on physical models (Ma and
Wang 2011b, Wang et al. 2012a), and expert knowledge (Schein et al. 2006, Yang et
al. 2008), which may be complicated, computationally intensive, or require
significant domain knowledge.
Diagnostic methods Qualitative model-based Quantitative model-based Process history based Detailed physical models Simplified
physical models Rule-based
Qualitative physics-based
Expert Systems First-principles
based Limits and alarms
Black-box Gray-box
Statistical ANN Other pattern recognition techniques
Figure 2.11 Classification of FDD methods used in building HVAC systems (Katipamula and Brambley 2005).