Assessment Paper
Prevention of Non-Sexual
Transmission of HIV
First published 2011
Copenhagen Consensus Center Copenhagen, Denmark Rush Foundation, Lausanne, Switzerland
© Copenhagen Consensus Center & Rush Foundation ISBN: 978-87-92795-09-0
All rights reserved.
No part of this publication may be reproduced, stored in a retrieval system or transmitted in any form or by any means electronic, mechanical, photo-copying, recording or otherwise, without the prior written permission of the Copenhagen Consensus Center and the Rush Foundation
Assessment Paper
Prevention of Non-Sexual
Transmission of HIV
Lori Bollinger, PhD1
RethinkHIV: The Project
2011 marks the 30-year anniversary since the Centers for Disease Control and Prevention introduced the world to the disease that became known as AIDS. Despite 30 years of increasing knowledge about transmission, prevention, and treatment, and current annual spending of $15 billion, every day around 7,000 people are infected with the HIV virus and two million die each year. The HIV/AIDS epidemic has had its most profound impact in sub- Saharan Africa, which accounts for 70 percent of new worldwide infections and 70 percent of HIV-related deaths, 1.8 million new infections in children each year, and has 14 million AIDS orphans.
Humanitarian organizations warn that the fight against HIV/Aids has slowed, amid a funding shortfall and donor fatigue. Yet HIV is still the biggest killer of women of reproductive age in the world, and of men aged 15-59 in sub-Saharan Africa. Time is ripe for a reassessment of current policy and expenditure.
The Rush Foundation has asked the Copenhagen Consensus Center to commission a group of leading health academics to analyze HIV policy choices and identify the most effective ways to tackle the pandemic across sub-Saharan Africa.
RethinkHIV identifies effective interventions in the fight against HIV/Aids across sub-Saharan Africa. It applies cost-benefit analysis to highlight investments and actions that can make a significant difference.
The Copenhagen Consensus Center has commissioned eighteen research papers by teams of top health economists, epidemiologists, and demographers who examine the cost-effectiveness of a range of responses to HIV/AIDS in sub- Saharan Africa under the following topics:
Efforts to Prevent Sexual Transmission •
Efforts to Prevent Non-Sexual Transmission •
Treatment and Initiatives to Reduce the Impact of the HIV/AIDS Epidemic •
Research and Development Efforts •
Social Policy Levers •
Initiatives to Strengthen Health Systems •
A panel of five eminent economists, including recipients of the Nobel Prize, convenes in the fall of 2011 to carefully consider the research and engage with the authors. The Expert Panel is tasked with answering the question:
If we successfully raised an additional US$10 billion over the next 5 years to combat HIV/AIDS in sub-Saharan Africa, how could it best be spent?
After deliberating in a closed-door meeting, the Nobel Laureate Expert Panel provides their answer, highlighting investments and actions that could be most effective avenues for additional funding. Their findings and reasoning are released in the fall of 2011, and published in full alongside all of the research in a collated volume in 2012.
RethinkHIV will generate global discussion regarding responses to HIV/AIDS in sub-Saharan Africa. To participate in a dialogue on the research and findings within sub-Saharan Africa, a Civil Society Conference and forums for youth are held following the Expert Panel meeting in late 2011.
The Civil Society Conference is a means of creating a dialogue with African civil society and to agree on a set of bold new actionable priorities with society politicians, civil society organizations, influential thought-leaders, and others within sub-Saharan Africa.
It is hoped that the project will motivate donors to direct more money to the investments and actions that are demonstrated to be most effective to curtail the pandemic in sub-Saharan Africa. All of the research papers, and many different perspectives on priorities can be found online at the project’s website:
www.rethinkhiv.com
You are invited to join the dialogue and provide your own perspective on priorities for action in Africa.
The Copenhagen Consensus Center
The Copenhagen Consensus Center is a Danish state-funded think- tank that commissions and promotes research highlighting the most effective responses to global challenges. The Center is led by author Bjorn Lomborg, named ‘one of the 100 Top Global Thinkers’ by Foreign Policy in 2010, ‘one of the world’s 75 most influential people of the 21st century’ by Esquire in 2008, and ‘one of the 50 people who could save the planet’ by the Guardian in 2008. The Copenhagen Consensus Center is implementing the project, which follows the format of past projects such as Copenhagen Consensus 2004, Consulta de San José in 2007, Copenhagen Consensus 2008, and Copenhagen Consensus on Climate in 2009.
www.copenhagenconsensus.com The Rush Foundation
The Rush Foundation, based in Lausanne, is dedicated to providing fast, effective funding for innovative thinking addressing the HIV/AIDS epidemic in sub-Saharan Africa. The Rush Foundation is the sponsor of the project. The Rush Foundation was launched in 2010 to fund sustainable projects in sub-Saharan Africa focused on alleviating the pandemic through innovative thinking, and to shake up the status quo in HIV thinking by spearheading thought leadership projects and debates that will help reframe HIV policy. Among other initiatives, the Rush Foundation is currently designing a grant programme with ActionAid in Africa aimed at generating new, sustainable HIV initiatives on the ground.
www.rushfoundation.org The Papers
The body of research for RethinkHIV comprises 18 research papers. The series of papers is divided into Assessment Papers and Perspective Papers. Each Assessment Paper outlines the costs and benefits of at least three of the most promising responses, interventions, or investments to HIV/AIDS in Sub-Saharan Africa within the respective category. Each Perspective Paper reviews the assumptions and analyses made within the Assessment Paper. In this way, a range of informed perspectives are provided on the topic.
1
Contents
Introduction... 2
Methodology ... 3
Calculating Benefits ... 4
Modeling HIV Infections Averted ... 6
AIDS Impact Model in Spectrum... 7
Goals model (and Goals Express) ... 8
Results ... 11
Safe medical injections ... 11
Safe blood transfusions ... 17
Preventing Mother-to-Child Transmission ... 21
Prevention Interventions for Injecting Drug Users ... 25
Conclusion and Recommendations ... 31
Appendix A ... 35
References ... 37
This version of the Assessment Paper was updated in October 2011, after the
Georgetown University Conference.
The final version of this paper will be available in the forthcoming volume to be
pub-lished by Cambridge University Press in 2012.
2
Introduction
Although much progress against the HIV/AIDS epidemic has been made, the level of new HIV infections remains substantial, and the majority of these new infections continue to occur in sub-Saharan Africa. In 2009, an estimated 2.6 million new HIV infections were recorded worldwide, with nearly 70 percent of these occurring in sub-Saharan Africa. The pace of the epidemic in sub-Saharan Africa has slowed; between 2001 and 2009, the number of new infections in sub-Saharan Africa decreased from 2.2 million to 1.8 million. The recent Political Declaration on HIV/AIDS, adopted by the United Nations program on AIDS (UNAIDS) General Assembly on 10 June 2011, renewed member countries’ commitment to avert new HIV infections through focused prevention efforts, including eliminating HIV infections transmitted vertically, and to increase the number of people on antiretroviral therapy to 15 million by 2015 [UNAIDS, 2011a].
The continued need for both prevention and treatment funding for HIV/AIDS is combined with stagnant or even diminishing financial resources. Although funding has increased substantially in the last decade, spending remained approximately the same between 2008 and 2009, only increasing from US$15.6 billion to US$15.9 billion. Because the funding need increased over that year, the funding gap increased from US$7.7 billion in 2008 to US$10 billion in 2009 [UNAIDS, 2010]. The question asked by RethinkHIV is thus particularly relevant at this juncture: How can an additional US$10 billion be spent over the next five years to fight HIV/AIDS in sub-Saharan Africa?
A recent series of studies modeling the modes of transmission for five Eastern and Southern Africa countries estimated that the majority of new HIV infections are transmitted via sexual behavior. The studies found, however, that some new infections did occur via non-sexual transmission, including unsafe medical injections, unsafe blood transfusions, and needle-sharing behavior among injecting drug users (IDU) [UNAIDS, 2009; see Figure 1].
3
The average percentage of new HIV infections (excluding those transmitted vertically) from unsafe medical injections was one percent across the five countries summarized in the study, ranging from a low of 0.2 percent in Swaziland to a high of 2.21 percent in Kenya. The average percentage due to blood transfusions was even lower, at 0.16 percent, ranging from zero percent in Lesotho and Uganda to 0.4 percent in Swaziland. Finally, the average percentage of new HIV infections that was attributed to IDU needle-sharing behavior averaged 1.8 percent for the five countries, ranging from zero percent in Lesotho to almost four percent in Kenya. Note that, although these modes of transmission modeling studies did not examine the proportion of new infections due to vertical transmission, a significant number of new infections do continue to occur via transmission from mother to child throughout sub-Saharan Africa; approximately 350,000 new HIV infections occurred in children due to vertical transmission in 2008, or 18 percent of the total number of new HIV infections that occurred in sub-Saharan Africa in 2008 [UNAIDS, 2010].
Most HIV infections caused by non-sexual transmission have proven cost-effective solutions to reduce and virtually eliminate transmission of new infections. Transmission of HIV through unsafe medical injections can be eliminated through the use of automatic disposable syringes, a relatively inexpensive intervention, along with appropriate waste disposal methods. Screening blood that is to be used in blood transfusions for HIV has been shown to be extremely cost-effective in a wide variety of settings. Preventing mother-to-child transmission of HIV by providing antiretroviral drugs to both mother and child is also a cost-effective intervention, even when continued throughout the breastfeeding period in order to reduce transmission via breastfeeding. Finally, some interventions preventing transmission through needle-sharing behavior among injecting drug users (IDU) may be cost-effective, such as outreach programs including information and education campaigns, as well as needle and syringe exchange programs, although other programs such as opioid substitution therapy (OST) may not be cost-effective.
This paper will examine the cost-effectiveness of each of these proposed solutions for sub-Saharan Africa, using a variety of models across all of the relevant countries, described in the Methodology section below.
Methodology
The purpose of economic evaluation is to assist policymakers in making decisions among various program alternatives. Several different approaches can be taken: cost-effectiveness analysis, which evaluates the cost of an intervention relative to a nonmonetary outcome, such as number of cases averted for a particular disease or number of life years saved; cost-utility analysis, which evaluates the cost of an intervention relative to an outcome expressed in utility terms, such as Quality-Adjusted Life Years (QALYs); or benefit-cost analysis, which evaluates the cost of an intervention relative to a monetized outcome, calculated as the monetary benefits that accrue from implementing the intervention. In this paper, both cost-effectiveness and benefit-cost analyses are performed for the four sets of interventions described above.
Within HIV/AIDS, the cost-effectiveness of prevention interventions is analyzed by examining the incremental cost of averting one HIV infection. Two different sets of assumptions must be made in order to perform this analysis: the incremental costs associated with implementing the prevention
4
intervention, and the number of HIV infections averted, which is usually derived from modeling exercises. The incremental cost effectiveness ratio (ICER) can then be calculated by dividing the incremental cost associated with the intervention by the number of DALYs saved through implementing the intervention, following recent literature in multiplying HIV infections averted by 20 for adults and 25 for children to calculate DALYs [Bertozzi et al., 2006; Murray et al., 2006]. The incremental costs are calculated by multiplying a unit cost specific to the intervention and country by the increase in the number of people reached by the intervention. Using the standardized definitions developed by the Commission on Macroeconomics and Health and utilized by the World Health Organization (WHO) CHOICE (CHOosing Interventions that are Cost-Effective) network, we define an intervention as highly cost-effective if the ICER is less than the country’s annual gross national income (GNI) per capita, cost-effective if the ICER is between one and three times the country’s annual GNI per capita, and not cost-effective if the ICER is greater than three times the country’s annual GNI per capita [Commission on Macroeconomics and Health, 2001; WHO, 2011]. Note that the GNI per capita using the Atlas method across sub-Saharan Africa in 2009 was US$1,125, while the GNI per capita adjusted for purchasing power parity in sub-Saharan Africa in 2009 was US$2,051 [World Bank, 2011].
Details of specific costs, coverage rates and target populations are described for each of the four sets of interventions in their specific sections below. The general methodology used in modeling HIV infections averted is described further below.
Calculating Benefits
In order to calculate the benefit-cost ratio (BCR), an additional set of assumptions must be made regarding the benefits associated with averting one HIV infection. In this paper, following guidelines provided by RethinkHIV, benefits are assumed to be the sum of the treatment savings associated with an averted HIV infection, as well as the value of the number of lives saved with the valuation performed at two different levels: US$1,000 per life year gained, and US$5,000 per life year gained. The savings that accrue because an HIV infection does not have to be treated consists of two parts: the lifetime discounted cost of providing someone with antiretroviral therapy (ART), including assumptions about the costs of ART, survival on ART, as well as the appropriate discount rate, and the lifetime discounted cost of treating opportunistic infections, again with assumptions about costs and discount rates. Following the recommendation of RethinkHIV, in order to ensure consistency of results across papers, we assume that the cost of ART is either US$500 or US$1,000 per year for 20 years, with the discount rate varying between three percent and five percent. The ART cost consists of all costs associated with delivering ART, including the cost of antiretroviral drugs, laboratory monitoring tests, and service delivery costs.
Note that the assumption of a 20-year time horizon for providing ART assumes that the continuation rate is 97 percent throughout the duration of treatment. This 20-year time horizon aligns with recent findings from a cohort study in Uganda that found an average life expectancy of between 26.7 and 27.9 years for over 22,315 ART patients [Mills et al., 2011]. This study assumes a 30 percent mortality rate for those lost to follow-up, a rate which was found to be 6.4 percent of the total patient population. Note that another study finds a slightly higher mortality rate of 47 percent to those lost to follow-up [Mahy et al., 2010]; applying this higher mortality rate to the Uganda data would result in a decrease of the overall life expectancy calculated in the Uganda study, aligning it even more closely
5
with the life expectancy of 20 years assumed here.
In addition to the benefits that accrue from savings associated with not providing ART because of the averted HIV infection, savings are realized because opportunistic infections (OI) do not have to be treated, either. Here, we assume that one averted HIV infection results in three years of savings regarding OIs, with the first year occurring at the beginning of the time of infection, and the second and third years occurring at the end of life discounted appropriately. The OI savings consists of two parts: the drug and laboratory test costs used in treating opportunistic infections, and the associated service delivery cost. Because different opportunistic infections occur with varying frequency across patients and countries, we use a cost of US$47.94 for drugs and laboratory tests, which is calculated from the annual median cost for drugs and laboratory tests across four recent studies in sub-Saharan Africa: Cote d’Ivoire [Goldie et al., 2006]; Rwanda [Vinard et al., 2005]; Uganda [Chandler et al., 2005]; and Zambia [Kombe et al., 2004]. This unit cost for drugs and laboratory tests is combined with the cost of delivering the treatment, which in turn consists of two parts. The first part is the cost of treating opportunistic infections in the hospital, and is calculated as the product of the annual median number of inpatient days for patients being treated for opportunistic infections, calculated from the same literature cited above, and an average cost for sub-Saharan Africa for one bed day at a primary-level hospital, available from the WHO-CHOICE database for sub-Saharan Africa [WHO, 2010]. The second part of the service delivery cost for OIs is the cost of treating opportunistic infections in a health centre setting, and is calculated as the annual median number of outpatient visits for patients being treated for opportunistic infections, calculated using the literature cited above, and an average cost for sub-Saharan Africa for one 20-minute outpatient visit at a health centre, at the mid-range of capacity utilization, again from the WHO-CHOICE database for sub-Saharan Africa. Overall, the service delivery portion of the unit cost for treating opportunistic infections equals US$145.48, which implies a total annual cost savings of US$193.42 due to each averted HIV infection.
T a b l e 1 : V a l u e o f l i f e t i m e d i s c o u n t e d A R T a n d o p p o r t u n i s t i c i n f e c t i o n t r e a t m e n t , U S $
Treatment cost per year
Discount rate of 3% Discount rate of 5% ART: 500 per year 7,052 6,044 ART: 1,000 per year 14,068 12,056 Opportunistic infections 424 355
Combining all of the assumptions above results in the lifetime discounted value of ART varying from a low value of US$6,044 to a high value of US$14,068, depending on both the assumption of ART cost per year and the discount rate, while the lifetime discounted cost of treating opportunistic infections varies between US$424 and US$355, depending on the discount rate (see Table 1). Note that, however, not all people who became infected with HIV would have received ART, as coverage is less than 100 percent in sub-Saharan Africa; thus we apply the 2009 estimated ART coverage for sub-Saharan Africa of 37 percent to calculate the averted ART costs associated with one HIV infection averted. We assume, however, that all HIV-infected people would receive treatment for opportunistic
6
infections.
In addition to the benefits that accrue from an averted HIV infection because of the averted treatment costs, both for antiretroviral therapy and for opportunistic infections, RethinkHIV requested that the value of life years gained be included in the calculation of benefits associated with an averted HIV infection, valuing each life year gained at both US$1,000 and US$5,000, discounted at both three percent and five percent. We assume further that the 63 percent of HIV-infected people not receiving ART survive on average an additional 11 years, and that ART provision begins on average seven years after someone becomes infected. We assume an average life expectancy for sub-Saharan Africa of 65 years for adults [United Nations, 2011], while further assumptions are made below regarding the age at which an adult infection is averted for each of the sets of interventions.
The exception to this is the set of assumptions regarding the age at which an infection is averted for interventions preventing mother-to-child transmission (pMTCT), as these interventions avert infant HIV infections. First, we assume that the 72 percent of HIV-infected children not receiving ART survive on average five years, and that children begin receiving ART at age one year. Second, we assume a life expectancy at birth of 52.5 years [United Nations, 2011]. Finally, note that some controversy surrounds the valuation of an infant’s life; some economists argue that high rates of infant and child mortality in developing countries imply that the value of an infant’s life that is saved should not receive full weight for every year of life expectancy [Jamison in Lomborg, 2010]. Because this assumption is crucial here in the evaluation of the benefits associated with pMTCT programs, we calculate the number of life years gained by an averted infant HIV infection in two ways: assuming that the averted infection receives the full credit of 52.5 years for life expectancy, and receiving half of the credit of life expectancy.
Combining all of these assumptions regarding the valuation of a saved life from averting one HIV infection results in benefits varying from about US$4,900 to US$91,000 (see Table 2). The values in this table will be used in calculating the benefits in each of the sections below, along with the benefits associated averted treatment costs.
T a b l e 2 : V a l u e o f l i f e s a v e d , b y a g e , v a l u e o f l i f e y e a r a n d d i s -c o u n t r a t e ( i n U S $ 0 0 0 ) Value of life year saved = $1,000, discounted 3% Value of life year saved = $5,000, discounted 3% Value of life year saved = $1,000, discounted 5% Value of life year saved = $5,000, discounted 5%
Life saved as infant $18.2 $91.0 $13.3 $66.3 Life-year of infant =
0.5 adult life-year $9.1 $45.5 $6.6 $33.1 Life saved at 22 $11.4 $56.9 $6.9 $34.5 Life saved at 27 $8.5 $42.6 $4.9 $24.4
Modeling HIV Infections Averted
Here, two different models are used to calculate the number of HIV infections averted due to implementing the four different sets of prevention interventions: the AIDS Impact Model in Spectrum
7
is used to model the impact of pMTCT programs, and the Goals model along with a minor adaptation of it called Goals Express is used to estimate the impact of the other three prevention interventions. Each of the models is described in detail below.
AIDS Impact Model in Spectrum
Spectrum is a suite of easy-to-use policy models which provide policymakers with an analytical tool to support the decision making process. Spectrum consists of several software models including a demographic projection module (DemProj), a module for family planning (FamPlan), the AIDS Impact Model which examines the demographic and social impact of the HIV/AIDS epidemic, the Goals module which examines the cost and impact of HIV interventions, the Lives Saved Tool (LiST), and the RAPID model (Resources for the Awareness of Population Impacts on Development), among others.
The AIDS Impact Model (AIM) projects the consequences of the HIV epidemic, including the number of people living with HIV, new infections for both adults and children, and AIDS deaths by age and sex, as well as the new cases of tuberculosis and AIDS orphans. AIM requires an input assumption about the past and future course of adult HIV incidence, usually calculated by using the Estimation and Projection Package (EPP)1, as well as assumptions about current programmatic statistics
regarding treatment coverage of both ART and pMTCT programs. Note that both EPP and AIM are reviewed by the UNAIDS Reference Group on Estimates, Models and Projections, a group established to provide advice on estimating national HIV prevalence patterns.
After adult HIV incidence and treatment coverage are entered into the Spectrum/AIM model, assumptions about other HIV/AIDS characteristics can also be entered for variables such as the survival period from HIV infection to AIDS death, the age and sex distribution of new HIV infections, and the perinatal transmission rate. Before AIM can be used, a demographic projection must be prepared using DemProj, one of the Spectrum systems of policy models. The demographic projection is modified by AIM through AIDS deaths and the impact of HIV infection on fertility. The Epidemiology section of AIM calculates the number of HIV infections, AIDS cases, and AIDS deaths. This information is then used in the Treatment Costs section to calculate the costs of treatment for pMTCT, HIV/AIDS, and AIDS-associated tuberculosis (TB) and opportunistic infections (OI); the Impacts section to calculate various indicators of demographic and social impact; and the Orphans section to calculate the number of orphans. The manuals associated with the various modules describe the underlying equations and assumptions for all of the components of each module2.
AIM is used by UNAIDS in collaboration with their national partners to make the national and regional estimates it releases every two years [Stover et al., 2010]. In this exercise, national HIV/AIDS programs collaborate with UNAIDS to estimate the HIV/AIDS incidence and prevalence in their country, including providing programmatic statistics on coverage of antiretroviral therapy and programs preventing mother-to-child transmission (pMTCT). Default data files are available with the public release of Spectrum for all low- and middle-income developing countries; these files contain the approved national-level HIV estimates and programmatic statistics.
1 Available at http://www.unaids.org/en/dataanalysis/tools/estimationandprojectionpackageepp/ 2 Model and manuals are available at http://futuresinstitute.org/
8
We use these default data files in the AIM module to calculate new HIV infections due to vertical transmission. The mother-to-child transmission rate is the percentage of babies born to HIV-infected mothers who will be infected themselves. Studies have found that this percentage varies substantially depending on whether antiretrovirals (ARV) are used and whether breastfeeding occurs, ranging from a low level of transmission around 2% when women receive triple preventive therapy and do not breastfeed, to 35% or more when women receive no preventive ARV drugs and continue breastfeeding for more than 18 months. We describe further below in the pMTCT section the scenarios utilized in this analysis, including the treatment options selected with their associated HIV vertical transmission rates, costs assumed, and scale-up patterns utilized.
Goals model (and Goals Express)
The Goals model is intended to support strategic planning at the national level by providing a tool to link program goals and funding. The model has been used by many countries to assist in the national planning process [Forsythe et al., 2009]
The model can help answer several key questions in the fight against HIV/AIDS, including:
Which goals can be achieved?
How much funding is required to achieve these goals?
How does funding allocation influence achieving strategic program goals?
The Goals model links budget line items to coverage of services, behavior change and prevention of new infections. The model starts with budget line items. These are mapped to the major categories of prevention (e.g., voluntary testing and counseling (VCT), school-based programs, condom promotion), care and treatment (e.g., palliative care, treatment of opportunistic infections, provision of ART), and program operation (e.g., policy, advocacy, management). For each of the prevention, care and support categories the model calculates coverage, that is, the percentage of the population in need of the service that is exposed to the information or utilizes the service, by dividing the budget amount by the target population. This calculation uses unit costs that are either based on local cost studies, if available, or on international experience.
9
Figure 2: Schematic of the Goals model
Coverage of prevention activities is then linked to behavior change (see Figure 2). The model contains an impact matrix developed from almost 200 studies of prevention interventions [Bollinger, 2008]. This matrix describes how coverage of various prevention activities (such as VCT, school-based programs and community mobilization) affects four key behaviors (condom use, number of partners, age at first sex and sharing needles) among five risk groups (high-risk heterosexual, medium-risk heterosexual, low-risk heterosexual, men who have sex with men, and injecting drug users (IDU)). In a typical application high-risk refers to sex workers and their clients, medium-risk refers to men and women who have multiple partners and low-risk refers to men and women who have a single partner. People who are in more than one risk group are classified according to their highest-risk group.
An HIV transmission model calculates how changes in sexual behavior reduce the number of new infections. The model also calculates the impact of needle-sharing on new infections in the IDU population. The results are displayed in terms of HIV prevalence or incidence among all adults (15-49) in the five risk groups. The model also calculates the incremental cost per infection averted. The probability of infection is calculated using an equation implemented in the AVERT model [Weinstein et al., 1989; Bouey et al., 1998]. This equation calculates the probability of infection as a function of HIV prevalence in the partner population, the transmissibility of HIV, the impact of a sexually transmitted infection on HIV transmissibility, the proportion of the population with sexually transmitted infections, condom use or needle-sharing use, numbers of partners per year and number of sexual or needle-sharing contacts with each partner. The general equation is:
10
ProbInfr,s = 1 – {pr,pΣswr,s[1 – rgs(1-fre)]nr + (1 – pr,p)}mr
Where:
ProbInfr,s = probability of a person in the target population of risk group r becoming
infected with HIV
pp = HIV prevalence in the partner population
ws = proportion of the target population in one of four possible states (has no sexually
transmitted infection, has an ulcerative STI, has an inflammatory STI, has both an ulcerative and inflammatory STI)
rgs = the transmissibility of HIV given STI state s and partner combination g, where g has
three possible states (male to female, female to male, and male to male)
fr = proportion of sexual contacts involving condom use/needle-sharing use
e = efficacy of condom use in preventing HIV transmission
nr = number of sexual/injecting contacts per partner per year in risk group r
mr = number of partners per year in risk group r
The prevention interventions are intended to reduce the transmission of new HIV infections. Except for safe blood and safe medical injections, all the prevention interventions operate by changing behaviors that are linked to HIV transmission. Four types of behavior are affected by the prevention interventions in the model:
Condom use
Number of sexual partners
Age at first sex
Injecting drug user behavior
Each prevention intervention can affect any or all of the four key behaviors. The effects may be different depending on the risk group. Thus a sex worker intervention may affect condom use and number of partners among high-risk women or men, but would not be expected to affect age at first sex or other behaviors among low- risk men or women. School-based interventions may affect age at first sex, condom use and numbers of partner among the medium-risk population but would not be expected to affect high-risk populations.
Several prevention interventions may affect the same behaviors in the same risk groups. Therefore, the impact of interventions on condom use is calculated as the percentage reduction in non-use. Impacts on the other behaviors are calculated as percentage reductions in the number of partners per year and reduction in percentage of IDU sharing needles, as well as percentage increases in age at first sex.
Goals Express adapts the general methodology of the fully articulated Goals model by utilizing the framework of the UNAIDS Modes of Transmission (MOT) model [UNAIDS, 2007; Futures Institute, 2011]. Because the MOT model includes consideration of the two medical interventions examined here (safe medical injection, blood safety), while the full Goals model does not, we use a combination
11
of the Goals Express and MOT models to model the number of infections averted by each of these two interventions. Basically, the same HIV transmission equation is used, but is adapted to the context of medical injections and blood transfusions and utilized in this transformed state in the MOT model, where:
partner HIV prevalence is assumed to be the HIV prevalence rate for the general population, which varies by country;
the number of partners is assumed to be one, as the analogous risk here is one syringe in the case of safe medical injections, and one unit of blood in the case of blood safety;
the number of acts of exposure per year is the number of unsafe medical injections adults receive on average during a year and the probability that a blood transfusion is received;
the percentage of acts protected is the coverage rate of those injections that occur following safe injection practices and the percentage of donated blood units that are tested for HIV, which varies by country.
Results
Safe medical injections
Unsafe injection practices exist throughout the developing world; research has found that up to 40 percent of injections across the developing world follow the practice of re-using syringes [Hutin et al., 2003]. There are many reasons for these practices, among them a lack of awareness of the possible dangers in re-using syringes, a limited supply of syringes, and a lack of training of medical staff in safe disposal of medical waste. In addition, people tend to receive more injections per capita as part of standard medical treatment protocols, partly because of the belief that the injections are medically necessary, and partly because injection-based treatments sometimes receive higher fees [AIDSTAR-One, 2011]. One recent study in Uganda found that HIV prevalence was significantly higher among those people who received five or more medical injections in the previous year relative to those who did not receive a medical injection at all [Mishra et al., 2008].
A complete program to make medical injections safer has a number of different components [MMIS, 2011]:
Adequate supply of auto-disposable (AD) syringes
Training for staff to utilize syringes
Safe disposal of medical waste
12
Figure 3: Percentage of men and women receiving a medical injection in the last year, by age group, various Demographic and Health Surveys
Although not all medical injections are unsafe for HIV transmission, as even those injections that re-use syringes must be contaminated with HIV in order to transmit the virus, all injections must be made safe in order to ensure safe medical injections. We calculate here both the costs, the benefits and the infections averted from making all medical injections safe, based on assumptions regarding target population, coverage rates for safe medical injections (both baseline and target coverage rates), unit costs, and the transmission probability for each of the sub-Saharan Africa countries. Note that in this paper we only examine implications for the HIV infections that would be averted; other infections would also be averted, such as hepatitis B and hepatitis C, the benefits of which are not calculated here.3
Target population: We begin by following the MOT model methodology in assuming that the adult population is the main source of new HIV infections occurring via unsafe medical injections. We assume that the HIV prevalence rate faced by uninfected adults is the general HIV prevalence rate for that population throughout the time period; the implicit assumption here is that the number of new HIV infections resulting from any unsafe medical injections will be small enough that the general population HIV prevalence rate is not affected. We use the adult population and relevant HIV prevalence rate (ages 15 and above) from the most recent publicly available Spectrum demographic projection files, which use projections from the United Nations Population Division, for the 44 sub-Saharan countries listed in Appendix A. In addition, we follow assumptions used in calculating previous Global Burden of Disease statistics that adults in sub-Saharan Africa receive an average of 2.1 injections per year, and that 18 percent of those injections are unsafe [Hauri et al., 2004].
In order to ascertain the average age to use to calculate the value of life years gained with an HIV infection averted through safe medical injections, we examined the frequency of medical injections by
3 The benefits would be extremely small, as the protocol for Hepatitis B exposure is to receive the vaccination for Hepatitis B,
which the person may already have had, while no prophylaxis at all is recommended for Hepatitis C exposure [Centers for Disease Control, 2001]. Note that the cost for a single vial dose of the Hepatitis B vaccine is $0.40 [UNICEF, 2011].
13
age group for several sub-Saharan African Demographic and Health Surveys. Figure 3 shows that the highest frequency of injections generally occurs in the age group 25-29; hence an average age of 27 is used here in order to calculate the number of life years gained.
Coverage: Where available, we use initial baseline coverage rates for safe medical injections from country-level workbooks developed by national teams in a series of workshops sponsored by UNAIDS. These workshops estimated the resources required to address the HIV/AIDS epidemic in their country, and contain country-validated data for a large number of interventions [Stover and Forsythe, 2010]. Where no country-level workbook exists, we use a regional median calculated based on these data, which in this case is about five percent. We assume that coverage levels reach 95 percent of all those receiving a medical injection with an AD syringe and appropriate waste disposal by 2015, using a linear scale-up pattern.
Unit cost: The cost of each of the four different prevention interventions varies both by intervention and by country, except in the case of safe medical injections. For safe medical injections, we use two different assumptions regarding unit cost. First, we assume that the incremental cost of using an AD syringe is equal to the international price achieved by UNICEF in their immunization programs, based on the assumption that sub-Saharan Africa would be able to achieve this same low price, and that there are no non-traded goods or services associated with the intervention. The incremental cost of an AD syringe used here for all countries is the difference between the UNICEF price for a regular syringe (US$0.04) and the UNICEF price for an AD syringe (US$0.06), or US$0.02 [UNICEF, 2009 and 2010a].In addition, we include costs for training, waste disposal and public education programs related to safe medical injections. One recent estimate calculated the cost for these three components to be less than US$0.01 per injection [WHO SIGN, quoted in Koska et al., 2007]. Adding this to the unit cost of an AD syringe would result in a total unit cost per injection of US$0.03, or total annual cost per person of US$0.062.
We vary this unit cost assumption by utilizing data from a South African intervention which reported a cost of US$0.036 for the AD syringe and a disposal cost of US$0.024, for a total cost per injection of US$0.06 [PATH, 2007], which is double the first unit cost. Note that these unit costs are for AD syringes; the cost of retractable syringes is significantly higher.
Transmission probability: We follow the methodology in the MOT and Goals Express models in using an HIV transmission probability of 0.45 percent per injection, which is calculated as the average of the HIV transmission risk for accidental needle sticks of 0.24 percent and the risk of HIV transmission in IDU needle-sharing behavior of 0.65 percent [Lopman et al., 2006].
Based on the above assumptions, the modeling exercise indicates that a total of approximately 68,000 HIV infections could be averted across sub-Saharan Africa between 2011 and 2015 as a result of making 95 percent of all medical injections safe. Assuming a three percent discount rate and a unit cost of US$0.03 per injection, the ICER for safe medical injections across sub-Saharan Africa is US$ 136, which is significantly lower than the PPP-adjusted GNI per capita value of US$2,051 for sub-Saharan Africa, making this a highly cost-effective intervention.
We then proceed to calculate the benefits associated with implementing this intervention. Table 3 below presents eight different scenarios, which vary depending on the values for the three different sets of parameters requested by RethinkHIV regarding calculating benefits, that is, the discount rate,
14
the value of life year saved and the annual cost of ART. These scenarios are:
Scenario I: Discount rate of 3 percent, value of one life year saved equal to US$1,000, annual cost of ART US$500
Scenario II: Discount rate of 5 percent, value of one life year saved equal to US$1,000, annual cost of ART US$500
Scenario III: Discount rate of 3 percent, value of one life year saved equal to US$5,000, annual cost of ART US$500
Scenario IV: Discount rate of 5 percent, value of one life year saved equal to US$5,000, annual cost of ART US$500
Scenario V: Discount rate of 3 percent, value of one life year saved equal to US$1,000, annual cost of ART US$1,000
Scenario VI: Discount rate of 5 percent, value of one life year saved equal to US$1,000, annual cost of ART US$1,000
Scenario VII: Discount rate of 3 percent, value of one life year saved equal to US$5,000, annual cost of ART US$1,000
Scenario VIII: Discount rate of 5 percent, value of one life year saved equal to US$5,000, annual cost of ART US$1,000
Assuming that the average age of an averted HIV infection for safe medical injections is 27, the number of HIV infections averted translates into 2.6 million life years gained (undiscounted - see Table 3). T a b l e 3 : B e n e f i t s a s s o c i a t e d w i t h s a f e m e d i c a l i n j e c t i o n s b y d i s c o u n t r a t e , v a l u e o f l i f e y e a r g a i n e d , a n d A R T c o s t ( i n m i l -l i o n s U S $ ) S c e n a ri o I (3 % , $ 1 ,0 0 0 , $ 5 0 0 ) S c e n a ri o I I (5 % , $ 1 ,0 0 0 , $ 5 0 0 ) S c e n a ri o I II (3 % , $ 5 ,0 0 0 , $ 5 0 0 ) S c e n a ri o I V (5 % , $ 5 ,0 0 0 , $ 5 0 0 ) S c e n a ri o V (3 % , $ 1 ,0 0 0 , $ 1 ,0 0 0 ) S c e n a ri o V I (5 % , $ 1 ,0 0 0 , $ 1 ,0 0 0 ) S c e n a ri o V II (3 % , $ 5 ,0 0 0 , $ 1 ,0 0 0 ) S c e n a ri o V II I (5 % , $ 5 ,0 0 0 , $ 1 ,0 0 0 )
Years of life gained
(undiscounted) 1.4
Value of years gained $581 $332 $2,90
7 $1,66 1 $581 $332 $2,90 7 $1,66 1
OI treatment costs averted $29 $24 $29 $24 $29 $24 $29 $24
ARV treatment costs averted $178 $153 $178 $153 $355 $304 $355 $304
Total $788 $509 $3,11 4 $1,83 8 $965 $661 $3,29 1 $1,98 9
15
To give an initial example of calculating the value of life years gained, we examine Scenario I, assuming that the discount rate is 3 percent, the value of each life year gained is US$1,000, and the annual cost of ART is US$500. We then calculate the value of life years gained by multiplying the number of HIV infections averted (about 68,000) by the value of a life saved at age 27 (about $8,500 – see Table 2). The OI treatment costs averted are calculated by multiplying the number of HIV infections averted by the discounted lifetime cost of treating OIs, discounted at 3 percent (US$424 – see Table 1). Finally, we calculate the averted ARV treatment costs by multiplying the number of HIV infections averted assuming that the annual cost of delivering ART is US$500 and the discount rate is 3 percent (US$7,052 – see Table 1), and then multiplying this by the ART coverage rate of 37 percent. The three components are then summed to reach the total benefits associated with Scenario I. If a value of US$1,000 per life year gained is assumed, the table indicates that the value of the total number of life years gained varies between US$332 million and US$581 million, depending on whether a three percent or a five percent discount rate is used. If the value of each life year gained is increased to US$5,000 instead of US$1,000, the value of the total number of life years gained also increases, varying from between US$1.7 billion to US$2.9 billion, again depending on the discount rate used.
The first two scenarios in Table 3 display the results for averted costs relative to treating opportunistic infections (OI) that vary depending on whether a five percent discount rate or three percent discount rate is assumed, varying between US$24 million and US$29 million, respectively. Since the only parameter that varies with respect to treating OIs is the discount rate, these two results are repeated three times across the columns of the results table.
Scenarios I and II also display the results of the ARV treatment costs that are averted, assuming that the cost of providing ART is US$500 per year for 20 years, discounted by three and five percent respectively. In the first scenario, US$178 million is saved in averted ART costs by scaling-up safe medical injections to cover 95 percent of the population in sub-Saharan Africa. In the second scenario, where a five percent discount rate is used instead of a three percent discount rate, the total ART costs averted amount to over US$150 million. When the cost of providing ART is assumed to increase to US$1,000 per year for 20 years, using a discount rate of three percent results in total savings associated with averted ARV treatment costs of approximately US$304 million (see Scenarios V and VII). Using a discount rate of five percent results in a slight decrease in these overall ARV treatment cost savings, reducing the total amount saved to slightly less than US$355 million (see Scenarios VI and VIII).
When all three components of the benefits associated with averting an HIV infection through a safe medical injection are summed, the total amount saved varies from a low of US$509 million, which results from assuming a five percent discount rate, a value per life year gained of US$1,000, and an annual cost of US$500 to deliver ART, to a high of US$3.3 billion, which results from assuming a three percent discount rate, a value per life year gained of US$5,000, and an annual cost of US$1,000 to deliver ART. Thus the savings associated with scaling-up safe medical injections to cover 95 percent of all injections delivered in sub-Saharan Africa by 2015 will result in substantial savings.
16
Once the benefits of this intervention are calculated and aggregated, we can compare the total sum of benefits with the associated costs by calculating the various benefit-cost (B/C) ratios associated with the eight different scenarios. We add one more parameter to the mix in calculating the various B/C ratios by varying the unit costs associated with performing a safe medical injection, in order to provide a range of estimates. We double the cost here in order to provide an upper bound on the possible costs associated with the intervention, which then becomes a lower bound on the B/C ratio (see Table 4). T a b l e 4 : B e n e f i t / C o s t r a t i o s f o r s a f e m e d i c a l i n j e c t i o n s b y v a l u e o f l i f e y e a r g a i n e d , d i s c o u n t r a t e , c o s t s o f A R T , a n d u n i t c o s t o f i n j e c t i o n ( i n m i l l i o n s U S $ ) Discoun t rate Benefits Costs B/C Ratio (A)/(A) B/C Ratio (A)/(B) B/C Ratio (B)/(A) B/C Ratio (B)/(B) Value of life year $500 ART (A) $1,000 ART (B) US$0.0 3 (A) US$0.0 6 (B) $1,000 3% $788 $965 $166 $333 4.7 2.4 5.8 2.9 $1,000 5% $509 $661 $155 $311 3.3 1.6 4.3 2.1 $5,000 3% $3,114 $3,291 $166 $333 18.7 9.4 19.8 9.9 $5,000 5% $1,838 $1,989 $155 $311 11.8 5.9 12.8 6.4
We present four different sets of B/C ratios, which are based on different combinations of benefits associated with a US$500 annual cost of ART (Benefits (A)) and benefits associated with a US$1,000 annual cost of ART (Benefits (B)), as well as with costs associated with a unit cost of US$0.03 per injection (Costs (A)) and costs associated with a unit cost of US$0.06 per injection (Costs (B)). The scenarios for parameters that vary for the benefits calculated, described in detail in Table 3 above, are displayed in the rows of Table 4, with the value per life year gained varying between US$1,000 and US$5,000 and the value of the discount rate varying between three and five percent.
Results shown in the table indicate that the B/C ratio for covering 95 percent of all medical injections safely in sub-Saharan Africa by 2015 varies from a low of 1.6, that is, US$1.60 of benefits are gained for every dollar of expenditures, to a high value of 19.8, that is, US$19.80 of benefits are gained for every dollar expended. The lowest B/C ratio is attained when the value of a life year is US$1,000, ART costs are only US$500 per year, the cost per AD syringe used is US$0.06, and the discount rate is five percent. The highest B/C ratio calculated is based on a value per life year gained of US$5,000, ART costs of US$1,000 per year, the lower cost per AD syringe of US$0.03, and a discount rate of three percent. In all cases, providing safe medical injections results in B/C ratios significantly greater than one, the break-even point.
17
Safe blood transfusions
Due to the presence of anemia and other factors, blood transfusions are more common in sub-Saharan Africa than in developed countries. Studies have found that up to 70 percent of all admitted hospital patients are anemic, a condition that can be caused either by poor nutrition (i.e., a lack of iron in the diet) or by infection with malaria, particularly in the case of pregnant women [Soares et al., 2011; Kasili, 1990]. Safe blood transfusions are reported to exist in sub-Saharan Africa, although rigorous quality control standards are still lacking to some degree [Harries et al., 2010]. South Africa in particular has had success in providing safe blood transfusions; by 2008, the South African government reported that since the introduction of nucleic acid amplification testing (NAT) for HIV in 2005, no HIV transmission had been linked to blood transfusions in the country [Flanagan, 2008].
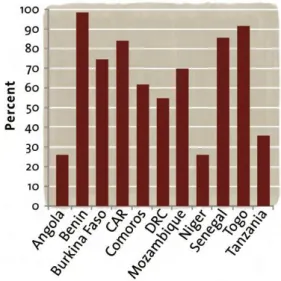
Testing donated blood for possible contamination with HIV in a quality-assured manner is one of the required indicators for country-level reporting for UNGASS. Many of the countries report that 100 percent of their blood supply meets this requirement, while there are still some countries reporting less than 100 percent coverage of their blood supply [UNAIDS, 2010, Annex 2]. While some sub-Saharan Africa countries with less than universal coverage report rates close to 100 percent (Benin, Togo), other countries report rates substantially lower (Angola, Niger, United Republic of Tanzania) (see Figure 4). We calculate below the costs and benefits of increasing coverage so that all sub-Saharan Africa countries have 100 percent coverage rates of blood tested in a quality-assured manner by 2015.
Figure 4: Percent of donated blood tested for HIV contamination in a quality-assured manner: countries with less than 100 percent coverage
18
Figure 5: Number of blood units required per 1,000 population, data from countries attending 2010 UNAIDS-sponsored workshops
Target population: We assume that anybody in the general population may require a blood transfusion throughout the year, with one central blood supply used for both adults and children. We calculate the number of blood units required using the information reported by countries in the 2010 series of workshops sponsored by UNAIDS described above (Stover and Forsythe, 2010). The number of blood units required per 1,000 population reported by the countries is shown in Figure 5; for those countries that did not attend a workshop, we use the median value calculated from the countries below of 3.3 units required per 1,000 population.
Based on the assumption that donated blood will be almost entirely donated by the adult population, we assume that the HIV prevalence rate faced by the uninfected population throughout the time period is the adult HIV prevalence rate; again the implicit assumption here is that unsafe blood transfusions will result in a small number of new HIV infections such that the HIV prevalence rate will not change substantially. We use the total population and relevant HIV prevalence rate (ages 15 and above) from the same Spectrum files described above in the section on unsafe medical injections. Because women are more likely than men to receive blood transfusions [Mishra and Khan, 2008], as transfusions occur due to anemia associated with pregnancy [Zucker et al., 1994], we assume that the averted HIV infections occur on average at the peak childbearing age of 27.
Coverage: For baseline coverage, we use the coverage rates reported for 2009 in the country-specific 2010 UNGASS reports, available publicly on the UNAIDS web site. For those countries that report less than 100 percent coverage of testing donated blood for HIV, we assume that 100 percent of the blood supply will be tested by 2015, scaling-up coverage in a linear fashion.
Unit cost: The unit costs used here are taken from the same resource needs estimates developed by national experts in the series of workshops in 2010 sponsored by UNAIDS (Stover and Forsythe, 2010). In the case where a country did not attend a workshop, the median cost across the available countries is used.
19
Note that the unit cost of this intervention is defined as the marginal cost to test one unit of donated blood for HIV in a quality-assured manner. Since donated blood is tested for a number of different viruses in sub-Saharan Africa, including hepatitis B and hepatitis C, countries are instructed to include only the cost relevant to testing for HIV in the calculations, rather than the full cost of testing one unit of donated blood. Since only the marginal cost of testing blood for HIV is included here, we include only HIV infections averted in calculating the benefits associated with this cost.
Transmission probability: We assume an HIV transmission probability of 90 percent per unit of contaminated blood that is transfused [Donegan et al., 1990].
Ensuring that 100 percent of all blood transfusions in sub-Saharan Africa is safe from HIV contamination by 2015 results in averting slightly more than 131,000 HIV infections. Relatively more infections are averted through this intervention than through safe medical injections because, although initial baseline coverage is greater here, the transmission probability is so much higher via blood transfusions than with medical injections that more HIV infections occur. Using a three percent discount rate results in an ICER of US$3, a figure substantially lower than the PPP-adjusted GNI per capita figure of US$2,051 for sub-Saharan Africa, making this a highly cost-effective intervention. Turning to the benefit-cost analysis, we again present results based on the eight different scenarios described above, as requested by RethinkHIV, varying the scenarios by value of life year gained, cost of ART, and discount rate (see Table 5).
T a b l e 5 : B e n e f i t s a s s o c i a t e d w i t h s a f e b l o o d t r a n s f u s i o n s b y d i s c o u n t r a t e , v a l u e o f l i f e y e a r g a i n e d , a n d A R T c o s t ( M i l l i o n s U S $ ) S c e n a ri o I (3 % , $ 1 ,0 0 0 , $ 5 0 0 ) S c e n a ri o I I (5 % , $ 1 ,0 0 0 , $ 5 0 0 ) S c e n a ri o I II 3 % , $ 5 ,000, $500 ) S c e n a ri o I V (5 % , $ 5 ,0 0 0 , $ 5 0 0 ) S c e n a ri o V (3 % , $ 1 ,0 0 0 , $ 1 ,0 0 0 ) S c e n a ri o V I (5 % , $ 1 ,0 0 0 , $ 1 ,0 0 0 ) S c e n a ri o V II (3 % , $ 5 ,0 0 0 , $ 1 ,0 0 0 ) S c e n a ri o V II I (5 % , $ 5 ,0 0 0 , $ 1 ,0 0 0 )
Years of life gained
(undiscounted) 2.8
Value of years gained $1,11
9 $639 $5,59 5 $3,19 7 $1,11 9 $639 $5,59 5 $3,19 7
OI treatment costs averted $56 $47 $56 $47 $56 $47 $56 $47
ARV treatment costs averted $343 $294 $343 $294 $683 $586 $683 $586
Total $1,51 7 $980 $5,99 3 $3,53 7 $1,85 8 $1,27 2 $6,33 4 $3,82 9
20
Assuming that the average age at an averted HIV infection is 27, the number of life years gained overall is 2.8 million, undiscounted. If the value of each life year gained is assumed to be US$1,000, then the total value of life years gained varies between US$639 million and US$1.1 billion as the discount rate varies between three and five percent (see Scenarios I and II). If instead the value of one life year gained is changed so that it is equal to US$5,000, then the value of life years gained varies from a low of US$3.2 billion with a discount rate of five percent to a high of US$5.6 billion with a discount rate of three percent (see Scenarios III and IV).
The benefits associated with averted treatment costs of OIs due to averting HIV infections ranges from a low of US$47 million using a five percent discount rate to a high of US$56 million using a three percent discount rate (see Scenarios I and II). Since the only parameter that varies for OI treatment costs is the discount rate, this number is repeated across the remaining scenarios.
Finally, we examine the total benefits associated with averted ARV treatment costs. Assuming that the annual cost of ARV treatment is US$500, then the total amount of cost savings from providing a safe blood supply varies between US$294 million and US$343 million for five percent and three percent discount rates, respectively. If we change the assumption regarding the cost of delivering ART so that the annual cost becomes equal to US$1,000, then the treatment savings vary between US$586 million and US$683 million for five percent and three percent discount rates.
Overall, the total benefits that accrue from scaling-up testing of the donated blood supply for HIV to reach 100 percent coverage of all countries in sub-Saharan Africa range from a low of US$980 million, when the value of one life-year gained is US$1,000, the annual cost of ART is assumed to be US$500, and a five percent discount rate is used, to a high of US$6.3 billion, when the value of one life-year gained is US$5,000, the annual cost of ART is assumed to be US$1,000, and a three percent discount rate is used.
These calculated benefits can then be associated with the relevant costs to calculate eight different benefit-cost ratios (see Table 6). The B/C ratio ranges from a low of 146 to a high of 882, making this a highly beneficial intervention at any level.
T a b l e 6 : B e n e f i t - c o s t r a t i o s o f p r o v i d i n g s a f e b l o o d s u p p l y , b y v a l u e o f l i f e y e a r g a i n e d , d i s c o u n t r a t e , a n d c o s t o f A R T ( M i l -l i o n s U S $ ) Discount rate Benefits Costs B/C Ratio (A) B/C Ratio (B) Value of life year $500 ART (A) $1,000 ART (B) $1,000 3% $1,517 $1,858 $7.18 211 259 $1,000 5% $980 $1,272 $6.70 146 190 $5,000 3% $5,993 $6,334 $7.18 834 882 $5,000 5% $3,537 $3,829 $6.70 528 572
21
Preventing Mother-to-Child Transmission
Although the number of new infant infections declined by 26 percent between 2001 and 2009, vertical transmission still accounts for a significant proportion of new HIV infections in the developing world, inspiring a call by UNAIDS for a virtual elimination of new vertical infections [UNAIDS, 2011b]. In the 25 largest countries in sub-Saharan Africa, the number of new infant infections declined by 24 percent between 2001 and 2009, with one-third of that decline occurring in 2009 alone [Mahy et al., 2010], although 350,000 new vertical transmissions occurred in 2008 in the region as a whole, as described above. Programs that prevent mother-to-child transmission (pMTCT) of HIV are among the most cost-effective interventions available in the HIV/AIDS arsenal; two factors that have limited the uptake of pMTCT programs, however, are low levels of antenatal clinic attendance and/or deliveries at a facility, and high levels of stigma associated with an HIV-positive diagnosis, particularly when treatment was not available [Ekouevi et al., 2004].
In 2010, the World Health Organization released new guidelines for treating pregnant women and infants in order to prevent HIV vertical transmission [WHO, 2010a]. For those pregnant women in need of ART for their own health (currently those with CD4 counts under 350 cells/mm3), the guidelines recommend lifelong ART. For those pregnant women who are not in need of ART based on current guidelines, the guidelines for treating pregnant women recommend one of two options:
Option A: The pregnant woman receives zidovudine beginning as early as 14 weeks gestation, followed by a single dose of nevirapine when labor begins and zidovudine/lamivudine during delivery. This is followed by zidovudine/lamivudine for seven days postpartum if zidovudine began at less than four weeks before delivery. Breastfeeding infants receive nevirapine daily until one week beyond the cessation of breastfeeding; non-breastfeeding infants receive either nevirapine or zidovudine for six weeks after birth.
Option B: The pregnant woman receives triple ART beginning as early as 14 weeks gestation through the period of breastfeeding (one week beyond cessation of breastfeeding), while the infant receives nevirapine or zidovudine for four to six weeks after birth.
Since a panel of experts found that transmission rates are reduced by the same percentage for both Options A and B (WHO, 2010b), and Option B is substantially more expensive to provide than Option A, for the most part countries are moving to adopt Option A in their pMTCT programs. We calculate here the costs and benefits of scaling-up Option A in pMTCT programs from current levels to 90 percent coverage of all pregnant women by 2015, using a linear scale-up pattern. We use the publicly available Spectrum/AIM projections and model, described above, to calculate the number of HIV infant infections averted by scaling-up Option A in the 44 sub-Saharan Africa countries, as well as the associated costs. The specific assumptions used for the projections are described in more detail below.
Target population: As described above, Spectrum is a fully-articulated demographic model with sub-modules focusing on different topics, including family planning, child and maternal mortality, and the demographic and social impacts of HIV/AIDS. We use the publicly-available projection files