Multiscale mutation clustering algorithm
identifies pan-cancer mutational clusters
associated with pathway-level changes in
gene expression
William Poole¤, Kalle Leinonen, Ilya Shmulevich, Theo A. Knijnenburg*☯, Brady Bernard*☯
Institute for Systems Biology, Seattle, WA, United States of America
☯These authors contributed equally to this work.
¤ Current address: California Institute of Technology, Pasadena, CA, United States of America *[email protected](TAK);[email protected](BB)
Abstract
Cancer researchers have long recognized that somatic mutations are not uniformly distrib-uted within genes. However, most approaches for identifying cancer mutations focus on either the entire-gene or single amino-acid level. We have bridged these two methodologies with a multiscale mutation clustering algorithm that identifies variable length mutation clus-ters in cancer genes. We ran our algorithm on 539 genes using the combined mutation data in 23 cancer types from The Cancer Genome Atlas (TCGA) and identified 1295 mutation clusters. The resulting mutation clusters cover a wide range of scales and often overlap with many kinds of protein features including structured domains, phosphorylation sites, and known single nucleotide variants. We statistically associated these multiscale clusters with gene expression and drug response data to illuminate the functional and clinical conse-quences of mutations in our clusters. Interestingly, we find multiple clusters within individual genes that have differential functional associations: these include PTEN, FUBP1, and
CDH1. This methodology has potential implications in identifying protein regions for drug
tar-gets, understanding the biological underpinnings of cancer, and personalizing cancer treat-ments. Toward this end, we have made the mutation clusters and the clustering algorithm available to the public. Clusters and pathway associations can be interactively browsed at
m2c.systemsbiology.net. The multiscale mutation clustering algorithm is available athttps://
github.com/IlyaLab/M2C.
Author summary
Identifying driver mutations in cancer has been a major challenge in cancer research, with the ultimate goal of understanding the detailed molecular origins of cancer and providing genetically personalized treatments. For decades, the cancer research community has known that mutations in certain genes—such as tumor suppressors like P53—can drive a1111111111 a1111111111 a1111111111 a1111111111 a1111111111 OPEN ACCESS
Citation: Poole W, Leinonen K, Shmulevich I,
Knijnenburg TA, Bernard B (2017) Multiscale mutation clustering algorithm identifies pan-cancer mutational clusters associated with pathway-level changes in gene expression. PLoS Comput Biol 13 (2): e1005347. doi:10.1371/journal.pcbi.1005347
Editor: Maricel G. Kann, University of Maryland
Baltimore County, UNITED STATES
Received: April 10, 2016 Accepted: January 4, 2017 Published: February 7, 2017
Copyright:©2017 Poole et al. This is an open access article distributed under the terms of the
Creative Commons Attribution License, which permits unrestricted use, distribution, and reproduction in any medium, provided the original author and source are credited.
Data Availability Statement: All Metadata and
analyses are included as supplemental information. TCGA-related data can be downloaded from:http:// ezid.cdlib.org/id/doi:10.7908/C1K64H78orhttp:// gdac.broadinstitute.org/runs/analyses__2014_10_ 17/data/. Drug response data are available from GDSC:http://www.cancerrxgene.org/downloads.
Funding: This work was supported by grant
U24CA143835 from the National Cancer Institute,
http://www.cancer.gov/, and grant P50GM076547 from The Center For Systems Biology,http://www.
cancer. In some cases it is also clear that mutations within cancer genes are localized in a single amino—such as the V600E mutation in BRAF. With the existence of large multi-omic data sets including The Cancer Genome Atlas (TCGA), it is now possible to apply big data approaches towards both identifying mutation features of interest and under-standing their functional consequences. We have bridged the gap between single amino acid mutations and the whole gene view by developing an algorithm that can identify vari-able length regions within cancer genes that which enriched for mutations. Furthermore, we have been able to integrate our multiscale mutation clusters with additional molecular data to gain insight into possible functional consequences of the clusters.
This is aPLOS Computational BiologyMethods paper
Introduction
Somatic mutations are amongst the most frequent genomic aberrations associated with cancer. Moreover, primary human cancer samples usually contain tens to hundreds of somatic muta-tions, depending on the tissue of origin [1]. The identification of mutations that alter the func-tion of protein coding genes, and a molecular understanding of the ensuing consequences of such mutations, remains a significant challenge.
To date, millions of distinct somatic mutations have been observed in human cancers through genome wide characterization projects such as The Cancer Genome Atlas (TCGA) and International Cancer Genome Consortium (ICGC). Computational methods are particu-larly well suited for the assessment of somatic mutations at this scale in order to identify those with cancer-associated functional consequences. To this end, numerous mutation assessment methods have been developed based on a variety of underlying approaches and statistical mod-els. For example, MuSiC [2], MutSig [1], and SomInaClust [3] rank cancer-associated genes based on somatic mutations observed across a cohort of samples and normalized by factors including mutation type propensity, gene length, and replication timing. In addition, methods including PolyPhen [4], SIFT [5], and CADD [6] utilize prior knowledge such as conservation and machine learning based on disease associated variants to predict functional mutation impact. Yet other methods including OncodriveCLUST [7] and CLUMPS [8], iPAC [9], and graphPAC [10] take a parameterized, data-driven approach to predict cancer-associated muta-tions based on spatial clustering of linear sequence, three-dimensional protein structure, and graphical representations thereof. Finally, enrichment of somatic mutations based on func-tional biological consequences such as protein-protein interaction interfaces [11] and deregu-lation of phosphoryderegu-lation signaling [12] have been explored.
Importantly, functional mutations that occur within the coding sequence and are known to be associated with cancer do not occur at random positions. On the contrary, hotspots or clus-ters are frequently observed as recurrent missense mutations across a significant fraction of cancer samples. These sets of mutations are typically attributed to alterations in function at specific sites of the protein that give rise to a variety of cancer phenotypes. Oftentimes, these mutation clusters can be readily interpreted in the context of their protein structure and func-tion; for example, mutations in the GTP binding pocket ofKRASthat modulates intrinsic GTPase activity, lead to constitutive activation ofKRASand persistent stimulation of down-stream signaling pathways [13,14]. Such mutation clusters need not be located within
centerforsystemsbiology.org/. The funders had no role in study design, data collection and analysis, decision to publish, or preparation of the manuscript.
Competing interests: The authors have declared
structural protein domains; for example, N-terminal mutations of beta-catenin (CTNNB1) affect protein phosphorylation sites and thereby abrogate ubiquitin-mediated proteasomal degradation [15–17]. These mutations then result in beta-catenin accumulating in the nucleus and continuously driving transcription of its target genes [18,19].
While these examples highlight readily identifiable and interpretable focal mutation clusters that lead to cancer-associated effects on protein function, such mutation consequences need not be restricted to dense clusters at just a few amino acid positions in the protein sequence. For example, tumor protein p53 (TP53) contains a combination of mutations that are recur-rently located at specific amino acids that bind directly to DNA (e.g., R248Q, R273C) as well as more broadly distributed sets of mutations throughout the core DNA binding domain of TP53 that disrupt the folding and stability of the protein [20,21]. Additionally, sets of mutations do not only affect individual regions or domains of proteins; rather, functional mutations are observed in distinct clusters within different regions or domains of individual proteins (e.g.,
PIK3CA), indicating the possibility for differential functional consequences of such mutation clusters [22,23].
We have therefore developed a multiscale mutation clustering algorithm (M2C) that identi-fies variable length regions with high mutation density in cancer genes. We have applied our algorithm on hundreds of frequently mutated genes using the combined mutation data in over twenty tumor types from TCGA and identified over a thousand multiscale mutation clusters. We have statistically associated these multiscale clusters with gene expression from TCGA tumor samples and drug response data from cancer cell lines, illuminating the (differential) functional and associated therapeutic consequences of somatic mutations in cancer.
Results and discussion
Overview of the approach
We ran M2C on the combined mutation calls from 23 cancers (pan-cancer data set is described in T1 inS1 Tables) across 549 genes. Briefly, M2C works by smoothing the mutation density at many different amino acid length scales. Then, a mixture model is fit to each scale. Finally, these mixture models are merged together using a greedy algorithm that optimizes an informa-tion criterion. We refer to a cluster as an interval along the linear amino acid chain, e.g.PIK3CA
339–350. After identifying these clusters, we assigned them as binary features to individual tumor types for each of the 23 cancers. A cluster is assigned as positive (1) to a tumor sample if that sample contains at least one non-synonymous mutation within the cluster and negative (0) otherwise. This assignment allowed us to relate cluster features with gene expression data from 2194 genes in the TCGA dataset. We statistically combined these gene expression associations on the pathway level across 172 pathways linking mutation clusters to pathway-level gene expres-sion changes. We performed a similar analysis on all non-synonymous mutation features (i.e. regardless of whether the mutation is or is not in a cluster). Finally, we linked the multiscale mutation clusters to differential drug response using cancer cell line data.Fig 1illustrates our approach onPIK3CAin breast invasive carcinoma, a prototypical example of how our method identifies multiple mutation clusters with differential associations with gene expression data. Additional details can be found in the Methods section and Supplemental Information.
Characterizing multiscale clusters
M2C identified a total of 1255 multiscale clusters in 393 of the 549 genes analyzed. These genes were selected by taking the highest ranked genes in MutSig for each cancer type. The 156 genes without any clusters had all their mutations classified as uniform background noise by M2C and were omitted from further analysis. The following results indicate that our method
Fig 1. Method Illustration on PIK3CA in Breast Cancer: From top to bottom. A) Protein domains in PIK3CA. B) In gray: mutation histogram showing all
mutations across the various cancer types; these data were used to generate the multiscale clusters. In blue: breast cancer mutation histogram showing all non-synonymous mutations; these data were used to assign mutation features to breast cancer tumor samples. C) Mutation clusters identified by the multiscale information-based clustering algorithm (M2C). Gray clusters have fewer than 5 mutations in breast cancer and are excluded from subsequent downstream analysis. Green clusters are assigned to breast cancer. D) LRP8 gene expression levels in breast cancer where the samples are grouped based on the mutation clusters. From left to right: “wild-type” (i.e., no synonymous mutations including tumors with no mutations at all), any non-synonymous mutation feature, and the seven mutation clusters assigned to breast cancer. E) Pathway association P-value heatmap showing differential pathway associations between clusters. L1S1 In Neuronal Migration and Development Pathway and Reelin Signaling Pathway do include LRP8. doi:10.1371/journal.pcbi.1005347.g001
finds multiscale regions of proteins which are enriched for mutations and frequently overlap with annotated protein domains. The multiscale clusters span a wide range of lengths: from 1 to 600 amino acids. Additionally, clusters have a highly variable number of mutations: 15 to 338 mutations. Finally, we note that each cluster is given a score which is the log of the ratio of its emission probability from its component of the mixture model to the emission probability under the null hypothesis that mutations are distributed uniformly across the gene. Higher scores indicate increased robustness as shown by cross-validation analysis (seeMethodsand
S4 Fig). T2 inS1 Tablesdetails pan-cancer cluster definitions, cluster scores, and overlapping
protein domains.
We assigned clusters to specific tumor samples if there was at least one non-synonymous mutation in a sample at an amino acid position within a cluster. By combining tumor samples grouped by tumor tissue of origin, we were able to compare how clusters are assigned to differ-ent tumor types. T3 inS1 Tablesdetails cluster assignments to tumor types. When clusters are assigned to specific tumor types, a high variability is seen in the way clusters are distributed between tumor types. On the high end, lung squamous cell carcinoma and uterine carcinosar-coma have over 80% of their non-synonymous mutations in clusters. On the low end, acute myeloid leukemia and thyroid carcinoma have 23% and 34% of their non-synonymous muta-tions in clusters, respectively. Neither the total number of non-synonymous mutamuta-tions nor the total number of synonymous mutations is a good indicator for what percent of mutations are located within clusters in a specific tumor type. Interestingly, the ratio between the percentage of non-synonymous mutations in clusters and the percentage of protein sequence covered by clusters (which contain non-synonymous mutations) is much less variable; for the pan-cancer data set this ratio is 1.88 and when calculated between cancer types ranges from 0.88 (acute myeloid leukemia) to 2.23 (thyroid carcinoma). T4 inS1 Tablesgives statistics on the distribu-tion of clusters between different tumor types. Finally, we searched for tumor specific clusters by using Fisher’s exact test to determine if specific tumor types are enriched for specific clus-ters. We found 426 mutational clusters enriched for a specific tumor type at a false discovery rate of 1% and 996 at a false discovery rate of 10%. Cluster tumor type enrichment results are detailed in T5 inS1 Tables.
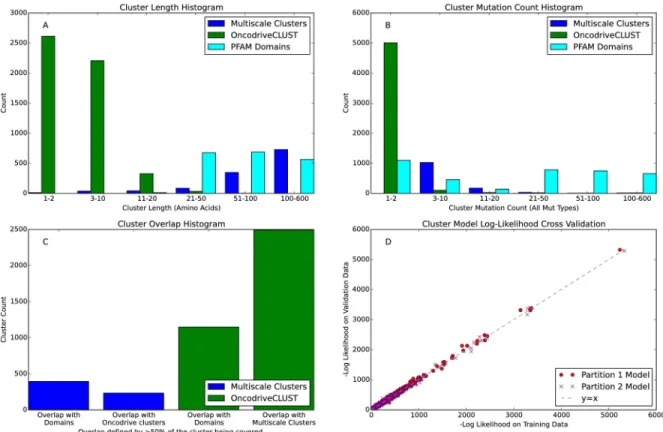
We compared the multiscale clusters to a Density Based Spatial Clustering of Applications with Noise (DBSCAN) based method called OncodriveCLUST and to protein domains from Pfam [24]. OncodriveCLUST’s approach also uses a kernel smoother to create a mutation den-sity, albeit using only one predefined scale. Despite finding fewer clusters (OncodriveCLUST found 5185 clusters in 514 genes), we find that multiscale clusters tend to be larger and have more mutations. Additionally, multiscale mutation clusters cover (defined as>50% overlap) 48% of the alternative method’s clusters. On the other hand, OncodriveCLUST clusters cover only 18% of the multiscale clusters. Finally, we note that M2C has 9% more coverage by protein domains from Pfam compared to OncodriveCLUST (M2C has a total of 31% of multiscale clusters located within or overlapping with protein domains). These statistics are summarized in panels A-C ofFig 2.
We validated the M2C robustness by splitting our data set into two equally sized partitions and running the algorithm separately on each partition. We then compared how clusters from the different partitions overlap. We also make use the generative capabilities of the mixture models underlying our algorithm to use each partition’s model to predict the data from the other partition. In brief, we found that M2C robustness is dependent on mutation density; clusters with many mutations, regardless of size, tend to be validated across the two different partitions. Less populated small dense clusters are also well conserved. However, larger sparse clusters are more poorly replicated between partitions. Despite these differences, the mixture
models generated by each partition do a very good job predicting the data set in the other par-tition (Fig 2D). For more details on our cross-validation tests, see theMethodssection.
Associating clusters with gene expression data
In order to begin to gain an understanding of the functional consequences of mutations in differ-ent clusters, we statistically associated gene expression data from TCGA by combining statistics from all gene expression data (i.e., global associations) and from subsets of gene expression data representing molecular pathways (i.e., pathway associations). The statistical associations were car-ried out on binary vectors that indicate whether a sample in a specific tumor type had a mutation in a specific cluster (1) or not (0). We refer to these binary vectors as cluster features. This associa-tion pipeline works by combining P-values from Kruskal-Wallis tests between gene expression data and cluster features with the Empirical Brown’s Method [25]. This methodology was chosen because, in general, gene expression from a particular pathway is not universally upregulated or downregulated due to cancer mutations. A summary of the results from these associations at dif-ferent false discovery rates (FDR) can be seen inFig 3. Further information on the association analysis can be found in the methods section.
In order to assess the robustness of our association methodology, we performed a cross-val-idation analysis. We measured two different robustness scores. “Association robustness” com-pares the associations between two data partitions using the same underlying set of clusters.
Fig 2. Cluster Statistics Comparing Multiscale Clusters from M2C with the DBSCAN based method OncodriveCLUST
and Pfam domains. A) Cluster length histogram. B) Cluster mutation count histogram using all mutation types. C) Coverage with
competing method histogram and Pfam. Cluster X is said to overlap cluster Y if over 50% of cluster X is covered by cluster Y. D) Cross-validation of mixture models: each circle shows the log-likelihood of the mixture model trained from partition 1 to generate the data from partition 2 for a single gene (red circles). The opposite analysis, using partition 2’s mixture model to generate data from partition 1, is also shown (purple x’s).
“M2C plus association robustness” compares two data partitions each used to generate their own set of clusters which are subsequently analyzed for gene expression associations sepa-rately. Our analysis finds association robustness at 80% and M2C plus association robustness at 60%. This decrease is consistent with the observation that M2C robustness (described previ-ously) is lower for lower scoring clusters, causing a decrease between partitions. However, higher scoring clusters tend to have stronger associations, making M2C plus association robustness higher than might be naively expected simply by combining M2C association robustness and association robustness. Further information on the cross-validation can be found in the Methods section.
We found that computing associations with gene expression comprises a complementary approach towards ranking cancer genes when compared with other methods such as MutSig [1]. We compiled a list of the top 67 genes from the MutSig rankings from across all cancer types that represent many of the most important cancer genes (see section B inS1 Text). At a FDR of 10%, 36% (a total of 24 genes) of the top genes contained at least one mutation cluster that is associated with global or pathway changes in gene expression in a specific tumor type.
Our results from the gene expression analysis highlight that clusters of many different length scales are associated with changes in gene expression, seeS1 Fig. This corroborates the fact that functional regions of genes can range in size from single amino acids to multiple pro-tein domains. As discussed later, these associations are often more specific than associations with any-non-synonymous mutation in the same gene. These results indicate the importance
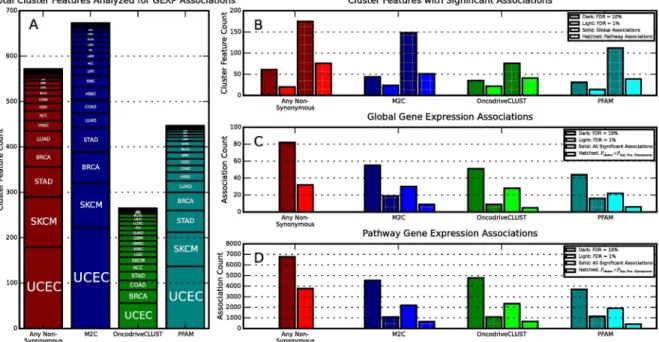
Fig 3. Gene Expression Association Statistics. A) The number of cluster features (meaning clusters in the context of a tumor
type) analyzed for gene expression association broken down by tumor type and by clustering method. A single cluster can be analyzed multiple times if it is present with greater than 4 mutations in multiple tumor types. B) The number of cluster features with significant global gene expression associations (solid) and pathway gene expression associations (hatched). Two significance levels (1% is lighter colors and 10% darker colors) are shown for each method. Here a cluster feature with multiple associations is only counted once. C) The number of significant global gene expression associations found by each method at different significance levels (1% is lighter colors and 10% darker colors). Hatched bars indicate associations with lower P-values than the corresponding any non-synonymous feature for the same gene. Here cluster features with multiple associations are counted multiple times. D) Same as (C) but for pathway gene expression associations.
of being able to dynamically determine multiscale regions of interest within genes in order to better understand the spectrum of mutations underlying cancer.
Furthermore, we have found a number of cases where the association P-value between a cluster feature and gene expression data (pathway or global) is lower than the association P-value between the feature (variable) that encodes the occurrence of any non-synonymous mutation. These cases are of special interest because cluster features (i.e. variables that encode the presence or absence of a mutation in a particular cluster) are by definition subsets of the feature that encodes all non-synonymous mutations. This means that cluster features have fewer samples and thus less statistical power to detect associations with expression data. One would statistically expect them to have correspondingly higher P-values. However, in many instances we find that the opposite is the case. These decreased P-values provide additional evi-dence that mutation clusters can have specific functional consequences and provide a more nuanced view than considering an entire gene. A number of specific examples are highlighted below and a full list of these cases can be found in T6A and T7A inS1 Tables. The pathway association in T7A inS1 Tablesalso lists individual genes within a pathway with significantly differential expression between samples with a cluster feature and without. We have also com-puted pathway and global associations for samples which contain mutations not in any of our clusters. At a false discovery rate of 10%, about 90% of clusters are more strongly associated with a given pathway or global gene expression feature than mutations lying outside of all clus-ters. In some cases, this is an indication that our clusters are strongly associated with changes in gene expression. In other cases, the change in P-value can be attributed to the smaller sam-ple size of mutations lying outside of all clusters. Therefore the comparison to the any non-synonymous feature, which will always have a larger sample size than the corresponding clus-ter feature, is more inclus-terpretable. A table of associations corresponding to the significant asso-ciations in T6A and T7A inS1 Tablesfor samples which do not contain mutations in any cluster can be found in T6D and T7D inS1 Tables. Note that associations were not computed if fewer than 5 samples in a given gene and tumor type had non-synonymous mutations out-side of all clusters.
Finally, we uncovered a few instances where different cluster features in the same gene are associated at substantially different levels with gene expression data at the pathway or global level. These may be instances of multifunctional genes where mutations in different regions of the same gene have different functional consequences. In the following sections, we highlight specific examples found in our analysis. We note that the following discussion is not exhaus-tive and many more examples can be found by examining T6AS1 Tables(features associated with global changes in gene expression) and T7A inS1 Tables(features associated with path-way changes in gene expression).
As a further comparison to our method, we also analyzed global and pathway gene expres-sion associations for OncodriveCLUST clusters and PFAM domains. Significant results for OncodriveCLUST can be found in T6B inS1 Tables(global) and T7B inS1 Tables(pathway). Significant results for PFAM domains can be found in and T6C inS1 Tables(global) and T7C
inS1 Tables(pathway).Fig 3compares the number of cluster features with significant gene
expression associations and the total number of associations found by each method. At a false discovery rate of 1%, M2C finds a slightly higher percent of clusters with lower P-values than the corresponding any non-synonymous association when compared to OncodriveCLUST and PFAM domains, at 29%, 28%, and 22%, respectively. As the false discovery rate is increased, M2C continues to find a higher proportion of more strongly association clusters than OncodriveCLUST, despite typically finding fewer significant associations in total. Inter-estingly, at higher false discovery rates PFAM domains are the most likely to have a lower asso-ciation P-values than the corresponding any non-synonymous assoasso-ciation. The strong
associations from PFAM domains are likely due to the overall large length and amino acid counts inside these domains which has the drawback that they contain much less positional information compared to the clustering methods. T8 inS1 Tablescontains a more detailed set of statistics similar to those shown inFig 3.
Clusters associated with global changes in gene expression
We identified highly cancer-related clusters in specific tumor types that are significantly asso-ciated with global changes in gene expression. In the cases ofPIK3CAandGATA3, different clusters have widely different association levels with global changes in gene expression. This may be a statistical indicator of different mutation clusters within a single gene affecting the cellular environment in different ways. A full list of global gene expression associations can be found in T6A inS1 Tables. Here, we highlight several well-known and novel clusters in the cancer literature recovered by M2C:
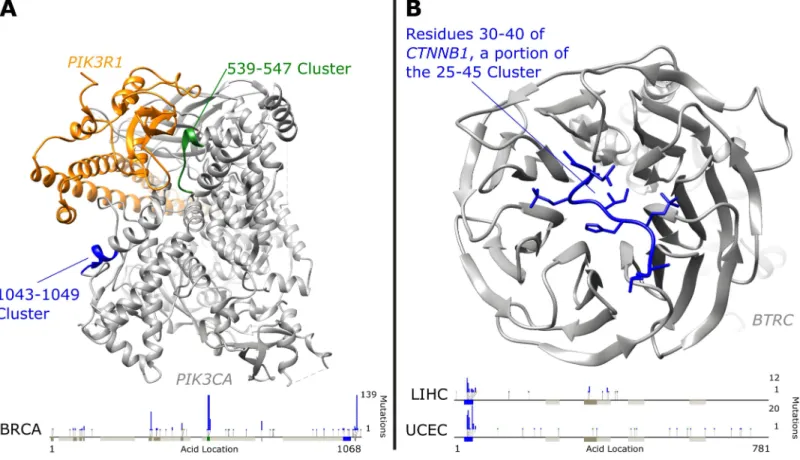
Two ofPIK3CA’s eleven mutation clusters are associated with global changes of gene expression in breast invasive carcinoma: amino acid positions 539–547 and 1043–1049. We note that the first clusters are significantly enriched for mutations in the following tumor types: breast invasive carcinoma, head and neck squamous cell carcinoma, uterine corpus endometrial carcinoma, cervical squamous cell carcinoma and endocervical adenocarcinoma (FDR<1%). The second cluster is significantly enriched for mutations in breast invasive car-cinoma and uterine corpus endometrial carcar-cinoma (FDR<1%). The 539–547 cluster contains three previously studied residues in anα-helical region which have been shown to increase the enzyme’s activity [22]. A hotspot point mutation at 1047 inside the 1043–1049 mutation clus-ter has been speculated to affect the position and mobility of the activation loop [27]. Interest-ingly, despite approximately 20% fewer mutations, the 539–547 cluster has a much lower global gene expression association P-value (about 6 orders of magnitude smaller), signifying that perhaps mutations in this cluster have different functional consequences. As seen inFig 4Athe 539–547 region of PIK3CA may be directly involved in binding to PIK3R1, providing another interpretation for the large association with changes in gene expression [28]. As one of the best studied cancer genes, it is unsurprising that many additional associations and cluster-tumor enrichments exist for PIK3CA which are detailed in ourS1 Tables.
ROBO3has a cluster from 195–509 which overlaps with 4 lg-like C2 domains [29]. This cluster is associated with global changes in gene expression in uterine corpus endometrial car-cinoma. The cluster is also enriched for mutations in lung adenocarcinoma (FDR<5%), as well as in uterine corpus endometrial carcinoma (FDR<1%). Previously, increased levels of
ROBO3expression have been associated with metastasis in pancreatic cancer [30]. However, to our knowledge somatic mutations in this region have not been extensively studied. Further-more, we note thatROBO3is ranked only 15540 in MutSig for uterine cancer [1]. Thus this gene might be a candidate for further study of its role in uterine corpus endometrial carcinoma and possibly the other tumor types mentioned above.
GATA3has a subset of three clusters in breast invasive carcinoma all containing predomi-nantly nonsense (i.e. frameshift, indel, or stop) mutations: amino acids 325–334 with 15 muta-tions, amino acids 390–421 with 22 mutations and amino acids 429–443 with 15 mutations. We note that the most densely populated of these clusters occurs after the zinc finger binding domain while the first cluster occurs within the binding domain [29]. Interestingly, the 390– 421 cluster is substantially more associated with global changes in gene expression than either of the other two clusters with a P-value nearly 2 orders of magnitude lower. DifferentGATA3
changes in survival prognoses [32]. We note that all three of these clusters are enriched for mutations in breast invasive carcinoma (FDR<1%).
Clusters associated with pathway level changes in gene expression
We identified significant pathway associations with clusters in specific tumor types. These pathway associations go beyond simply implicating certain mutation clusters in cancer by shedding light on possible phenotypic effects of each cluster. At a false discovery rate of 10%, all of the genes associated with global changes in gene expression were also associated with at least one pathway (and usually with many pathways).This included 24 of 67 top ranked cancer genes from MutSig. These results are not surprising because each set of genes in a pathway is a subset of the global gene expression data. However, we note that by restricting our analysis to individual pathways, novel clusters associated with gene expression changes were detected indicating that this analysis is more nuanced. For a complete list of cluster pathway associa-tions see T7A inS1 Tables. This table also included specific gene expression features in each pathway which are strongly associated with a mutation cluster. Below we discuss several exam-ples of specific clusters which are associated with pathways but are not associated with global changes of gene expression.
Fig 4. Clusters Highlighted in Protein Structures. A) PIK3CA (gray) bound to PIK3R1 (orange). PIK3CA has two clusters (539–547 in green and 1043–
1049 in blue) with very different global gene expression association significance levels in Breast Cancer (BRCA) discussed in the text. B) Residues 30–40 of CTNNB1 (blue) bound to BTRC (gray). This region of Beta-catenin is inside the 25–45 cluster which contains degradation regulating phosphorylated amino acids and is strongly associated with global gene expression changes in uterine corpus endometrial carcinoma (UCEC) and liver hepatocellular carcinoma (LIHC). Bottom bars in both plots show linear protein sequences with additional clusters in dark gray and PFAM protein domains in light gray. Mutation count histograms are shown for specific tumor types above the sequence with green dots representing synonymous mutations, blue dots representing missense mutations, and yellow dots nonsense mutations. Protein images created using UCSF Chimera [26].
ZBTB20has a cluster from 681–714. This cluster is associated with 9 pathways related to angiogenesis and regulation of the cell cycle in gastric adenocarcinoma. Previously single nucle-otide mutations inZBTB20have been associated with gastric cancer [33]. We hypothesize that a larger region of theZBTB20gene as represented by this mutation cluster may be involved in gastric oncogenesis. Specifically, the frameshift deletions between the two zinc finger domains likely disrupt DNA binding and the C-terminal function of the protein. We note that this cluster is enriched in gastric cancer along with two other clusters inZBTB20, 190–248 and 345–504 (FDR<1%). The 190–248 cluster is also enriched for mutations in low grade glioma (FDR<
10%).
PPP2R1Ahas a cluster from 167–183 that overlaps a HEAT domain motif [34]. This cluster is associated with pathways related to cell differentiation andMAPKsignaling in uterine corpus endometrial carcinoma. This gene has also been implicated previously in uterine and ovarian cancer [35]. This cluster is enriched for mutations in uterine corpus endometrial carcinoma and uterine carcinosarcoma (FDR<1%). Additionally, the 237–275 inPPP2R1Ais enriched for mutations in lung squamous cell carcinoma and gastric cancer (FDR<10%). The 391–490 clus-ter is enriched for mutations in uclus-terine corpus endometrial carcinoma (FDR<1%).
CHD4is a chromatin helicase remodeling protein. It has a cluster from 945–1016. This clus-ter is associated with two pathways in uclus-terine corpus endometrial carcinoma. One of these pathways is signaling events mediated by HDCA Class II, which is thought to form a complex which includesCHD4[36]. The above selection of examples is by no means exhaustive. Addi-tional examples can be found and investigated in more depth by examining T7A inS1 Tables.
Clusters can produce stronger pathway and global gene expression
associations
We identified statistically significant clusters in specific tumor types with a lower combined P-value across all gene expression features than the corresponding any non-synonymous mutation feature in a specific tumor type. These results are annotated in T6A inS1 Tables. As examples, this analysis picks up two well-known mutation sites. Our algorithm detected a clus-ter inBRAFfrom amino acids 600 to 601 which is more significantly associated with global changes in gene expression (P<10−13with 106 non-synonymous mutations) in skin cutaneous melanoma despite having fewer mutations than the any non-synonymous feature (P<10−10 with 126 total non-synonymous mutations across the entire gene). Similarly, in thyroid carci-noma the 600–601 mutation cluster has 235 non-synonymous mutations and is more signifi-cantly associated to global changes in gene expression (P<10−82) than any-non-synonymous mutation which has 237 total non-synonymous mutations (P<10−80). These are common mutations previously implicated in cancer [37].
Additionally, the 25–45 amino acid region ofBeta-catenin(CTNNB1)is found to be more significantly associated with global changes in gene expression (P<10−24with 67 non-synony-mous mutations in the cluster) than all non-synonynon-synony-mous mutations in the gene (P<10−21with 80 total non-synonymous mutations in the gene) in uterine corpus endometrial carcinoma. A similar result is seen in liver hepatocellular carcinoma where the cluster is more significantly associated with global change in gene expression (P<10−14with 37 non-synonymous muta-tions in the cluster) than all non-synonymous mutamuta-tions in the gene (P<10−12with 53 non-synonymous mutations). This cluster is also enriched for mutations Adrenocortical carcinoma (FDR<5%), uterine corpus endometrial carcinoma (FDR<1%) and in liver hepatocellular car-cinoma (FDR<1%).Beta-cateninis known to be implicated in numerous types of cancer [38]. This region corresponds closely to a region of phosphorylated peptides along theCTNNB1chain which are known to regulate the degradation ofCTNNB1[39,40].Fig 4Bshows the structure of
the N-terminus region ofBeta-cateninlocated within the 25–45 amino acid cluster bound to the WD40 domain ofβ-TrCP1 (BTRC)[41]. Mutations in this cluster are likely to affect this binding and thereby the regulation ofBeta-catenin. The fact that this region is not an annotated protein domain illustrates the flexible nature of M2C in picking out different kinds of functional regions of interest.
We also identified cluster pathway associations in specific tumor types with lower pathway-cluster P-values than the corresponding any non-synonymous mutation feature in the same tumor type. These results are annotated in T7A inS1 Tables. One example is the 248–254 clus-ter inFGFR3in bladder urothelial carcinoma. Point mutations in this region have been previ-ously implicated in low grade glioma tumors [42]. We note that mutations in this region are more significantly associated with 10 pathways than the any non-synonymous feature. These pathways are involved in a large number of molecular processes ranging from cell cycle control toReelinsignaling. This suggests diversity in the role ofFGFR3as an oncogene in bladder can-cer. This cluster is also enriched for mutations in both bladder cancer (FDR<1%) and lung squamous cell carcinoma (FDR<10%). Another example is the 88–98 cluster inPGM5in gas-tric adenocarcinoma which is more significantly associated with 12 pathways when compared to any non-synonymous mutation in the same gene. We note that this cluster is enriched for mutations in gastric cancer (FDR<1%) and the 456–522 cluster is enriched in lung adenocar-cinoma (FDR<5%). AlthoughPGM5has been ranked as a possible cancer gene according to MutSig, to the best of our knowledge this particular region has not been studied.
These cases demonstrate how decreasing sample size by considering a specific cluster as opposed to a specific gene can provide a more nuanced lens for finding statistical associations and aid in inferring the functional consequences of mutations. This occurs because clusters can represent functional regions of a gene and thereby limit the analysis to mutations within that region. This spatial specificity has the effect of excluding background mutations outside the cluster from the analysis.
Pathway associations reveal differential functions of mutation clusters in
the same gene
PTENhas two clusters that are associated with global changes in gene expression in uterine corpus endometrial carcinoma. The first of these clusters from 39–52 has 9 mutations, 8 of which are nonsense mutations. The second cluster from 116–146 has 74 mutations which has 66 missense and 16 nonsense mutations. This cluster encompasses the P-loop of the protein [43]. Additionally the first cluster is associated with 16 pathways including 5 not associated with the second cluster. Similarly, the second cluster is associated with 51 pathways including 40 not associated with the first cluster. The differential associations between cluster features found inPTENare visualized inFig 5.
FUBP1has two clusters each with predominantly nonsense mutations with differential pathway association in lower grade glioma. The 88–206 cluster overlaps well with a KH-1 domain which is involved in RNA and DNA binding [44]. The second cluster does not overlap with any known domains [29]. One possible explanation is that nonsense mutations earlier in the protein sequence result in total loss of function while nonsense mutations later in the sequence only effect the end of the protein structure. This could result in differential effects from mutations in these two clusters. SeeS2 Figfor an association heatmap.
E-Cadherinhas 3 clusters with differential pathway associations in breast invasive carci-noma. All these clusters have predominantly nonsense mutations. Of particular interest are the second two clusters. The cluster from 144–222 occurs at the beginning of the first cadherin
domain in the protein and the cluster from 644–733 occurs towards the end of the last (fifth) cadherin domain in the protein [45]. It is possible that the 144–222 cluster interferes with the ability of the protein to insert itself into the cellular membrane. On the other hand, the 644– 733 cluster may not interfere with membrane insertion and only affect the cytoplasmic part of the domain. SeeS3 Figfor an association heatmap.
Mutation clusters help to explain differential drug response in cancer cell
lines
After having established that the location of a mutation in a gene, i.e. in a cluster identified by M2C, is associated with differences in gene expression, we aimed to establish whether mutation clusters could be therapeutically relevant. To this end, we applied the mutation clusters to a large cancer cell line drug screening effort; the Genomics of Drug Sensitivity in Cancer
Fig 5. Differential Pathway Associations for PTEN clusters in Uterine Corpus Endometrial Carcinoma. Clusters without significant
pathway associations are omitted for clarity. A false discovery rate of 1% was used to filter for significance. doi:10.1371/journal.pcbi.1005347.g005
(GDSC) [46,47]. We chose to use drug response measurements in cancer cell lines as an indi-cation of the functional importance of the mutation clusters.
Data obtained from GDSC included the drug response to 142 anti-cancer drugs across 714 cell lines as well as non-synonymous mutation calls for 77 known cancer genes across these cell lines. First, we established that the clusters identified using M2C on the TCGA data were enriched for mutations found in the cell lines. Specifically, for the 17 genes with at least 10 mutations across the cell lines, 14 showed strong enrichment of mutations in the M2C clusters (p-value0.05, FDR5%, T12 inS1 Tables). For 12 of these genes, there were at least 5 cell lines that had a mutation in one of the mutation clusters that we identified using M2C. We per-formed association tests between the drug response for each of the drugs, as expressed in IC50 values, and the mutation clusters with at least 5 mutations as well as the any non-synonymous mutation feature for these 12 genes. SeeMethodssection for details.
Using an FDR of 10% we found 176 significant associations between the drug response of a drug and either a mutation cluster (64) or the any non-synonymous mutation feature (112) of a gene. Significant associations were found for all 12 genes across 77 of the 142 drugs. There were 130 gene-drug combinations, where either or both a mutation cluster and the any non-synonymous mutation feature of the gene were associated with the response to a drug. Inter-estingly, of these 130 cases, there were 35 (27%) gene-drug combinations where a mutation cluster in the gene showed a stronger association with drug response than the any non-synony-mous mutation feature (T13 inS1 Tables).
Amongst these 35 cases, we found many known activating hotspot mutations of genes in theMAPKpathway. Specifically, there are 10 drug associations with theBRAFmutation cluster 600–601, 6 withNRASmutation cluster at amino acid 61 and 4 withKRASmutation cluster 12–13. These well-known examples can be interpreted as a positive control of the importance of considering mutation clusters compared to the mutations across the whole gene. Addition-ally, there are 5 drug associations with the various mutation clusters that we found for tumor suppressorTP53. This is consistent withTP53being the most prominent tumor suppressor gene. InFig 6we highlight two examples where drug response is more strongly predicted by a mutation cluster than by any non-synonymous mutation in the same gene. First, we observed that cell lines with mutations in the cluster 116–146 inPTENstrongly responded to mTOR inhibitor Temsirolimus, whereas mutations across the entire gene showed only a small indica-tion of drug sensitivity (Fig 6A). Second, we observed that cell lines with mutations in the clus-ter 1043–1049 inPIK3CAshowed a stronger response to aPI3Kbeta inhibitor than other mutation clusters or the any non-synonymous mutation feature (Fig 6B). This corresponds with our observation that in breast cancer this same mutation cluster is very strongly associ-ated with global changes in gene expression compared to other clusters inPIK3CA.
These results provide additional support for the idea that it is important to consider muta-tions in aspecificregion of a cancer gene, and not merely a single amino acid alteration or a mutation anywhere in the entire gene.
Conclusion
We have identified multiscale mutation clusters in genes using a pan-cancer data set. Previous approaches have focused on short (frequently single) amino-acid hotspots [7] as well as identi-fying globally mutation enriched cancer genes [1]. Our method (M2C) dynamically combines these two approaches by searching for variable-length regions of interest within individual genes. We have shown that M2C clusters are indeed multiscale covering a wide range of length scales and can be detected in genes with variable mutation density. These clusters frequently overlap with protein domains, but also cover regions where no known domain exists. We
show that many of the clusters found by M2C are representative of functional regions of pro-teins where mutations have a larger effect in terms of influencing the hallmarks of cancer [48]. M2C represents a data driven approach towards systematically identifying regions of interest inside of genes with many areas for further investigation and improvement. Firstly, any statis-tical algorithm will only improve in accuracy as newer and larger data sets are generated. As more cancer tumors are sequenced, we expect our method to detect more mutation clusters, in particular novel clusters in under-studied cancer genes. Secondly, our mutation clustering methodology is sequence based; we suspect that a three dimensional version of such a multi-scale algorithm–which implicitly takes protein structure into account–would result in an improvement in identifying functional mutation clusters. Approaches to detect mutation hot-spots in 3D structures already exist [49] but they are not based on a multiscale framework. It is likely that many of our one-dimensional clusters, if mapped onto the 3D structure of a protein, would merge together. A future direction is to carry out this mapping and determine more realistic structural mutation clusters. We also suspect that such an approach would further increase statistical power.
In order to identify important clusters and shed light on their function, we examined cluster gene-expression associations both globally and on a pathway level. In this analysis, we have highlighted a number of clusters that we believe are strongly implicated as driver clusters in diverse tumor types due to global gene expression associations. Additionally our pathway level of analysis has helped reveal more specific functional associations between mutation clusters and gene expression. Furthermore, we have shown that certain genes contain multiple clusters that may have different functional consequences, suggesting that different mutations in these genes may play different roles in cancer onset and progression based upon the location of the mutation. Finally, we investigated whether mutation clusters are associated with drug response data in cancer cell lines and found many mutation clusters which are associated with differen-tial drug sensitivity. These findings emphasizes the importance of taking a flexible approach in terms of identifying genomic features–specifically that neither an entire gene approach nor a single amino acid approach is necessarily sufficient.
Availability
In order to facilitate exploration of our data, including mutation clusters and pathway associa-tions, we have created an interactive graphical website:m2c.systemsbiology.net. The multiscale mutation clustering algorithm has also been made publicly available:https://github.com/
IlyaLab/M2C. All significant results from our pipeline (including those from other methods)
can be found as a multi-tabbed excel documentS1 Tables. These same tables are also available as TSV’s from our website. Detailed descriptions of the tables and the data they contain are in
S1 Table Descriptions.
Methods
Identifying multiscale clusters
An initial list of 628 genes was compiled by taking the highest ranked genes from MutSig [1], i.e. the most significantly frequently mutated genes, using a q-value threshold of 0.1. (The
Fig 6. A) Violin plot of the response of mTOR inhibitor Temsirolimus (IC50s, y-axis) across cancer cell lines. The cell lines are
grouped (x-axis) as wild-type PTEN (WT), depicted with gray markers and gray violin outline, cell lines with any non-synonymous mutation in PTEN (Any), depicted in black, and cell lines with a mutation in one of the hotspots, depicted in blue. Mutation clusters and any non-synonymous mutation features that are significantly associated with drug response (FDR<10%) are depicted in red. B) Violin plot of the response of a PI3Kb inhibitor for mutation clusters in PIK3CA.
MutSig results that we used in this work are based on the October 2014 analysis run of the Broad Institute TCGA Genome Data Analysis Center Firehose pipeline, available through
http://ezid.cdlib.org/id/doi:10.7908/C1K64H78andhttp://gdac.broadinstitute.org/runs/
analyses__2014_10_17/data/). These genes were further filtered to ensure that there are in
total at least 15 mutations in each gene across all 23 cancer types considered. This resulted in a list of 549 genes on which we ran our multiscale clustering algorithm. The cancer types consid-ered are: ACC, BLCA, BRCA, CESC, COAD, GBM, HNSC, KICH, KIRC, KIRP, LAML, LGG, LIHC, LUAD, LUSC, OV, PRAD, READ, SKCM, STAD, THCA, UCEC, and UCS. Full names can be found in T1 inS1 Tables. The raw mutation data we used for clustering can be found in T10 inS1 Tables.
Clusters are identified using all mutations combined from the pan-cancer data set to increase statistical power. These files are created from TCGA mutation annotation format (MAF) files and annotated with Annovar (section B inS1 Text) [50].
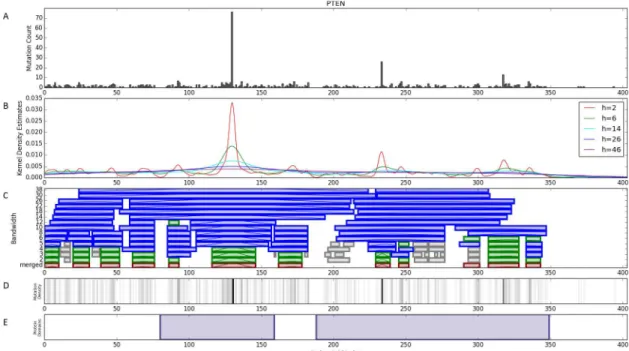
Our multiscale mutation clustering algorithm (M2C) identifies mutation clusters at multi-ple scales. Each scale represents different sized genetic features. First, M2C converts TCGA mutation calls in amino acid space from all 23 cancers into multiple continuous probability density functions (Fig 7Aand section C step 1 inS1 Text). This smoothing is done using a ker-nel density estimate (KDE) with a Gaussian kerker-nel at 28 different bandwidths between 2 and 450 (amino acids units). Each bandwidth represents a different length scale of amino acid fea-tures ranging from single amino acids to entire protein domains (Fig 7Band section C step 2
inS1 Text). These KDEs are each used to seed a multivariate mixture model consisting ofn
Gaussians and 1 uniform distribution, wherenis the number of local maxima in a given KDE. The noise weight is initially estimated by the fraction of synonymous mutations in the gene.
Fig 7. Multiscale Information-Based Clustering Algorithm. A) Pan-cancer mutation data is merged across all 23
tumor types for a single gene (PTEN). B) Gaussian kernel density estimates smooth this data at 28 different bandwidths or scales (a limited selection is shown for clarity). C) Each kernel density estimate is used to seed a multivariate mixture model of normal distributions and a single uniform distribution to represent background noise. Initial guesses for the locations of the normal distributions are determined from the local maxima of the kernel density estimates. Clusters from the mixture models (blue) are merged together using the greedy algorithm resulting in a final set of multiscale clusters (red). Green are duplicates of the red clusters and shown to clarify the process. Grey bars are excluded due to too few mutations. D) A mutation spectrum for PTEN. E) The two annotated protein domains in PTEN from PFAM.
The means of each Gaussian are initialized as the locations of the local maxima of the KDE. The standard deviation of each Gaussian is set as the distance between the two adjacent local minima around a given maxima. Finally, the weight of each Gaussian in the mixture model is estimated by the density at the local maxima minus one-nthof the noise weight (section C step
3 inS1 Text). An expectation maximization (EM) algorithm then optimizes the mixture model
(Fig 7Cblue bars). This process results in a set of clusters for each scale.
In order to generate a single set of multiscale clusters, the mixture models from each differ-ent scale are merged using a greedy algorithm. The clusters resulting from the EM algorithm for each scale with at least 15 mutations are placed in binary tree using Scipy’s hierarchical clustering function (section C step 4 inS1 Text). The cutoff of 15 was chosen to ensure that clusters had sufficient mutations for further statistical analysis. The unsigned area between the two Gaussian curves is used as the distance metric. The binary tree is flattened using a recur-sive greedy algorithm to minimize the Akaike Information Criteria with finite size correction (AICc) [51]. In short, given any two sets of clusters the algorithm finds the set of non-overlap-ping clusters which minimize the AICc. Although the enumeration of all non-overlapnon-overlap-ping sets of clusters is a computationally costly problem, by placing the clusters in a tree and performing this enumeration recursively the scale of the problem is reduced (section C step 6 inS1 Text). M2C results in a single set of non-overlapping multi-scale clusters (Fig 7Cred bars). We refer to clusters as a pair of amino acid positionsx-ywithxbeing the start of the cluster andybeing the end of the cluster.
Scoring M
2C clusters
The score,Sc, of clusterc, is given by the log of the ratio of the emission probability of the
mutations in the cluster with the emission probability of the same mutations based upon the null hypothesis of a uniform mutation distribution across the cluster,
Sc ¼
XN i¼1
logGðMi; mc; scÞ
U :
Mis the set of allNpan-cancer mutations in cluster c.G(x; μc,σc)is the normalized
Gauss-ian distribution with meanμcand standard deviationσcrepresenting the unweighted
compo-nent of the mixture model corresponding to clusterc. FinallyU = L-1is the emission
probability of single mutation by a uniform distribution over the gene containing the clusters of lengthL(in amino acids).
Multiscale mutation algorithm cross-validation analysis
In order to test the robustness of the M2C algorithm (referred to as M2C plus robustness), we split the entire underlying mutation data into two partitions and used each partition to gener-ate a new mixture model for each gene. We then compared the resulting clusters from each partition. First, we compared the log-likelihoods of the mixture model on the training data (i.e. data from the partition which generated the model) to the log-likelihood of the mixture model on the validation data (the other partition). The log-likelihoods of the two models are highly cor-related; Spearman correlation = .99, P0. These results are plotted inFig 2and indicate that the statistical model underlying M2C is robust. We also calculated the percent of clusters conserved between the two partitions. We define ‘conserved’ to mean that for two clusters in the same gene from different partitions, one of the clusters overlaps the other by at least 50%. Our cross-valida-tion analysis shows that on average M2C robustness is about 40%, meaning about 40% of clusters are conserved. However, we further note that smaller denser clusters are more highly conserved
and overlap by a greater percentage between partitions than large sparse clusters. The cluster score provides a good indication of how robust a cluster is likely to be, as shown inS4 Fig.
Characterizing clusters
We compared M2C to a different greedy clustering algorithm that had already been applied to TCGA data [7]. We ran the alternate method on the same data using default parameters and compared the resulting clusters to the multiscale clusters by looking at length, mutation counts, and how the different clusters overlap with each other and annotated protein domains from PFAM [34].
Cluster cancer type enrichment analysis
To determine whether specific cancer types are enriched for specific mutation clusters, we used Fisher’s exact test to calculate an enrichment P-value. A contingency table for each cluster cancer type pair was created across the pan-cancer set of samples based upon the two Boolean variables: 1) Is the sample inside the cluster and 2) Does the sample belong to the cancer type being analyzed. These results were then tested for significance together using the Benjamini– Hochberg method [52] with results at false discovery rates of 1%, 5%, 10% and 25% reported in T5 inS1 Tables.
Integrating clusters with gene expression data
We created 23 binary feature matrices, one for each cancer type. A binary feature matrix repre-sents which tumor samples contain mutations in which clusters. A tumor sample is said to be positive (1) for a given cluster if it contains a non-synonymous or nonsense mutation within the cluster (see boxes B and C ofFig 7for an illustration). Additionally we defined an ‘any non-synonymous mutation feature’ for each gene. A gene is said to have any non-synonymous mutation if it contains a non-synonymous mutation inside or outside of a cluster.
We used the binary feature matrices to compare cluster assignments within tumor samples to gene expression data from the TCGA. This analysis was carried out separately for each can-cer type. We used a Kruskal-Wallis test between features in the binary feature matrix and 2194 gene expression features. These features were chosen based upon the genes in the NCI pathway interaction database (PID) [53]. In each test, we used data from all tumors in each cancer type. Cluster features and any non-synonymous features with fewer than 5 positive tumor samples were excluded from this analysis. This analysis resulted in a set of P-values representing associ-ations between cluster features and gene expression levels.
Gene expression pathway analysis
In order to improve statistical power and gain more detailed understanding of how clusters affect molecular pathways, we combined P-values from the gene expression cluster associa-tions. To combine P-values we made use of the Empirical Brown’s Method for combining dependent P-values by taking into account the mutual correlation between genes in a pathway [25]. First we combined all 2194 gene expression associations for each cluster. We call these combined P-values global gene expression P-values. We then combined gene expression asso-ciation P-values from each pathway in the PID. This resulted in a set of cluster pathway associ-ation P-values. We carried out significance testing on the global and pathway associassoci-ations separately using the Benjamini–Hochberg method [52].Fig 8shows a schematic for the com-plete data processing pipeline.
Gene expression pathway association cross-validation
In order to ensure that our gene expression association pipeline is robust, we performed a cross-validation analysis. We used this analysis to calculate to robustness metrics. Association robustness measures the robustness of the gene expression association pipeline independently of the clustering pipeline. M2C plus association robustness measures the gene expression asso-ciation pipeline combined with the M2C algorithm. First, we selected a subset of our data cor-responding to all gene-tumor type pairs with significant global or pathway associations. This subset is made up of 369 significant pairs from 226 genes across 22 tumor types. For each of these gene-tumor type pairs, we independently partitioned the entire data set into two parti-tions each corresponding to an equal number of samples across all 23 cancers. This partition-ing was done ensurpartition-ing that the number of non-synonymous and synonymous mutations was about equal between partitions. We then re-ran M2C on each partition, resulting in two sets of clusters. For each set of clusters, we projected data from the training partition and the validat-ing partition (only considervalidat-ing one specific tumor type) to generate binary cluster features. We ran these features through our gene expression association pipeline and carried out signifi-cance testing at a false discovery rate of 10%. To calculate association robustness, we compared significant associations from the two partitions projected onto the same set of clusters and found that 85% of significant associations were conserved between partitions. In addition, we found a high correlation between the association log P-values between conserved significant associations between partitions: spearman correlation = 0.76, P<10−73. To calculate M2C plus association robustness, we further compared associations between different sets of clusters (each generated by a different partition). For this comparison, we projected the data from a given partition onto the corresponding clusters to generate feature vectors which were used for the gene expression association analysis. An association is said to be conserved if that asso-ciation is significant (at FDR = 10%) for two clusters in the same gene where either cluster cov-ers the other cluster by at least 50%. Between separate sets of clustcov-ers, we found that 63% of associations were conserved. The conserved associations also showed a high degree of correla-tion in their log P-values: spearman correlacorrela-tion = .87, P<10−56. Cross-validation data is included graphically inS5 Fig.
Calculating significant single gene expression features
In the pathway association table (T7A inS1 Tables), we have included lists of significantly dif-ferentially expressed gene expression features within a pathway that are strongly associated to a cluster (or any non-synonymous mutation). To determine if a gene expression feature is upregulated or downregulated, we compared the mean gene expression for samples which contained a non-synonymous mutation in that cluster (or any non-synonymous mutation) to the mean gene expression for samples which do not contain such a mutation. We used the Kruskal Wallis test P-values we had already computed in our analysis pipeline to determine
Fig 8. Statistical Methods Pipeline. A) 549 genes with a total of 33507 pan-cancer mutations are run through our multiscale
clustering algorithm resulting in 1295 clusters. B) Clusters are assigned to 4471 tumors samples across 23 tumor types creating a binary feature matrix. A tumor sample is said to be positive for a cluster if there is any non-synonymous mutation in the tumor and the cluster. C) The binary feature matrices are statistically compared to 2194 gene expression features separately for each cancer type using the Kruskal-Wallis Test. D) The pairwise P-values from the Kruskal-Wallis tests are combined globally and on the pathway level using the Empirical Brown’s Method across 172 Pathways. E) This resulted in 546810 association P-values.
significance, correcting for multiple testing separately for every pathway using the Benjamini– Hochberg method at a false discovery rate of 1% [52].
Drug response analysis of cancer cell lines
We used a slightly expanded version of a previously published cancer cell line dataset [46,47]. Specifically, the dataset contained 714 cell lines and 142 anti-cancer drugs. The half-maximal inhibitory concentrations at 72 hours (IC50s) obtained in this dataset were used to represent the drug response. In this work, IC50s were recorded as the natural logarithm of the half-maxi-mal inhibitoryμM concentration. The drug screening dataset is incomplete, i.e. not all 142 drugs have been screened across all 714 cell lines. In total 81,700 IC50s were measured and 19,688 (19%) were missing values. The statistical tests were applied to each drug separately; cell lines that lack an IC50 were not used. We did not impute missing IC50s. This cell line data-set contains non-synonymous mutation calls for 77 known cancer genes across these cell lines based on capillary sequencing. Additional information on these data is found in [46,47] and on the Genomics of Drugs Sensitivity in Cancer webpages (http://www.cancerrxgene.org/). The data as used in this manuscript can be found in T11 inS1 Tables.
For each of the genes, we created a binary ‘any non-synonymous mutation’ feature, which was 1 for all cell lines with a non-synonymous mutation in the gene and 0 otherwise. Also, for each of genes we created binary mutation cluster features using the clusters identified by M2C on the TCGA data. Specifically, the binary mutation cluster feature is 1 when the cell line has a non-synonymous mutation in the cluster and 0 otherwise. We discarded all features that had less than 5 1’s. Then, for each combination of a binary mutation feature and a drug we applied a simple Kruskal-Wallis test to test whether the group of cases (1’s in the binary mutation ture) had an equal median IC50 compared to the control group (0’s in the binary mutation fea-ture). Low P-value indicates a significant difference in the median IC50s between the two groups. P-values for all combinations are given in T13 inS1 Tables. Results were considered significant at a FDR of 10%.
Supporting information
S1 Fig. Percentage of clusters with at least one significant gene expression association.
Pathway and global associations are both shown binned by cluster size. Under the cluster size, n signifies the total number of clusters in each bin. Four different false discovery rates are shown (1%: Red, 5%: Cyan, 10%: Green, 25% Blue).
(TIF)
S2 Fig. Differential Cluster Pathway Associations inFUBP1in Brain Lower Grade Glioma.
Clusters without significant pathway associations are omitted for clarity. A FDR of 1% was used to filter for significance.
(TIF)
S3 Fig. Differential Cluster Pathway Association inCDH1in breast invasive carcinoma.
Clusters without significant pathway associations are omitted for clarity. A FDR of 1% was used to filter for significance.
(TIF)
S4 Fig. Multiscale Mutation Clustering Cross-validation Heatmaps. Left) Average overlap
percentage for clusters from two partitions (binned by length and mutation count). Gray boxes contain no items. Number of clusters in each bin is indicated by n. Right) Average clus-ter score for the same binned clusclus-ters showing that this score is a reasonable proxy for
robustness. (TIF)
S5 Fig. Gene Expression Pathway Association Cross-validation Scatter Plots. Left) This
plot shows association robustness. Data was separated into two partitions A and B. Data from A was used to generate the clusters (“training partition”). Data from B (the validation parti-tion) is compared to A by projecting each partition separately onto the same set of clusters and comparing the pathway associations. This process was then repeated with using B as the train-ing partition and A as the validation partition on a different set of clusters. Right) This plot shows M2C plus association robustness. Here, partition A and partition B were both used to generate separate sets of clusters and the downstream association analysis was performed inde-pendently. Cluster associations are matched if the one of the two clusters (from partition A and B respectively) overlap the other by at least 50%.
(TIF)
S1 Tables. All Supplemental Tables. This document includes all the supplemental tables
ref-erenced in the manuscript as separate excel tabs. Detailed descriptions of these tables can be found inS1 Table Descriptionsdocument. The tables are also downloadable as individual TSV’s from the M2C website,http://m2c.systemsbiology.net/.
(XLSX)
S1 Table Descriptions. Descriptions of all supplemental tables. This document contains
descriptions of the supplemental tables, including specific break downs of what information is in each table and how it is formatted. The actual data can be found inS1 Tablesas a single excel spreadsheet or as individual TSV’s fromhttp://m2c.systemsbiology.net/.
(DOCX)
S1 Text. Data, Methods, and Algorithm Details. This document contains detailed
informa-tion on where the data used in this work comes from, data processing steps, and an in-depth description of the M2C algorithm.
(DOCX)
Author Contributions
Conceptualization: WP IS TAK BB. Data curation: WP KL.
Formal analysis: WP TAK BB. Funding acquisition: IS. Investigation: WP TAK BB. Methodology: WP TAK BB. Project administration: IS. Resources: TAK BB IS. Software: WP KL TAK BB. Supervision: IS TAK BB. Validation: WP TAK BB. Visualization: WP KL TAK BB.
Writing – original draft: WP KL IS TAK BB. Writing – review & editing: WP KL IS TAK BB.
References
1. Lawrence MS, Stojanov P, Polak P, Kryukov GV, Cibulskis K, et al. (2013) Mutational heterogeneity in cancer and the search for new cancer-associated genes. Nature 499: 214–218. doi:10.1038/ nature12213PMID:23770567
2. Dees ND, Zhang Q, Kandoth C, Wendl MC, Schierding W, et al. (2012) MuSiC: identifying mutational significance in cancer genomes. Genome Res 22: 1589–1598. doi:10.1101/gr.134635.111PMID: 22759861
3. Van den Eynden J, Fierro AC, Verbeke LP, Marchal K (2015) SomInaClust: detection of cancer genes based on somatic mutation patterns of inactivation and clustering. BMC Bioinformatics 16.
4. Adzhubei IA, Schmidt S, Peshkin L, Ramensky VE, Gerasimova A, et al. (2010) A method and server for predicting damaging missense mutations. Nat Methods 7: 248–249. doi:10.1038/nmeth0410-248 PMID:20354512
5. Ng PC, Henikoff S (2003) SIFT: Predicting amino acid changes that affect protein function. Nucleic Acids Res 31: 3812–3814. PMID:12824425
6. Kircher M, Witten DM, Jain P, O’Roak BJ, Cooper GM, et al. (2014) A general framework for estimating the relative pathogenicity of human genetic variants. Nat Genet 46: 310–315. doi:10.1038/ng.2892 PMID:24487276
7. Tamborero D, Gonzalez-Perez A, Lopez-Bigas N (2013) OncodriveCLUST: exploiting the positional clustering of somatic mutations to identify cancer genes. Bioinformatics 29: 2238–2244. doi:10.1093/ bioinformatics/btt395PMID:23884480
8. Kamburov A, Lawrence MS, Polak P, Leshchiner I, Lage K, et al. (2015) Comprehensive assessment of cancer missense mutation clustering in protein structures. Proc Natl Acad Sci U S A 112: E5486–5495. doi:10.1073/pnas.1516373112PMID:26392535
9. Ryslik GA, Cheng Y, Cheung KH, Modis Y, Zhao H (2013) Utilizing protein structure to identify non-ran-dom somatic mutations. BMC Bioinformatics 14: 190. doi:10.1186/1471-2105-14-190PMID: 23758891
10. Ryslik GA, Cheng Y, Cheung KH, Modis Y, Zhao H (2014) A graph theoretic approach to utilizing protein structure to identify non-random somatic mutations. BMC Bioinformatics 15: 86. doi: 10.1186/1471-2105-15-86PMID:24669769
11. Porta-Pardo E, Garcia-Alonso L, Hrabe T, Dopazo J, Godzik A (2015) A Pan-Cancer Catalogue of Can-cer Driver Protein Interaction Interfaces. PLoS Comput Biol 11: e1004518. doi:10.1371/journal.pcbi. 1004518PMID:26485003
12. Reimand J, Bader GD (2013) Systematic analysis of somatic mutations in phosphorylation signaling predicts novel cancer drivers. Mol Syst Biol 9: 637. doi:10.1038/msb.2012.68PMID:23340843
13. Eser S, Schnieke A, Schneider G, Saur D (2014) Oncogenic KRAS signalling in pancreatic cancer. Br J Cancer 111: 817–822. doi:10.1038/bjc.2014.215PMID:24755884
14. Pylayeva-Gupta Y, Grabocka E, Bar-Sagi D (2011) RAS oncogenes: weaving a tumorigenic web. Nat Rev Cancer 11: 761–774. doi:10.1038/nrc3106PMID:21993244
15. Polakis P (1999) The oncogenic activation of beta-catenin. Curr Opin Genet Dev 9: 15–21. PMID: 10072352
16. Rubinfeld B, Robbins P, El-Gamil M, Albert I, Porfiri E, et al. (1997) Stabilization of beta-catenin by genetic defects in melanoma cell lines. Science 275: 1790–1792. PMID:9065403
17. Morin PJ, Sparks AB, Korinek V, Barker N, Clevers H, et al. (1997) Activation of beta-catenin-Tcf signal-ing in colon cancer by mutations in beta-catenin or APC. Science 275: 1787–1790. PMID:9065402
18. Kim W, Kim M, Jho EH (2013) Wnt/beta-catenin signalling: from plasma membrane to nucleus. Bio-chem J 450: 9–21. doi:10.1042/BJ20121284PMID:23343194
19. MacDonald BT, Tamai K, He X (2009) Wnt/beta-catenin signaling: components, mechanisms, and dis-eases. Dev Cell 17: 9–26. doi:10.1016/j.devcel.2009.06.016PMID:19619488
20. Joerger AC, Fersht AR (2007) Structure-function-rescue: the diverse nature of common p53 cancer mutants. Oncogene 26: 2226–2242. doi:10.1038/sj.onc.1210291PMID:17401432
21. Olivier M, Hollstein M, Hainaut P (2010) TP53 mutations in human cancers: origins, consequences, and clinical use. Cold Spring Harb Perspect Biol 2: a001008. doi:10.1101/cshperspect.a001008PMID: 20182602