Master Thesis of Medicine N
o1735
Computational brain anatomy in patients
with temporal lobe epilepsy
Student
Gaëlle Weatherill
Tutor
Pr Bogdan Draganski
Laboratoire de Recherche en Neuroimagerie, LREN
Département des Neurosciences Cliniques, CHUV
Expert
Dr Ueli Kramer
Institut Universitaire de Psychothérapie
Département de Psychiatrie, CHUV
Lausanne, February 2015
Table of contents
Table of contents ... 2
Abstract ... 3
1.
Introduction ... 4
1.1.
Epilepsy -‐ clinical phenotype ... 4
1.2.
Temporal lobe, hippocampus and limbic system ... 5
1.3.
Temporal lobe epilepsy ... 6
1.3.1.
Clinical presentation ... 6
1.3.2.
Mesial temporal sclerosis ... 6
1.3.3.
Focal cortical dysplasia ... 8
1.4.
Where are we now? Updates on brain imaging in temporal lobe epilepsy ... 9
1.5.
Objectives and hypotheses ... 9
2.
Material and methods ... 10
2.1.
Subjects and clinical data ... 10
2.2.
MRI acquisition ... 11
2.3.
MRI preprocessing ... 11
2.4.
MRI Statistical analysis ... 12
2.5.
Clinical features ... 12
3.
Results ... 13
3.1.
Grey matter analysis ... 13
3.2.
White matter analysis ... 15
3.3.
Clinical features analysis ... 18
4.
Discussion ... 19
4.1.
Findings in the limbic system ... 19
4.1.1.
Findings in mesio-‐temporal lobe sclerosis ... 19
4.1.2.
Findings in cryptogenic epilepsy ... 20
4.1.3.
Findings in focal cortical dysplasia ... 21
4.2.
Findings within the prefrontal cortex ... 22
4.3.
Findings in the parietal and occipital lobes ... 23
4.4.
Findings in the cerebellum ... 24
5.
Conclusion ... 25
5.1.
Summary and perspectives ... 25
5.2.
Limitations and outlook ... 25
6.
Bibliography ... 26
Abstract
BACKGROUND
Temporal lobe epilepsy (TLE) is a frequent type of focal epilepsy that constitutes 30% to 50% of
all epileptic syndromes. This medical condition is often associated with hippocampal sclerosis,
however it can be due to cortical dysplasia, brain tumour, vascular malformation or without any
evidence for pathology (cryptogenic). Even though the main symptoms are the seizures, epilepsy
sometimes interferes with cognitive functions such as visual or verbal memory, language or attention. TLE is frequently pharmaco-‐resistant and only a hippocampal resection helps patients
to become seizure-‐free. Temporal lobe epilepsy is also described as a progressive disorder that
causes chronic brain tissue damages. History of febrile seizures and status epilepticus, frequency
of seizures and age at onset of seizure, as well as epilepsy duration or years of anti-‐epileptic drugs use are all factors that impact the gravity of the brain structure’s damage. Magnetic resonance imaging (MRI) has undergone a considerable development and, nowadays, has
become an essential clinical tool in the diagnosis of TLE. It is currently used to reveal precisely
cerebral abnormalities that may induce seizures.
PURPOSE
The aim of this cross-‐sectional study is to investigate the pattern of microstructural brain tissue
characteristics (grey and white matter volumes) occurring in three clinically distinctive TLE
entities: mesial temporal sclerosis (MTS), focal cortical dysplasia (FCD) and cryptogenic epilepsy. By comparing them to each other, we want to acquire in-‐depth knowledge of their pathological mechanism. We use well-‐established computational anatomy methodology -‐ voxel-‐ based morphometry (VBM) to investigate brain anatomy changes related to the present clinical phenotype.
CONTRIBUTION OF THE STUDY
In the past few years, there has been a lot of controversy concerning structural MRI findings in TLE. Most of the studies looked for informative brain changes in epilepsy with MTS compared with healthy controls. This study is the first to take into consideration all clinical aspects of TLE together -‐ mesial temporal sclerosis, focal cortical dysplasia and cryptogenic epilepsy.
MATERIAL AND METHODS
In-‐vivo anatomical brain imaging data (MRI at 1.5T) was acquired in patients with clinical
diagnosis of temporal lobe epilepsy. TLE patients were divided in three groups according to radiological description of brain MRI findings -‐ mesial temporal sclerosis [MTS_group], focal cortical dysplasia [Dysplasia_group] and cryptogenic epilepsy [NoMRI_group] and compared with healthy volunteers. VBM technique was used to identify brain tissues alterations (GM and
WM).
RESULTS
We demonstrate that MTS showed similar grey and white matter volumes reduction in the hippocampus, thalamus and cerebellum ipsilateral to the epileptogenic focus when compared with cryptogenic epilepsy patients and healthy controls. The focal cortical dysplasia patients showed grey matter volume loss restricted to the thalamus.
Key Words: VBM -‐ Temporal lobe epilepsy – MRI -‐ Mesial temporal sclerosis
1.
Introduction
1.1.
Epilepsy -‐ clinical phenotype
Epilepsy is a common neurological condition characterized by recurrent seizures in response to a disproportionate neuronal activity in a group of neural cells that are localised in a part, or more dispersed throughout the brain. This abnormal neuronal excitability induces a partial or general cerebral network disruption, clinically affecting motor control, sensory perceptions, behaviour and autonomic functions. Seizures are always spontaneous and unprovoked, even though some substantial triggers can facilitate their appearance by increasing the seizure threshold such as sleep deprivation, alcohol, flashlights or loud music expositions, or even strong emotions (1).
Epileptic disorders affect nearly 1% of the population worldwide, and there is no evidence of
gender predominance (2). Prevalence is increased in children, young adults and elderly people,
but the underlying causes differ with age. As an example, vascular or brain tumour aetiologies are more common in the elderly population, whereas seizures related to genetic syndromes or cryptogenic epilepsy are frequent in the young. However, it remains often difficult to give an exact diagnosis; indeed an identifiable cause of epilepsy is found in only less than fifty per cent of the cases, especially in children and young adults (2).
Considering the fact that numerous aetiologies lead to an epileptic condition, the International League Against Epilepsy Task Force and Terminology (ILAE) proposed a classification of epileptic disorders whose last version was published in 2010 (3). Based on the presented clinical phenotype, they are classified into three major types – i) generalized seizures with subgroups depending on the type of the seizure (tonic, clonic, absence, tonic-‐clonic, atonic and myoclonic); ii) focal seizures and iii) seizures of unknown origin. Sometimes, focal seizures can evolve and become secondary generalized (4). The ILAE classification determines the potential aetiology of this condition, namely if it is genetic, structural, metabolic or if the real cause is unknown. Thus, focal seizures are more common and an identifiable cause is often discovered with the combination of a magnetic resonance imaging (MRI) and an electroencephalogram (EEG). Finally, it is important to mention if the epileptic disorder is a part of an electro-‐clinical or surgical syndrome.
In order to classify the epileptic disorder correctly and to have an adequate patient management, the first seizure has to be thoroughly investigated. The diagnostic assessment starts usually with a full medical history, which contains a detailed description of the seizure (before, at the time and after) by a witness and the patient himself. It is also imperative to explore the general history of the patient such as his current medication, a positive history of febrile seizures, his familial background of epilepsy or his past medical history (2). When unprovoked seizures are suspected, the first-‐line paraclinical exams will always involve brain imaging, usually a brain MRI, to rule out structural abnormalities. Finally, an EEG should complete the exploration.
Protocol for MRI investigations according to Up-‐to-‐date (5):
One acquisition should consist of contiguous, thin (<1.5mm) slices covering the entire brain in two orthogonal plans and with one of the orientations involving the oblique coronal image in order to see the hippocampus clearly. Ideally, five sequences should be included in the exam namely the T1-‐weighted, T2-‐weighted fast spin-‐echo sequences, the gradient echo (T2) and the FLAIR sequences. Finally 3D volume images will allow an easier detection of the cortical dysplasia.
1.2.
Temporal lobe, hippocampus and limbic system
The hippocampal formation is located in the mesial temporal lobe and constitutes two main structures: the dentate gyrus and the hippocampus proper (6). It has its origins in the archicortex, which features three primitive layers (7). The laminar structure includes four distinct layers (6):
-‐ The alveus with outgoing axons
-‐ The stratum oriens with interneurons
-‐ The stratum pyramidal with pyramidal cells
-‐ The stratum lacunosum and moleculare with dendrites and interneurons
The dentate gyrus is characterised by a three-‐layer-‐organisation: the granular, the molecular and the polymorphic cells layers. In the hippocampus proper the stratum pyramidal is furthermore divided into four subfields called the Ammon’s horn: The CA1 is the largest region and is in continuity with the subiculum, the CA2 is narrower and has dense neurons, the CA3, forms the curvature of the hippocampus, and the CA4 is located near the dentate gyrus (6). The structures adjacent to the hippocampus, which also belong to the mesial temporal lobe, are the amygdala, the subiculum and the parahippocampal gyrus with the entorhinal cortex. The definition of the hippocampal formation is still disputed and several authors include the subiculum or the entorhinal cortex to the definition.
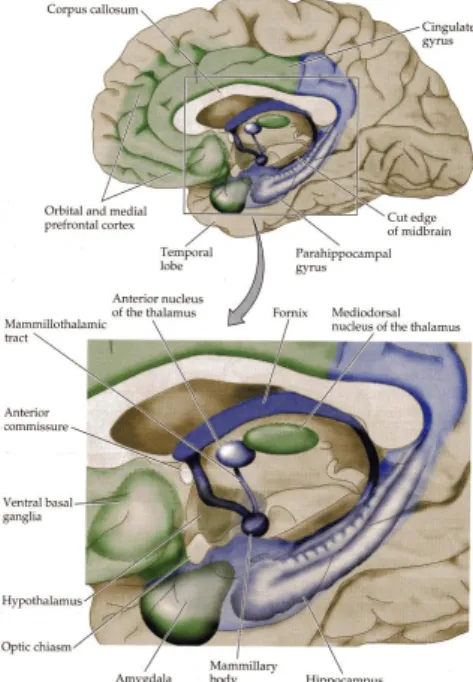
Regardless which definition of the hippocampal formation is used, all these mesial temporal structures form the limbic lobe with the cingulate gyrus and are integrated to the limbic system with the amygdala and the mammillary bodies, in the posterior part of the hypothalamus (8). In addition, few other cortical and subcortical structures are functionally connected to this system -‐ medial prefrontal and orbitofrontal cortices, the anterior and the medio-‐dorsal thalamic nuclei, and finally the ventral striatum (8). This entire limbic complex plays thereby an important role in the control of the autonomic functions, the emotions and the behaviour (9). However, the main function of the hippocampal formation remains the memory such as the explicit episodic memory, which is the most altered function in case of mesial temporal lobe epilepsy (MTLE) (10). Indeed, a few histological studies discovered that granular cell abnormalities are correlated with learning dysfunction (11).
White matter fibers of the entorhinal region, the cingulum and the fornix form the main afferent tracts of the hippocampus, which receives information from the olfactory areas, the amygdala and a few other neocortical regions. The efferent tracts are mainly located in the fornix, which is separated in pre-‐ and post-‐ commissural fornix, and the stria longitudinalis (7). Other white matter tracts are implicated in the limbic system, enabling thus the structures to be strongly interconnected among them and to form few distinctive brain circuits.
An important circuit of the limbic system is the Papez circuit, described in the mid-‐20th century
and mostly involved in the emotions. Papez demonstrated that the hippocampus sends projections to the mammillary bodies throughout the fornix. The latter connects to the anterior
Figure 1 A schematic outline of the limbic system (From Neurosciences, Purves et al.,
thalamic nucleus, which is in turn also connected to the cingulate cortex. Finally, fibers from the cingulate cortex reach back the hippocampus via the cingulum (7), (8).
1.3.
Temporal lobe epilepsy
1.3.1.
Clinical presentation
Temporal lobe epilepsy (TLE) is the most frequent focal epilepsy diagnosed in the adult and mesial temporal sclerosis (MTS) is its most common underlying lesion (12). Focal cortical dysplasia (FCD), also called neocortical epilepsy, is the other frequent anatomical abnormality
causing focal epilepsy. Even though TLE is rarely hereditary, it can sometimes be part of a familial
genetic syndrome. Besides, the only characteristic that differentiates the familial type from the acquired TLE is a positive family history of epilepsy (13).
1.3.2.
Mesial temporal sclerosis
MTS is described as a progressive condition that begins with a precipitating injury and seizures appearing generally in the late childhood, after a few years of latency (11). This first injury can be a traumatism, an intracranial infection (meningitis), or the consequence of a history of complex febrile seizures (FS). In this disorder, events occur with an episode of fever without evidence of intracranial infection. Febrile seizures affect 2 to 5% of children between three months and five years (14). Some MRI studies revealed that several FS are associated with anatomical hippocampal alterations, evolving from an acute hippocampal oedema to atrophy (14). Only 2 to 10% of the children with complex FS will develop epilepsy (14), but most of the patients with diagnosis of MTS had a history of prolonged or complex FS in their childhood. The risk to develop epilepsy is higher in the case of complex FS, when there is a family history of epilepsy, or a neurological impairment is diagnosed before the FS period (14). The use of anti-‐ epileptic drugs is often beneficial at the beginning of the disease and may offer a temporary seizures control but most of the patients become in due course resistant to pharmacological treatment, meaning a loss of seizure control despite the setting up of two distinct and adequate treatment schedules (11). Here, a surgical resection of the epileptogenic focus in the temporal lobe is the last option to help patients to become seizure-‐free (13).
Clinically, patients with MTLE have a typical pattern of symptoms during the seizure; hence the
diagnosis can be established after description of the seizure by a witness and the patient himself.
Seizures often start with characteristic sensitive or psychiatric phenomena like epigastric sensation, déjà vu, fear etc. (11), (12). In association with these symptoms, complex partial seizures usually continue with a motor arrest, a motionless stare with pupillary dilatation and impairment of awareness and responsiveness. Automatisms could also occur during seizures, whose semiology informs about the location of the focus. Thus, unilateral automatisms, usually involving the hands, are ipsilateral to the seizure focus while the dystonic posturing tends to be contralateral (12). Other signs could inform about the side of the seizure focus, like an alteration of the ictal speech involve rather the non dominant temporal lobe (TL) whereas ictal anomia or postictal dysphasia usually mean an alteration of the dominant TL (11). A relative long period of postictal confusion usually follows the seizures (6). Even if recurrent seizures are the main characteristic occurring in the epilepsy, some cognitive impairment such as language or memory alterations (including the declarative and episodic memories), or even attention deficits are
reported as the most important comorbidities related to this condition (11), (15). Bell et al.
(2011) speculated that heterogeneous cognitive impairments are related to a global alteration of the brain structural integrity involving both the grey and white matter (15). Finally, patients with epilepsy often suffer from mood disorders, particularly anxiety, depression and suicidal ideation. This makes the screening for depression as pertinent part of the follow-‐up (4).
These past years, MRI has become an important tool in the evaluation of patients with epilepsy, especially in the detection of brain structural abnormalities causing epileptic condition. Standard MRI protocol to detect mesial temporal sclerosis includes coronal slices perpendicular to the long axis of the hippocampus (6). A diagnosis of MTS is suspected if the hippocampal volume is considerably reduced, if the signal intensity is increased on T2-‐weighted images, or else if the internal architecture is altered (6). Unfortunately, the MRI diagnosis of MTS is in part expert-‐dependant and 20 to 30% of the patients with chronic focal epilepsy are undiagnosed, meaning that their MRI shows no structural abnormalities (6).
Macroscopically, atrophy of the hippocampus is the main mechanism that occurs in MTS. The histopathology of the epileptic hippocampus is indeed associated with different patterns of neuronal alterations, including the most important abnormality, the loss of pyramidal neurons. The latter is mainly localised in the CA1 and CA4 subfields, with variable loss from CA3 and a relative sparing of the CA2 region and granule cells of the dentate gyrus (6). Furthermore, frequent subsequent pathological phenomena, like chronic fibrillary gliosis in the pyramidal
cells layer, could also explain macroscopic hippocampal tissue atrophy and hardening (6). A
careful distinction should be made between the hippocampal sclerosis and the MTS, depending
on whether the adjacent structures of the hippocampus are affected or not.
Histologically, Wyler et al. proposed a grading system to evaluate the severity of the neuronal
loss (11). It contains four different grades:
-‐ Grade 1, mild mesial temporal damage (MTD): gliosis with <10% or no neuronal cell
loss in CA1, CA3 and/or CA4
-‐ Grade 2, moderate MTD: gliosis with 10 to 50% neuronal cell loss in CA1, CA3 and/or
CA4
-‐ Grade 3, moderate to marked MTD: gliosis with more than 50% neuronal dropout in
CA1, CA3 and CA4, with sparing of CA2 (this grade is also called the classical Ammon’s horn sclerosis),
-‐ Grade 4, marked MTD: gliosis with more than 50% neuronal cell loss in all sectors of the
hippocampus. The extra-‐hippocampal mesial temporal lobe can also be involved (this grade is the equivalent to the total Ammon’s horn sclerosis).
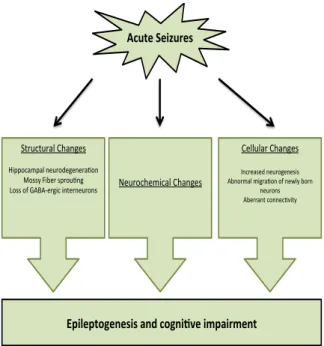
A second pathophysiological mechanism involved in the mesial temporal sclerosis is the propensity of the neurogenesis to increase in the acute phase of the disease. That is a throughout life mechanism involving new stem cells (NSCs) proliferation, mainly residing in the subgranular zone of the dentate gyrus. Phases of differentiation and migration into the granule cells layer of the dentate gyrus allow the newly dentate granule cells (DGCs) to become functionally integrated into the hippocampal circuitry in nearly four weeks (16), (17), (18). To date, the implication of the hippocampus, more specifically the dentate gyrus, is well known in the learning process and memory acquisition and neurogenesis tends to play a major role to maintain these functions throughout life (16), (18). Physiological stimuli, like physical exercises, could positively influence this neuronal production. But pathological phenomena as seizures activity could also induce abnormal hippocampal neurogenesis, essentially in the
Figure 2 A schematic outlines of pathological mechanism in Mesial Temporal Sclerosis, inspired from the report of Kuruba et al. (2010)
!"#$%&'%()#*%+& !"##$#%&'!(%)*"+'' ' ,)-&"%+".')"$&/*")"+0+' 12)/&3%#'30*&%4/)'/5')"6#7'2/&)'' )"$&/)+' 12"&&%)8'-/))"-49087' :"$&/-("30-%#'!(%)*"+' '' ;8&$-8$&%#'!(%)*"+' ' <0==/-%3=%#')"$&/."*")"&%4/)' >/++7'?02"&'+=&/$4)*' @/++'/5'A1B1C"&*0-'0)8"&)"$&/)+' ,-(.%-$/0%1%+(+&213&"/01(45%&(6-2(*6%1$&
early stage of the disease (18). Indeed, after a latency of a few days, acute seizures increase not only the NSCs proliferation but also accelerate their differentiation and induce aberrant migration through the dentate hilus or the dentate molecular layer (17), (18). Even though this abnormal activity is temporary and only lasts few weeks before the NSCs proliferation goes back to baseline level, this pathological mechanism is sufficient to permanently alter the neuronal interconnectivity through the hippocampal complex (18). Indeed, two main cell alterations remain persistent: the ectopic granule cells, resulting from the aberrant migration, and the persistence of the hilar basal dendrites in the newly granule cells, a feature of immature DGCs (17). Both of these alterations raise the propensity of an aberrant circuitry, leading to a future chronic epileptogenic network.
In the chronic stage of the epilepsy, neurogenesis is drastically decreased (19). Although the real pathological mechanism explaining this reduction remains still unknown, several potential reasons were mentioned these last few years: the chronic inflammatory conditions, neural stem cells depletion, decreased number of neural stem cell mitogenic or growth factors leading then to an altered neuronal differentiation (18), (19). Aside from maintaining spontaneous seizures activity, neurogenesis depletion in the chronic stage of epilepsy is also suspected to drastically impair the hippocampal-‐dependant cognitive functions such as learning and memory acquisition (16), (17).
Mossy fibers’ sprouting is another seizure-‐induced mechanism bringing the hippocampus to an epileptic condition. Mossy fibers are axons from glutamatergic dentate gyrus cells that usually project into the pyramidal cells and interneurons of the CA3 and the CA4 subfields (6), (17). In epileptic condition, mossy fibers from adult-‐born DGCs at the time of the acute seizure will sprout some axonal collaterals, whose synapses will directly connect other granule cells into the dentate molecular layer, inducing then a recurrent excitatory network and increasing the seizures susceptibility (17). MTS is often associated with other pathological alterations such as a low-‐grade tumour, but also vascular or cortical malformations (6). Among these lesions, the focal cortical dysplasia could also be present with the hippocampal atrophy.
To summarize, all these pathophysiological mechanisms lead to an anatomical and functional neuronal reorganisation, not only in the hippocampal formation but also in the mesial temporal lobe and regions beyond. As the mesial temporal lobe epilepsy is a progressive disorder, damages mainly follow different steps, including a progression of the hippocampal atrophy and the presence or not of some collateral alterations. This reorganisation usually leads to epileptogenesis, meaning an increasing of the epileptic threshold.
1.3.3.
Focal cortical dysplasia
Focal cortical dysplasia arises from a disruption of the cortical development consisting of three main stages: proliferation of undifferentiated cells, neuroblasts migration and cells differentiation into mature neurons or glia (20). Depending on when the disruption occurs in the development, a pattern of cortical malformations could appear, ranging from abnormalities of cortical lamination to alterations of the neuronal maturation, or even neuronal differentiation (20). This could affect only a small cortical region or be much more expended and affect several lobes. According to the International League Against Epilepsy’s (ILAE) classification established in 2010, focal cortical dysplasia is separated in three main types. The first one refers to an isolated malformation mainly due to the dyslamination while the second type includes the presence of dysmorphic neurons following an abnormal cell development and maturation. The third type contains all the focal cortical dysplasia associated with another pathology that occurs during development such as the hippocampal sclerosis, gangliomas, adjacent vascular malformations or other acquired epileptogenic lesions (21).
The histo-‐pathological changes in focal cortical dysplasia follow a broad spectrum, going from a cortical disorganization to cytological abnormalities such as balloon cells, large dysmorphic neurons or gliosis (22). On MRI, the presence of a visible abnormality is associated with the degree of histo-‐pathological derangement. The two main alterations found in a standard MRI with T1-‐weighted images would be a thickening of the cortex and an erasure of the grey-‐white matter boundary. Whereas the signal of the subjacent white matter is often decreased, no changes were found in the grey matter. Finally, the intensity of the grey matter is often increased on the T2-‐weighted images (22).
1.4.
Where are we now?
Updates on brain imaging in temporal lobe epilepsy
To date, neuroimaging plays a major role in the establishment of accurate diagnosis, the clinical evaluation and the therapeutic management of drug-‐resistant epilepsy. Noninvasive and safe, MRI is a highly sensitive and specific tool for identification of mesial temporal sclerosis or focal cortical dysplasia. It is also the modality of choice in the diagnosis of first epileptic seizure (11). Indeed, MRI determines the potential focus inducing the epileptic conditions and, by allowing the complete resection of the epileptic zone, renders the post surgical outcome more favourable (22). But MRI imaging misses significant pathology in 20 to 30% of the patients with chronic focal epilepsy (6). Thus, the qualitative character of neuro-‐radiological MRI assessment is not sufficient to diagnose focal epilepsy alone and has to be performed with other paraclinical exams where clinical features are also taken into consideration.
Computational anatomy describes a plethora of well-‐established automated tools for assessment of brain anatomy and allowing a better comprehension of the different epileptic conditions. To date, two main methods have been used to perform a morphometric analysis. The first one
consisted in comparing tissue abnormalities in an a priori region of interest (ROI) between two
groups of subjects. Indeed, most of these studies focused their analyses to regions that were already known to be strongly involved in TLE such as the hippocampus and areas nearby. Voxel-‐ based morphometry studies (VBM), a whole brain automatic quantitative technique, were thereafter increasingly used, up to be the method of choice to analyse grey and white matter alterations at a voxel level. This technique could first confirm the tissues alterations in regions previously described in the ROI works. But VBM studies also reported many extra-‐hippocampal and extra-‐temporal areas of focal structural changes throughout the brain. Most of the VBM studies perform comparison between a group of patients with drug-‐resistant MTS and a group of healthy volunteers and only few studies included patients with cryptogenic TLE or patients with focal cortical dysplasia.
1.5.
Objectives and hypotheses
With this study, we aimed to characterize the distribution of brain structural abnormalities between the three most frequent entities of temporal lobe epilepsy namely, the mesial temporal sclerosis, the focal cortical dysplasia and epilepsy without MRI significant alterations. We also want to characterize potential links between these three entities in order to better understand the pathological mechanisms underlying these conditions. Our two hypotheses are:
-‐ MTS is a progressive disease, starting from a clinical diagnosis of temporal lobe epilepsy
without any significant brain alteration on standard MRI, and evolving to hippocampal atrophy in the chronic stage of the disease. Thus, we suspect that the group of patients without any pathological MRI has actually a diagnosis of mesial temporal sclerosis but are in the early stage of the disease.
-‐ Subjects with a diagnosis of mesial temporal sclerosis will rather show alterations in
regions strongly connected to the limbic system than patients with focal cortical dysplasia. This would thus suggest a disruption of the limbic network, starting from the
2.
Material and methods
2.1.
Subjects and clinical data
We acquired data in 153 patients with diagnosis of unilateral temporal lobe epilepsy and 120 healthy volunteers (age-‐ and sex-‐matched). Criteria of TLE used for this study were taken from the classification and terminology of the ILAE (version from 1989), which set up its diagnostic scheme into five axes: ictal phenomenology, seizure type, syndrome, etiology and impairment (23). Clinical description included seizure’s phenomenology, age of epilepsy onset and its duration, drug-‐resistance and progressive nature of the disease. A long-‐term video electroencephalography monitoring and MRI images supplemented the investigations in order to find the epileptogenic zone and its lateralization. Patients with an unclear laterality of seizure onset were excluded from the study as well as people with history of brain trauma, drug/alcohol abuse, history of ischemic lesions or brain tumours.
Patients with TLE were separated into three main groups according to their MRI criteria at the time of diagnosis. The first group included 57 patients with signs of hippocampal atrophy,
namely the MTS_group for Mesial Temporal Sclerosis. (34 men and 23 women; mean age 39.77
years ±10.54, range 19-‐58 years). Two subgroups were then formed regarding the side of the epileptogenic focus, 27 right-‐sided and 30 left-‐sided patients.
Then, 26 patients with abnormal MRI findings that could explain the seizures but without MRI evidence of MTS formed the second group (11 men and 15 women; mean age 34.81 years ±10.58, range 25-‐65 years). This group essentially concerned patients with focal cortical dysplasia, the second most frequent aetiology in temporal lobe epilepsy, reason why we named
it the Dysplasia_group. These patients were also split in two subgroups, 14 right-‐sided and 12
left-‐sided ones.
Finally, 70 patients without any detected abnormalities in the clinical MRI were assigned to the
third group, the NoMRI_group (35 men and 35 women; mean age 36.87 years ±11.08, range 19-‐
63 years). 29 right-‐sided and 41 left-‐sided patients composed the last two sub-‐groups.
These three groups were also compared to the Control_group, composed of 120 healthy
subjects (57 men and 63 women, mean age 36.00 years ±9.93, range 17-‐60 years).
A summary of distinctive features such as mean age, mean age of epilepsy onset, mean disease duration and crisis frequency repartition of each group is detailed in the table below:
!"#$%&'&($)*)+"$&+,"-"+.%-)/.)+/&01&%"+,&2-034&
(0*.-0$52-034 6!752-034 89/4$"/)"52-034 :06;<52-034&
:3=#%-&01&/3#>%+./& '?@ AB ?C B@
:3=#%-&6%*DE0=%* AB&D&CF FG&D&?F ''&D&'A FA&D&FA
:3=#%-&;H/)I%IDJH/)I%I& ?B&D&F@& 'G&D&'? ?K&D&G'
6%"*&I)/%"/%&I3-".)0*L&&&&&&&&&&&&&&&&&&
9%"-/&M6%"*N78O ?GP'C&N&'FPGB ?@PKA&N&''PQ? 'GPK'&N&''PQ@
(-)/)/&1-%R3%*+9L&
E%%S$9D60*.,$9DT%"-$9&MUO 'BPAU&D&B@P?U&D&'?PFU FGPCU&D&ABPBU&D&BPBU ?QPCU&D&A@U&D&?'PGU&
6%"*&"2%&01&%4)$%4/9&0*/%.L&&&&&&&&&&&&&&&&&&&&&&&&&&&&&&&
9%"-/&M6%"*N78O 'APC'&N&'FPFA 'FPQC&N&'@PQK ?'PKC&N&'GPB@
6%"*&"2%L&&&&&&&&&&&&&&&&&&&&&&&&&&&&&&&&&&&&&&&&
2.2.
MRI acquisition
All MRI data was acquired on a 1.5T MRI scanner (Philips INTERA system, Philips Medical Systems, Best, Netherlands). 150 contiguous slices in a T1-‐weighted sequence were obtained as follows: TE / TR = 4.6ms / 30ms, flip angle of 30°, FOV = 250mm, matrix = 256x256, voxel size =
1x1x1mm.
2.3.
MRI preprocessing
Voxel-‐based morphometry is a computational anatomy method using the voxel wise spatial precision and allowing statistical analysis of the entire brain without the need to define a
specific region of interest. In this study, all MRI analyses were executed with the Statistical
Parametric Mapping software, version SPM8 (http://www.fil.ion.ucl.ac.uk/spm), running under
Matlab R2013a (MathWorks Inc., Sherborn, MA).
In order to allow statistical comparisons VBM necessitates the exact spatial match of all MRI data in a common stereotactic space. Here, all images are registered to the same template image. In other terms, all MRI images are laid on an identical coordinates’ system previously chosen, usually the montreal neurological institute (MNI) space. This step assures that the spatial localisation of given structure in one subject’s brain is corresponding to the same location in another subjects’. Two distinct steps are needed to perform this normalisation. The first step consists in matching the images with a template by estimating the optimum 12-‐parameter affine transformation. In order to accomplish that, a Bayesian framework allows to estimate a
maximum a posteriori spatial transformation from an a priori information of the normal brain
size variability (24). The second step considers the global nonlinear shape differences modelled by a linear combination of smooth spatial basis functions. The purpose of this nonlinear registration is to minimize the residual squared difference between the image and the template, and to maximize the smoothness of the deformations (24).
Previously, SPM used ca. 1000 coefficients to model accurately the shape of the brain. To perform an optimal inter-‐subject alignment, we used the DARTEL registration (diffeomorphic anatomical registration through exponentiated lie algebra), which includes more than 6’000’000
parameters per voxel (25).
The intertwined step parallel to spatial registration -‐ segmentation enables us to classify brain anatomy into three main tissue compartments -‐ grey matter, white matter and cerebro-‐spinal
fluid (CSF). This segmentation part is usually done with two distinct tasks (24). First, an a priori
probability map is used to encode information about the spatial distribution of different tissues in normal subjects. A mixture model cluster analysis allows to recognize voxel intensity
distribution of particular tissue types in a second time (24), suggesting that voxels are assigned
to a tissue class depending on their intensity. By studying these compartments independently, one obtains a straightforward interpretation of the underlying anatomical substrate without the risk of compromising results by noise from other tissue classes.
Because normalisation generates local volume compressions and expansions in order to match with the template (26), all grey matter and white matter values are multiplied by the Jacobian determinants, which restores the same voxel intensity as in the original image. This optional step is called “modulation” and allows the interpretation of statistical results as volume differences in a particular tissue. In that case, the absolute volume needs to be preserved by multiplying the spatially normalised tissue class with its relative volume before and after the spatial normalisation. Otherwise, results without any modulation would be interpreted as relative concentration differences of structures components between two groups of images(26).
MRI images are finally spatially smoothed such that the intensity of a voxel is changed by the weighted average of the surrounding voxels; the size of the region is then defined by the size of the smoothing kernel (27). This last step consists in convolving with an isotropic Gaussian Kernel, usually with a 12-‐mm FWHM kernel, to bring the data closer to the Gaussian field model (27). Smoothing also renders the data more normally distributed by the central limit theorem with a better validity of statistical tests as a consequence (24). This step finally reduces the variance between subjects and therefore increases the capacity to detect structural changes
across them (28).
Once all images were pre-‐processed, masks delimiting the grey or the white matter were applied to be sure to exclude all the voxels without any significant interest for our statistical analysis. Throughout this process, analyses tend to be more and more sensitive (29).
2.4.
MRI Statistical analysis
Based on the general linear model (GLM), the voxel-‐wise statistical analysis is essentially used for groups comparisons or to detect regions of altered grey matter or white matter volume that are related with some covariates characterizing the data (30).
This full factorial analysis integrated a total of six subgroups of patients (right and left-‐MTS, -‐Dysplasia and -‐noMRI) plus one control group in a one-‐designed matrix. Age, gender and trans-‐intracranial volume (TIV) were then added in this model as covariates. These three covariates enabled all groups to match together by minimising their influence on the volume’s differences. Finally, three other covariates were incorporated in the matrix: age of epilepsy onset, disease duration and seizures frequency.
Once the comparison tests performed, each result came in the form of a parametric map showing the location of the grey and white matter alterations, one group in regard to the other. All comparisons were done with a threshold at a P-‐value of <0.001 FWE corrected. Results were then superimposed on a T1-‐weighted template. Several atlases were used to specify the exact spatial location of altered brain regions: the Anatomical Automatic Labeling (AAL) for the grey matter (31), the JHU (Johns Hopkins University) white-‐matter tractography atlas and the SUIT toolbox for the cerebellum (32).
2.5.
Clinical features
Last part of our study consisted in analysing the clinical features between the three groups and the healthy volunteers. The statistical software Stata (version 12) was used to perform these
comparisons. Two-‐sample t test with equal variance were done with a significance level of
P<0.05 to analyse this data.
!" #$% "& '( )*+, -( .*+, -( )*/ 0' 1& 2' 32 ( .*/ 0' 1& 2' 32 ( )*4 "+)5 ( .*4 "+)5 ( !" #$% "& '( 6789 :9 #' 8$ ;()*+, -( 6789 :9 #' 8$ ;(. *+, -( 6789 :9 #' 8$ ;()*/ 0' 1& 2' 32 ( 6789 :9 #' 8$ ;(. */ 0' 1& 2' 32 ( 6789 :9 #' 8$ ;()*4 "+)5 ( 6789 :9 #' 8$ ;(. *4 "+)5 ( !" #$% "& '( <2$= ". 8# 7; ()*+, -( <2$= ". 8# 7; (. *+, -( <2$= ". 8# 7;( )*/ 0' 1& 2' 32 ( <2$= ". 8# 7;( .*/ 0' 1& 2' 32 ( <2$= ". 8# 7;( )*4 "+)5 ( <2$= ". 8# 7;( .*4 "+)5 (( !" #$% "& '(( !% 3'3'>% ;()*+, -( !% 3'3'>% ;(. *+, -( !% 3'3'>% ;()*/ 0' 1& 2' 32 ( !% 3'3'>% ;(. */ 0' 1& 2' 32 ( !% 3'3'>% ;()*4 "+)5 ( !% 3'3'>% ;(. *4 "+)5 ( 678( ?8# @8% ( ,5A (
3.
Results
3.1.
Grey matter analysis
In this study, we first compared the three groups of patients with TLE together, and with a group of healthy volunteers. These analyses were then repeated, but considering the distinction of seizure focus in the three groups of patients this time. Regions with significant reduced grey matter volume (GMV), with a threshold of P<0.001 corrected for multiple comparisons, are summarized in the table 2 below.
* Borderline results with P<0.06
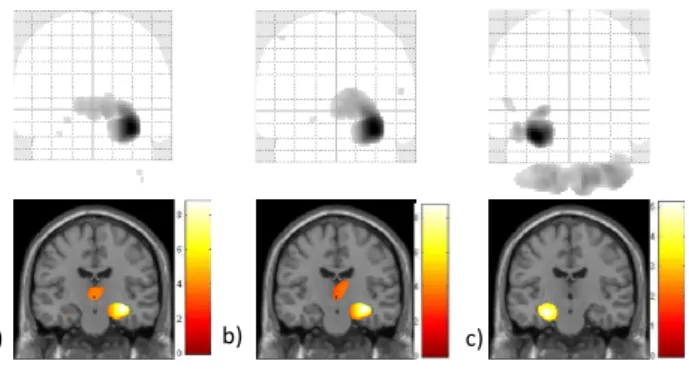
Figure 3 GMV reduction in MTS compared to healthy subjects: a) Right-‐sided and left-‐sided MTS together b) Right-‐sided MTS c) Left-‐sided MTS
!"# $"# %"#
!"#$%&'&(%)*+,-./&.0&12%3&4",,%2&5.$*6%&71458 9$$:;2.*<=&,%=,=&
>-?% @0A%:+.22 $.+",-./ B<=-CD./,2" >-)%) @0A%:+.22 ! EF=+.2% G H E D./,2.$&I&4!> JKLM NONNN P-<<.+"6<*=& (-;Q, NONNN ROMK B/0 S' F'N FL'
!Q"$"6*=& (-;Q, NONNN TORT TOJJ T FLL '
LMNL NONNM D%2%#%$$*6& U%0, NONVM KOKN KOSL FLN FML FJM
LKLJ NONLJ D%2%#%$$*6& (-;Q, NOSN' KONK SOVM '' FTJ FKS
D./,2.$&W&4!>& LTV NOM'N D"*)",% U%0, NONKT KOTL KOJL FLJ FS 'M D./,2.$&I&24!> TVRT NONNN P-<<.+"6<*=& B<=- (-;Q,& NONNN L'OT' B/0 SL FLR FLS !Q"$"6*=& B<=- (-;Q, NONNN MOLL TOMR LJ F'L R LMR NOMN' B/0%2-.2&,%6<.2"$&;32*=& B<=-& (-;Q,& NONJLX KOJR KOKR KJ N FSS D./,2.$&I&$4!> LNKN NONKS P-<<.+"6<*=& B<=- U%0, NONNK JO'' JONR F'M FLR FLR
LNSN NONKJ !Q"$"6*=& B<=- U%0, NONJM KOJJ KOKJ FT FLL S
KMT' NONNN D%2%#%$$*6& D./,2" (-;Q,& NONMN KOKV KOKN F'T FJT FTS D%2%#%$$*6& B<=-& U%0, NONM' KOKR KOSV 'M FT' FKS 24!>&I&$4!> LVJK NONNK @"2"Q-<<.+"6<"$&;32*= B<=- U%0, NONN' JOST JO'L F'' FSJ FS P-<<.+"6<*=& B<=- U%0, NONN' JOSK JOLV F'T FLR FLV MVV NONVL 4-))$%&,%6<.2"$&;32*= B<=- U%0, NONLT KORR KOMT FJM FSJ FM 24!>&W&$4!> J'TT NONNN P-<<.+"6<*= B<=- (-;Q, NONNN VOTV &&B/0 SL FLM FLJ !Q"$"6*=& B<=-& (-;Q,& NO'TR KONR KONL R FR LM 963;)"$"& B<=-& (-;Q,& NOMSS SOTS SOJR 'T V F'R Y3=<$"=-"&I&4!> 'STM NONNL P-<<.+"6<*=& (-;Q,& NONNN TOJT TO'V SL FLM FLJ 2Y3=<$"=-"&I&24!> STKN NONNN P-<<.+"6<*=& B<=- (-;Q, NONNN ROMJ &&B/0 SS FLM FLT Z.4(B&I&4!> KMKL NONNN P-<<.+"6<*= (-;Q, NONNN ROST MOR' SS FLM FLJ
!Q"$"6*= (-;Q,& NONVS KOKL KOS' LN F'V FL
2Z.4(B&I&24!> J'RK NONNN P-<<.+"6<*=& B<=- (-;Q, NONNN VOJR B/0 SL FLR FLJ !Q"$"6*=& B<=- (-;Q, NONJM KOJJ KOKJ LN FSN S $Z.4(B&I&$4!> 'LMM NONN' P-<<.+"6<*=& B<=- U%0, NONNN TOS' TONR F'T FLM F'L
@"2"Q-<<.+"6<"$&;32*= B<=- U%0, NO'TM KONR KONL F'' FSJ FL LNMKT NONNN D%2%#%$$*6&5BBB D./,2" (-;Q, NOLNK KOSR KO'V LK FK' FJJ D%2%#%$$*6&5BB D./,2" (-;Q, NOLKM KO'R KO'N S' FT' FKT D./,2.$&I&Y3=<$"=-" LNLL NONKM !Q"$"6*= (-;Q,& NO'KJ KOLL KONK R FLL T
!Q"$"6*=& U%0, NO'TR KONR KONL FS FL' R
D./,2.$&I&2Y3=<$"=-" LLLK NONSJ !Q"$"6*=& B<=-& (-;,Q& NOLLJ KOSJ KO'T R FLL R LLST NONSS >*<%2-.2&,%6<.2"$&;32*=& B<=- (-;Q,& NO'LR KOLJ KONR J' F'M LJ
B/=*$" B<=- (-;Q,& NOSLJ KONS SOVT KT FL' LJ
D./,2.$&I&Z.4(B& 'TR NOJSS B/0%2-.2&02./,"$&;32*=& U%0,& NONKM KOTN KOJN FKK 'K 'N D./,2.$&W&Z.4(B LNSR NONKK P-<<.+"6<*=& U%0, NONVN KOK' KOSS F'' F' FLT D./,2.$&I&$Z.4(B VV' NONJN >*<%2-.2&6.,.2&"2%" B<=- U%0,& NOKTT SORM SORL FLJ FT M' D./,2.$&W&$Z.4(B& TMMR NONNN P-<<.+"6<*=& B<=- U%0, NONN' JOKS JO'M F'L FS FLJ P-<<.+"6<*=& D./,2" (-;Q,& NONRV KOK' KOSK '' N FLJ 4"66-$$"23&#.)-%= D./,2" (-;Q, NOLJV KO'J KOLM K K FLS D$*=,%2 9/",.6-+"$&$.+",-./ 5.[%$&\-=% 4ZB&+..2)-/",%=&766&66&668&
A significant GMV reduction was found in the right hippocampal formation and parahippocampal gyrus when the MTS_group was compared to the three other groups (Fig. 3a-‐ 4a-‐5a). When the threshold was extended to a P<0.05 corrected, GMV in the left hippocampus was also decreased in the MTS_group in all the three comparisons. This was the unique region observed with a significant grey matter volume reduction between patients with MTS and patients with FCD (Fig. 4) whereas a reduction in the bilateral thalamus was also detected in MTS when compared to the Control_group or the NoMRI_group. Finally, cerebellum was also decreased in the MTS_group related to the Control_group (Fig. 3-‐5).
Each patients’ group was then separated in two subgroups regarding the side of seizure focus. When comparing patients with diagnosis of right MTS to the Control_group or the right NoMRI subroup, a GMV reduction was detected in the ipsilateral hippocampal formation and thalamus (Fig. 3b–5b), whereas only the ipsilateral hippocampus was decreased in comparison with the right Dysplasia_subroup (Fig. 4b).
When the left-‐sided subgroups were considered, significant regions of the bilateral cerebellum were also reduced in addition with the ipsilateral hippocampal formation in patients with MTS compared to the Control_group and the left NoMRI subgroup (Fig. 3c-‐5c). Finally, a significant reduction of the ipsilateral thalamus was also identified in the left MTS_subroup in comparison with the group of volunteers (Fig. 3c). The comparison between patients with left-‐sided
dysplasia and with left-‐sided MTS showed no significant differences.
!"# $"# %"#
Figure 5 GMV reduction in MTS compared to the NoMRI_group: a) Right-‐sided and left-‐sided subgroups together b) Right-‐sided subgroups only c) Left-‐sided subgroups only
!"# $"#
Figure 4 GMV reduction in MTS compared to the Dysplasia_group: a) Right-‐sided and left-‐sided subgroups together b) Right-‐sided subgroups only
When the two MTS_subgroups were compared together, a GMV reduction in the ipsilateral hippocampal formation and the thalamus was found in the right-‐sided MTS_subgroup. GMV reduction was also detected in the ipsilateral hippocampal and extra-‐hippocampal temporal regions in patients with left MTS.
When patients with FCD were compared to the Control_group, a significant GMV reduction was discovered in the bilateral thalamus. This same location was affected ipsilaterally when right-‐ sided subgroup was taken into consideration (Fig. 6). Extra-‐hippocampal regions of the temporal lobe (i.e superior temporal gyrus and insula) were also reduced in this comparison.
Control_group had also a small region of significant GMV increase in the left frontal lobe (i.e the left inferior frontal gyrus) in comparison with the NoMRI_group. Finally, no significant GMV alterations were detected when the Dysplasia_group and the NoMRI_group were compared together.
Only few regions of significant increased GMV were detected in patients’ groups in comparison with the Control_group. The left medial caudate nucleus was increased in the MTS_group in regards to the Control_group. When the latter was compared to the NoMRI_group this time, GMV was significantly augmented in the left hippocampus in the patients’ group. This location was also bilaterally increased when only the left-‐sided patients were taken into account (Fig 7).
3.2.
White matter analysis
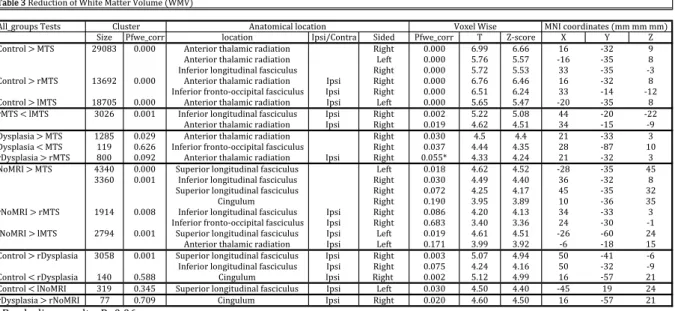
This second part of the study considered the white matter volume (WMV) differences in between patients with temporal lobe epilepsy and the healthy subjects. To that end, same analyses as in chapter 3.1 were repeated, the only difference being that the white matter was taken into account this time. All significant results are summarised in the table 3 below.
!"# $"#
Figure 6 GMV reduction in the Dysplasia_group compared to the healthy volunteers: a) Right-‐sided and left-‐ sided subgroups together b) Right-‐sided subgroup only
!"# $"#
Figure 7 GMV increase in the NoMRI_group compared to the healthy volunteers: a) Right-‐sided and left-‐sided subgroups together b) Left-‐sided subgroup only
!"# $"# %"#
Figure 8 WMV reduction in MTS compared to healthy subjects: a) Right-‐sided and left-‐sided MTS together b) Right-‐ sided MTS c) Left-‐sided MTS
* Borderline results: P<0.06
White matter tracts in patients with MTS were mostly altered in the region of the temporal lobe in comparison with the three other groups (Fig. 8-‐9-‐10). When the MTS_group was compared to the Control_ or the Dysplasia_groups, a significant WMV reduction was discovered in the anterior thalamic radiations, bilaterally for the first comparison and only localised in the right side for the second one (Fig 8a-‐9a). This white matter tract was decreased ipsilaterally when the right-‐ and left-‐sided MTS_subgroups were compared to the Control_group and when only the right-‐sided subgroups with MTS and Dysplasia were analysed together (Fig 8a-‐8b-‐9b). WMV was also reduced in a portion of the right inferior longitudinal fasciculus when the MTS_group was compared to the Control_group, whereas WMV would rather be reduced in the ipsilateral inferior fronto-‐occipital fasciculus in the right-‐sided subgroup of patients with MTS.
In the comparison between the NoMRI_group and the MTS_group, more widespread regions of reduced WMV were detected in patients with MTS involving the parietal and the temporal lobes (bilateral superior longitudinal fasciculi, right inferior longitudinal fasciculus and right cingulum). Both regions were similarly altered ipsilaterally whether the right side or the left side was taken into consideration (Fig. 10).
Figure 9 WMV reduction in MTS compared to the Dysplasia_group: a) Right-‐sided and left-‐sided subgroups together b) Right-‐sided subgroups only
!"# $"#
!""#$%&'()*+,)-)
./0, 123,#4&%% "&45-/&6 7()/89&6-%5 ./:,: 123,#4&%% + ;<)4&%, = > ; 9&6-%&"*?*@+. ABCDE CFCCC !6-,%/&%*-G5"5H/4*%5:/5-/&6 I/$G- CFCCC JFBB JFJJ KJ <EA B
!6-,%/&%*-G5"5H/4*%5:/5-/&6 L,2- CFCCC MFNJ MFMN <KJ <EM D
762,%/&%*"&6$/-':/65"*25)4/4'"') I/$G- CFCCC MFNA MFME EE <EM <E 9&6-%&"*?*%@+. KEJBA CFCCC !6-,%/&%*-G5"5H/4*%5:/5-/&6 7()/ I/$G- CFCCC JFNJ JFOJ KJ <EA D 762,%/&%*2%&6-&<&44/(/-5"*25)4/4'"') 7()/* I/$G- CFCCC JFMK JFAO EE <KO <KA 9&6-%&"*?*"@+. KDNCM CFCCC !6-,%/&%*-G5"5H/4*%5:/5-/&6 7()/ L,2- CFCCC MFJM MFON <AC <EM D %@+.*P*"@+. ECAJ CFCCK 762,%/&%*"&6$/-':/65"*25)4/4'"') 7()/* I/$G- CFCCA MFAA MFCD OO <AC <AA
!6-,%/&%*-G5"5H/4*%5:/5-/&6 7()/* I/$G- CFCKB OFJA OFMK EO <KM <B
QR)("5)/5*?*@+. KADM CFCAB !6-,%/&%*-G5"5H/4*%5:/5-/&6 I/$G- CFCEC OFM OFO AK <EE E
QR)("5)/5*P*@+. KKB CFJAJ 762,%/&%*2%&6-&<&44/(/-5"*25)4/4'"') I/$G- CFCEN OFOO OFEM AD <DN KC %QR)("5)/5*?*%@+. DCC CFCBA !6-,%/&%*-G5"5H/4*%5:/5-/&6 7()/* I/$G- CFCMMS OFEE OFAO AK <EA E T&@I7*?*@+. OEOC CFCCC .'(,%/&%*"&6$/-':/65"*25)4/4'"') L,2- CFCKD OFJA OFMA <AD <EM OM
EEJC CFCCK 762,%/&%*"&6$/-':/65"*25)4/4'"') I/$G- CFCEC OFOB OFOC EJ <EA D .'(,%/&%*"&6$/-':/65"*25)4/4'"') I/$G- CFCNA OFAM OFKN OM <EM EA
9/6$'"'H* I/$G- CFKBC EFBM EFDB KC <EJ EM
%T&@I7*?*%@+. KBKO CFCCD 762,%/&%*"&6$/-':/65"*25)4/4'"') 7()/ I/$G- CFCDJ OFAC OFKE EO <EE E 762,%/&%*2%&6-&<&44/(/-5"*25)4/4'"') 7()/ I/$G- CFJDE EFOC EFEJ AO <EC <K "T&@I7*?*"@+. ANBO CFCCK .'(,%/&%*"&6$/-':/65"*25)4/4'"') 7()/ L,2- CFCKB OFJK OFMK <AJ <JC AO !6-,%/&%*-G5"5H/4*%5:/5-/&6 7()/ L,2- CFKNK EFBB EFBA <J <KD KM 9&6-%&"*?*%QR)("5)/5 ECMD CFCCK .'(,%/&%*"&6$/-':/65"*25)4/4'"') 7()/* I/$G- CFCCE MFCN OFBO MC <OK <J 762,%/&%*"&6$/-':/65"*25)4/4'"') 7()/ I/$G- CFCNM OFAO OFKJ MC <EA <B
9&6-%&"*P*%QR)("5)/5 KOC CFMDD 9/6$'"'H 7()/* I/$G-* CFCCA MFKA OFBB KJ <MN AK
9&6-%&"*P*"T&@I7 EKB CFEOM .'(,%/&%*"&6$/-':/65"*25)4/4'"') 7()/ L,2- CFCEC OFMC OFOC <OM KB AO
%QR)("5)/5*?*%T&@I7 NN CFNCB 9/