Procedia Engineering 41 ( 2012 ) 1353 – 1359
1877-7058 © 2012 Published by Elsevier Ltd. doi: 10.1016/j.proeng.2012.07.321
International Symposium on Robotics and Intelligent Sensors 2012 (IRIS 2012)
A Comparative Study in Kernel-Based Support Vector Machine of Oil
Palm Leaves Nutrient Disease
H. Muhammad Asraf, M. T. Nooritawati, M.S.B. Shah Rizam
Electrical Engineering Dept. Universiti Teknologi MARA 40450 Shah Alam, Malaysia
Abstract
Investigation of the nutrient disease in oil palm motivates the need for a programmed detection system. Automated detection using vision system and pattern recognition are implemented to detect the symptoms of nutrient diseases and also to classify the disease group. In this paper, Support Vector Machine (SVM) is evaluated as classifier with three different kernels namely linear kernel, polynomial kernel with soft margin and polynomial kernel with hard margin. Initial results show that the recognition of oil palm leaves is possible to be performed by SVM classifier. Based on the best performance result, polynomial kernel with soft margin is capable of classifying nutrient diseases accurately in the oil palm leaves with accuracy of 95% of correct classification.
© 2012 The Authors. Published by Elsevier Ltd. Selection and/or peer-review under responsibility of the Centre of Humanoid Robots and Bio-Sensor (HuRoBs), Faculty of Mechanical Engineering, Universiti Teknologi MARA.
Keywords: oil palm ; image ; nutrient deficiencies ; support vector machine ; kernel;
1.Introduction
With advancement in agricultural sector, plant recognition researches for use in plantation management, disease control, etc have been widely recognized and rapidly developed. The recognition system plays an important role on plant disease control by means of observing the visual symptoms displayed by parts of the plant, such as stem, leaves, fruit, etc. As for oil palm trees, disease may be caused by nutrient imbalance such as nitrogen, potassium, phosphorus and magnesium. Each disease has its own predominant pattern which can be identified with the help of expert personnel. This paper deals with the nutrient disease of oil palm with symptoms visible on its leaves. Based on symptoms shown on the infected leaves, the type of disease can be recognized and classified by the proposed system in this paper.
Previous researches related to SVM have been performed for classification in leafminer-infected leaves, cucumber and grape disease, tobacco leaves and many more. However, classifying a nutrient disease in oil palm using SVM can be considered relatively new. Zhang Jian has proposed to implement SVM for recognizing cucumber leaf diseases (2010) by investigating spots on leaves surface [2,3]. His research implemented radial basis function polynomial and sigmoid kernel function as SVM classifiers. Next, Da-ke Wu, Chun-yan Xie et.al have used SVM related to Leafminer-infected leaves (2008) by radial basis kernel function and polynomial-based kernel function. These SVM classifiers are used as the indicator of degree in damage and fractal dimension for the diseased leaves [1]. In addition to these, Lu Bing,Sun Jun,Liu Hui et.al[4] have developed a SVM algorithm for classification in nitrogen-lacking of rice (2012) .The algorithms modeling have been designed by least square support vector library.
* Corresponding author. Tel.: +60355436063; fax: +60355435057.
E-mail address: [email protected]
Available online at www.sciencedirect.com
Open access under CC BY-NC-ND license. Open access under CC BY-NC-ND license.
Based on work done by others, vision technique recognition of infected leaves can be done and will reduce the needs of expert personnel. Hence, in this study, we investigate the potential of computer vision in recognition of nutrition disease namely nitrogen, potassium and magnesium of oil palm trees with SVM as classifiers.
The paper is organized as follows; Literature review related to support vector machine (SVM) is introduced in Section II. Section III discusses the material and methodology employed. Next, experimental results and discussions are presented in Section IV. Finally, conclusion is in Section V.
2.Literature Review
This section explains the details review related to kernels in SVM. Support vector machine (SVM) is one of classifiers developed to classify a pattern recognition problem. To solve the problem, it is formulated by optimization constraint problem via sets of mathematical equations. SVM objective is to find the hyperplane. The margin is then formed by optimal separation in hyperplane between classes of problem. The importance of optimal solution results to lower probability of misclassification when separating training examples accordingly. With a given dataset with N+M examples is partitioned into training set, S and testing set,S[9].
S ={( (x1,d1), (x2,d2), (x3,d3),…(xN, dN)} (1)
S {( , ),( , ),( , ), (x d1 1 x d2 2 x d3 3 }x dM, M)} (2) Kernels are used to map data into new space which takes the inner product of the new vectors. Generally, kernels function can be represented [6,9,10] by explicit functions such that K x x( , )1 2 M( ). ( )xi M xj or via Kernel trick function indirectly to represent any single function for example K x x( , ) ( .1 2 x x1 21) .P In kernel trick, SVM is used to search for hyperplane in the new feature space which is a linear function in the transformed feature space but a nonlinear function in the original input space [12]. In this paper, the comparisons between three different sets of Kernel trick function are examined in order to classify the infected leaves. They are defined as linear, polynomial (hard margin), polynomial (soft margin). Since SVM that uses explicit function for mapping the data in high dimensional space requires huge computational cost as compared to the kernel trick, kernel tricks are more preferred.
Linear Kernel function works for linearly separable data, while polynomial kernel function for both hard margin and soft margin are to deal with nonlinear separable patterns. Different Kernel function gives different optimal hyperplane.
Lagrange multiplier was obtained from function Q(α) during maximization and subject to constraint [6, 9, 10]. For linear
kernel, K x x( , )1 2 x x1T 2the generalized function and constraint conditions are shown as in equation 3 and equation 4 respectively [6, 9, 10]. 1 1 1 1 ( ) ( , ) 2 N N N i i j i j i i i j QD
¦
D¦¦
D Dd d K x x (3) 1 N i i i d D¦
and Dit0 (4) Meanwhile, generalized function and constraint for polynomial kernel (soft margin) ( , ) (1 2 1 2 1)T p
K x x x x are represented in
equation 5 and 6 [6, 9, 10]. Soft margin SVM allows misclassification data points but it maximizes the margin. 1 1 1 1 ( ) ( , ) 2 N N N i i j i j i i i j QD
¦
D¦¦
D D d d K x x (5) 1 N i i i d D¦
and 0dDidC (6)Polynomial kernel (hard margin) is given by ( , ) (1 2 1 2 1) .
T p
K x x x x . This type of kernel function does not allow for any
misclassification to occur and assume the data is linearly separable. The generalized function and constraint are given by [6, 9, 10] 1 1 1 1 ( ) ( , ) 2 N N N i i j i j i i i j QD
¦
D¦¦
D D d d K x x (7) 1 N i i i d D¦
and Dit0 (8)3.Material and Methodology
The oil palm leaves images are taken and preprocessed prior to classification according to respective diseases namely nitrogen, potassium and magnesium. Samples of leaves collected are approximately 420 samples. Out of that, 300 images are used as a training set with equal number for each disease consists of 100 nitrogen leaves, 100 magnesium leaves and 100 potassium leaves. The remaining 120 images are chosen as a testing set comprises of 40 images from nitrogen, potassium and magnesium leaves. All the images are captured at ambient environment at a fixed distance between leaves samples and digital imaging device. The flowchart of methodology is illustrated in Figure 1.
Figure 1: Methodology flowchart
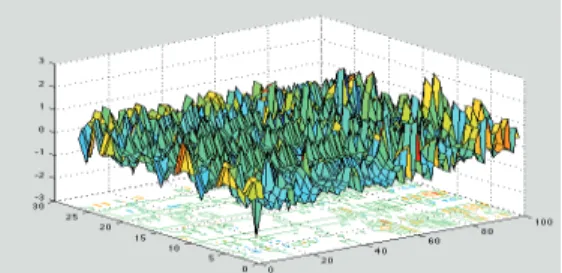
Figure 1 showed the flowchart of methodology which consists of pattern recognition and SVM classification. These images underwent several image processing steps before being classified by SVM. In pre-processing stage, the images are resized to 504x755 formats before applying a median filter [11]. This filter works to remove impulsive noise and outliers from the captured images [11].Next, features extraction is performed to select the desired features from the oil palm leaves images. The features include color, histogram-based texture features (based on RGB color) and gray level co-occurrence matrix. These features are divided into several sub-features as tabulated in Table 1. All these 27 features are used to train and perform classification by SVM classifier. Figure 2, 3 and 4 illustrated the graphical representation of all features extracted from leaves images after pre-processing. The leaves are collected from 100 images each for nutrient disease of potassium, magnesium and nitrogen. It can be seen from thethree diseases - the processed features can be differentiated. For example, magnesium possessed a pattern with fewer fluctuations than potassium, while nitrogen has distinguished pattern compared to the other two nutrients. These features are then advanced to next stage; classification.
Pre-processing Feature
Extraction
Classification (SVM) Result
Figure 3: Graphical representation of 27 features extraction of magnesium
Figure 2: Graphical representation of 27 features extraction of potassium
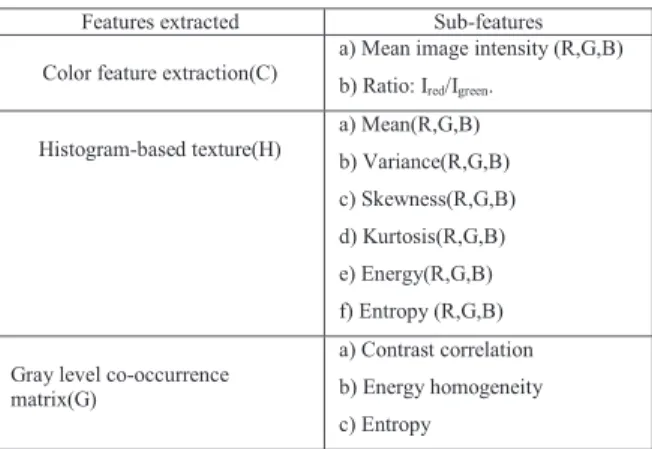
Table 1: Features extraction extracted from images Features extracted Sub-features Color feature extraction(C)
a) Mean image intensity (R,G,B) b) Ratio: Ired/Igreen.
Histogram-based texture(H) a) Mean(R,G,B) b) Variance(R,G,B) c) Skewness(R,G,B) d) Kurtosis(R,G,B) e) Energy(R,G,B) f) Entropy (R,G,B) Gray level co-occurrence
matrix(G)
a) Contrast correlation b) Energy homogeneity c) Entropy
After performing pre-processing and feature extraction, normalization is done to rescale the input vectors (pixels of images). As in our case, it has been designed to normalize the inputs to achieve means and standard deviation as one and
zero respectively (μ=0, σ=1). Subsequently followed by learning procedure to find an optimized hyperplane (w, b) which is formulated from Lagrange multiplier, αi.(refer to equation 4 and 5) .The resulting optimal hyperplane is given by [9]:
( ) T ( ) g x wMx b (9) w= 1 ( , ) N i i i j d K x x D
¦
(10) 1 1 ( ) T o b w x d M (11) Finally, classification of the disease leaves by SVM was performed by taking sign of the hyperplane as label, d to either 1,0 or -1 (refer to equation 12)d sgn sgn ( )g x (12)
4.Result and Discussion
The performance of SVM was evaluated as in Table 2-4. The best performance was achieved by polynomial kernel (soft
margin), 3
1 2 1 2
( , ) ( T 1)
K x x x x with p=3, C=0.1. As shown in Table 2, linear kernel results capable to correctly classify
96%,24%,89% of potassium, magnesium and nitrogen leaves during training phase. The remaining are misclassified potassium as 4% for magnesium. During testing phase, the linear kernel performance is the best in classifying phosphorus leaves by 100% without being misclassified. However it can only be used for phosphorus, and not magnesium nor nitrogen
leaves. This shows that the kernel is not well suited to classify all the nutrient disease of oil palm leaves due to the nonlinear separable data.
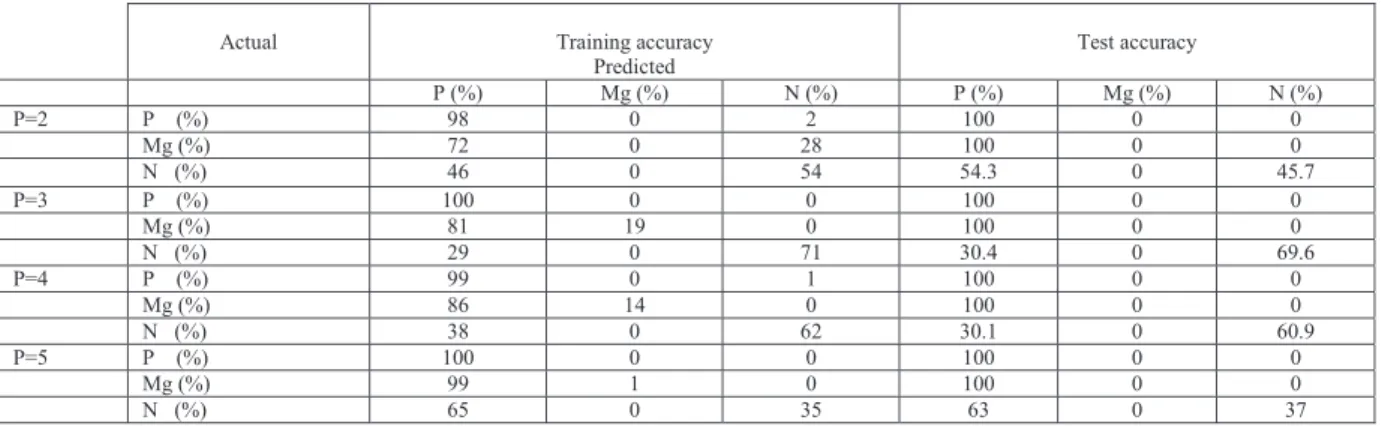
Table 3 illustrated the performance of accuracy that can be achieved by polynomial kernel (hard margin) when varying p value. At p=2, it has demonstrated accuracy in performance by 98%, 0% and 54% of potassium, magnesium and nitrogen leaves during training phase. For potassium leaves, the remaining 2% is not correctly classified as nitrogen. In testing phase, the test accuracy increased to 100%, 0% and 45.7% in correct classification respectively for potassium, magnesium and nitrogen leaves. Further increased in p value resulted an increased performance in accuracy. For example at p=3; polynomial kernel (hard margin), the percentage increased to 100%,19% and 71%, while during testing phase, the accuracy improved to 100%,0% and 69.6%.Conversely further increased in p value reduced the performance of kernel to perform classification task. Besides being similar to linear kernel, this type of kernel cannot perform a perfect classification task to classify magnesium diseased leaves and yet the performance percentage in Table 1 has demonstrated a much better performance as compared to Table 2.
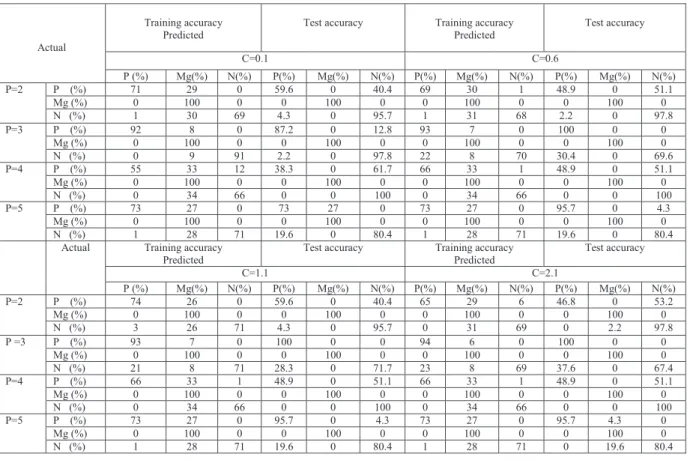
In addition to these two kernels implemented, polynomial kernel (soft margin) has shown the best performance in correctly classifying the nutrient diseases according to its classes. Table 4 has demonstrated value of C reflected the SVM performance. Notice the presence of pth and Cth order of polynomial made the classification accuracy slightly higher. This
has indeed indicated that performance can be further modified. At p=2 and C=0.1, the achievable percentage during training phase is 71%, 100% and 69% of potassium, magnesium and nitrogen leaves. Test accuracy yielded a performance of 59.6%, 100% and 95.7%. At an increased of C to 0.6 the test performance became 48.9%, 100% and 97.8%.The variation in p and C value affected the performance and kept changing. The best achievable performance is at 87.2%, 100% and 97.8% correspondingly to potassium, magnesium and nitrogen leaves when p=3 and C=0.1.
Therefore this shows that magnesium is not well trained for linear and polynomial (hard margin) kernels. However for polynomial (soft margin), the data is well trained and can be correctly classified according to types of diseases.
Table 2: Performance accuracy for Linear Kernel
Actual Training accuracy Predicted Test accuracy P (%) Mg (%) N (%) P (%) Mg (%) N (%) P (%) 96 4 0 100 0 0 Mg (%) 26 24 50 100 0 0 N (%) 0 11 89 76 24 0
Table 3: Performance accuracy for Polynomial Kernel (hard margin)
Actual Training accuracy
Predicted Test accuracy
P (%) Mg (%) N (%) P (%) Mg (%) N (%) P=2 P (%) 98 0 2 100 0 0 Mg (%) 72 0 28 100 0 0 N (%) 46 0 54 54.3 0 45.7 P=3 P (%) 100 0 0 100 0 0 Mg (%) 81 19 0 100 0 0 N (%) 29 0 71 30.4 0 69.6 P=4 P (%) 99 0 1 100 0 0 Mg (%) 86 14 0 100 0 0 N (%) 38 0 62 30.1 0 60.9 P=5 P (%) 100 0 0 100 0 0 Mg (%) 99 1 0 100 0 0 N (%) 65 0 35 63 0 37
Table 4: Performance accuracy for Polynomial Kernel (soft margin)
Actual
Training accuracy
Predicted Test accuracy Training accuracyPredicted Test accuracy
C=0.1 C=0.6 P (%) Mg(%) N(%) P(%) Mg(%) N(%) P(%) Mg(%) N(%) P(%) Mg(%) N(%) P=2 P (%) 71 29 0 59.6 0 40.4 69 30 1 48.9 0 51.1 Mg (%) 0 100 0 0 100 0 0 100 0 0 100 0 N (%) 1 30 69 4.3 0 95.7 1 31 68 2.2 0 97.8 P=3 P (%) 92 8 0 87.2 0 12.8 93 7 0 100 0 0 Mg (%) 0 100 0 0 100 0 0 100 0 0 100 0 N (%) 0 9 91 2.2 0 97.8 22 8 70 30.4 0 69.6 P=4 P (%) 55 33 12 38.3 0 61.7 66 33 1 48.9 0 51.1 Mg (%) 0 100 0 0 100 0 0 100 0 0 100 0 N (%) 0 34 66 0 0 100 0 34 66 0 0 100 P=5 P (%) 73 27 0 73 27 0 73 27 0 95.7 0 4.3 Mg (%) 0 100 0 0 100 0 0 100 0 0 100 0 N (%) 1 28 71 19.6 0 80.4 1 28 71 19.6 0 80.4
Actual Training accuracy Predicted
Test accuracy Training accuracy Predicted Test accuracy C=1.1 C=2.1 P (%) Mg(%) N(%) P(%) Mg(%) N(%) P(%) Mg(%) N(%) P(%) Mg(%) N(%) P=2 P (%) 74 26 0 59.6 0 40.4 65 29 6 46.8 0 53.2 Mg (%) 0 100 0 0 100 0 0 100 0 0 100 0 N (%) 3 26 71 4.3 0 95.7 0 31 69 0 2.2 97.8 P =3 P (%) 93 7 0 100 0 0 94 6 0 100 0 0 Mg (%) 0 100 0 0 100 0 0 100 0 0 100 0 N (%) 21 8 71 28.3 0 71.7 23 8 69 37.6 0 67.4 P=4 P (%) 66 33 1 48.9 0 51.1 66 33 1 48.9 0 51.1 Mg (%) 0 100 0 0 100 0 0 100 0 0 100 0 N (%) 0 34 66 0 0 100 0 34 66 0 0 100 P=5 P (%) 73 27 0 95.7 0 4.3 73 27 0 95.7 4.3 0 Mg (%) 0 100 0 0 100 0 0 100 0 0 100 0 N (%) 1 28 71 19.6 0 80.4 1 28 71 0 19.6 80.4 5.Conclusion
In conclusion, SVM classification performed its task successfully. The proposed classifiers have been tested on oil palm leaves samples. Three different types of kernel function namely linear, polynomial (hard margin) and polynomial (soft margin) are used to perform classification task. Polynomial kernel with soft margin produces the best performance in average of 95% correct classification as compared to the other types of Kernel function. This has verified the need for proper kernel trick function choice which would yield for more accurate results.
Acknowledgements
The authors would like to thank Universiti Teknologi MARA (UiTM). This project was supported by UiTM under the Excellence Fund Grant No: 600-RMI/ST/DANA 5/3/Dst (398/2011). Gratitude and appreciation to Malaysia Palm Oil Board
References
[1] Da-ke Wu; Chun-yan Xie; Cheng-wei Ma; , "The SVM classification leafminer-infected leaves based on fractal dimension," Cybernetics and Intelligent Systems, 2008 IEEE Conference on , vol., no., pp.147-151, 21-24 Sept. 2008 doi: 10.1109/ICCIS.2008.4670815
[2] Youwen, Tian; Tianlai, Li; Yan, Niu; , "The Recognition of Cucumber Disease Based on Image Processing and Support Vector Machine," Image and Signal Processing, 2008. CISP '08. Congress on , vol.2, no., pp.262-267, 27-30 May 2008 doi: 10.1109/CISP.2008.29
[3] Zhang Jian; Zhang Wei; , "Support vector machine for recognition of cucumber leaf diseases," Advanced Computer Control (ICACC), 2010 2nd International Conference on , vol.5, no., pp.264-266, 27-29 March 2010 doi: 10.1109/ICACC.2010.5487242
[4] Lu, Bing; Sun, Jun; Liu, Hui; Song, Caihui; Wu, Xiaohong; , "The Judgement on Lack of Nitrogen in Rice Based on SVM Algorithm," Computer Science and Electronics Engineering (ICCSEE), 2012 International Conference on , vol.2, no., pp.165-168, 23-25 March 2012 doi: 10.1109/ICCSEE.2012.426
[5] Machine Learning With Svm And Other Kernel Methods, Prentice-Hall Of India Pvt. Ltd. [6] Steinwart, I. and A. Christmann (2008). Support Vector Machines, Springer.
[7] Schölkopf, B., J. Platt, et al. (2007). Advances in Neural Information Processing Systems 19: Proceedings of the 2006 Conference, Mit Press. [8] Smola, A. J. (2000). Advances in Large Margin Classifiers, Mit Press.
[9] Cristianini, N. and J. Shawe-Taylor (2000). An Introduction to Support Vector Machines: And Other Kernel-Based Learning Methods, Cambridge University Press.
[10] Nakayama, H., Y. Yun, et al. (2009). Sequential Approximate Multiobjective Optimization Using Computational Intelligence, Springer.
[11] Hairuddin, M.A.; Tahir, N.M.; Baki, S.R.S.; , "Representation of Elaeis Guineensis nutrition deficiency based on image processing approach,"Computer Applications and Industrial Electronics (ICCAIE), 2011 IEEE International Conference on , vol., no., pp.607-611, 4-7 Dec. 2011 doi: 10.1109/ICCAIE.2011.6162206
[12] Burges, C.J.C.: A tutorial on support vector machines for pattern recognition. Data Mining and Knowledge Discovery 2, 121–167 (1998)
[13] Liqun Han; , "Recognition of the part of growth of flue-cured tobacco leaves based on support vector machine," Intelligent Control and Automation, 2008. WCICA 2008. 7th World Congress on , vol., no., pp.3624-3627, 25-27 June 2008 doi: 10.1109/WCICA.2008.4593502
[14] Zhang Qizhong; , "Gene Selection and Classification Using Non-linear Kernel Support Vector Machines Based on Gene Expression Data," Complex Medical Engineering, 2007. CME 2007. IEEE/ICME International Conference on , vol., no., pp.1606-1611, 23-27 May 2007 doi: 10.1109/ICCME.2007.4382018
[15] Lai, D.T.H.; Levinger, P.; Begg, R.K.; Gilleard, W.L.; Palaniswami, M.; , "Automatic Recognition of Gait Patterns Exhibiting Patellofemoral Pain Syndrome Using a Support Vector Machine Approach," Information Technology in Biomedicine, IEEE Transactions on , vol.13, no.5, pp.810-817, Sept. 2009 doi: 10.1109/TITB.2009.2022927
[16] Shijun Zhao; Xiaowei Hao; Xiaodong Li; , "Segmentation of Fingerprint Images Using Support Vector Machines," Intelligent Information Technology Application, 2008. IITA '08. Second International Symposium on , vol.2, no., pp.423-427, 20-22 Dec. 2008 doi: 10.1109/IITA.2008.323 [17] Chen Liao; Shutao Li; Zhiyuan Luo; , "Gene Selection for Cancer Classification using Wilcoxon Rank Sum Test and Support Vector Machine,"
Computational Intelligence and Security, 2006 International Conference on , vol.1, no., pp.368-373, Nov. 2006 doi: 10.1109/ICCIAS.2006.294156 [18] Costantini, G.; Casali, D.; Carota, M.; Saggio, G.; Bianchi, L.; Abbafati, M.; Quitadamo, L.; , "Mental task recognition based on SVM classification,"
Advances in sensors and Interfaces, 2009. IWASI 2009. 3rd International Workshop on , vol., no., pp.197-200, 25-26 June 2009 doi:10.1109/IWASI.2009.5184795
[19] Brudzewski, K., Osowski, S., Golembiecka, A. Differential electronic nose and support vector machine for fast recognition of tobacco(2012) Expert Systems with Applications, 39 (10), pp. 9886-9891.
[20] Jain, H., Chatterjee, A., Kumar, S., Raman, B.Recognizing human gestures using a novel SVM tree(2012) Proceedings of SPIE - The International Society for Optical Engineering, 8300, art. no. 83000M, Hu, Q., Tian, J., He, D. Plant leaf disease recognition based on PSO-SVM algorithm(2011) ICIC Express Letters, 5 (9 A), pp. 3183-3188.Cited 1 time.
[21] Zhang, J., Ji, R., Yuan, X., Li, H., Qi, L. Recognition of pest damage for cotton leaf based on RBF-SVM algorithm (2011) Nongye Jixie Xuebao/Transactions of the Chinese Society of Agricultural Machinery, 42 (8), pp. 178-183.
[22] Yu, Y., Yin, G., Du, L. Image classification for steel strip surface defects based on support vector machines (2011) Advanced Materials Research, 217-218, pp. 336-340.
[23] Prasad, S., Kudiri, K.M., Tripathi, R.C. Relative sub-image based features for leaf recognition using support vector machine (2011) ACM International Conference Proceeding Series, pp. 343-346.