IN-DEPTH ANALYSIS OF TEXAS ACCIDENTS USING DATA-MINING TECHNIQUES AND GEO-STATISTICAL ANALYST TOOLS
A Thesis
Submitted to the Graduate Faculty of the
North Dakota State University of Agriculture and Applied Science
By Faiz ul Islam
In Partial Fulfillment of the Requirements for the Degree of
MASTER OF SCIENCE
Major Department:
Construction Management and Engineering
March 2018
North Dakota State University
Graduate School
Title
In-Depth Analysis of Texas State Accidents’ Dataset Using Data-Mining Techniques and Geostatistical Analyst Tools
By Faiz ul Islam
The Supervisory Committee certifies that this disquisition complies with North Dakota State University’s regulations and meets the accepted
standards for the degree of
MASTER OF SCIENCE SUPERVISORY COMMITTEE: Dr. Eric Asa Chair Dr. Matthew Stone Dr. Stephanie Day Approved:
April 6th, 2018 Dr. Jerry Gao
iii ABSTRACT
Traffic accidents have been a consistently growing problem in the United States. The road-safety issues have not been completely resolved and pose danger to people driving on the roadways. This research used various approaches and techniques to evaluate and analyze the Texas State traffic-accident dataset profoundly and meticulously. Data-mining techniques were used to analyze the accident dataset for Texas statistically, and information were collected. The resulting information from the analysis suggested that the city of Houston, Texas, was the point of persistent accidents and accounted for most accidents in all Texas cities. Therefore, Houston was analyzed further by using the geostatistical and geo-analyst tools in ArcGIS. The
Geostatistical Analysis tools including Space-Time identified the key hotspot locations within the city to study the overall behavior, and developed prediction maps from the kriging tool. A similar approach can apply to other parts of Texas and any location in the United States.
iv
ACKNOWLEDGEMENTS
I would like to give my thanks to Dr. Eric Asa, my adviser, for his genuine support and effort in reshaping my thoughts and for his help with working towards my thesis. My special thanks and love go to my parents and siblings for all their prayers, motivations, and continuous mental and financial support to achieve my goals and dreams. My thanks go to my committee members, Dr. Matthew Stone and Dr. Stephanie Day, for helping and providing timely guidance whenever I needed it. I thank Ingrid Scarski and Ann Denny for listening and resolving some of the major issues in the department and always standing up for all the international students and me. I am grateful to the faculty of the Department of Construction Engineering and Management and NDSU for giving me the honor and opportunity to complete my graduate degree at a
prestigious institution. I am very thankful to all my friends who always stood behind me and cheered me up during any hardship. Finally, I am grateful to anyone who helped me to complete the degree with ease.
v TABLE OF CONTENTS ABSTRACT ... iii ACKNOWLEDGEMENTS ... iv LIST OF TABLES ... ix LIST OF FIGURES ... xi 1. INTRODUCTION ... 1 1.1. Background ... 1 1.2. Problem Statement ... 2 1.3. Research Questions ... 3
1.4. Aims & Objectives ... 4
1.5. Research Methodology ... 4
2. LITERATURE REVIEW ... 6
2.1. Introduction ... 6
2.2. Analysis of Traffic Accident and Safety ... 9
2.3. Tools to Improve Road Safety & Evade Accidents ... 11
2.4. The Empirical Bayesian (EB) vs. Full Bayesian (FB) Method and their Application on Traffic-Accidents’ Data ... 13
2.5. Geographic Information System (GIS): An Effective tool for Traffic Data ... 15
2.6. An Overview on Traffic Accident Factors ... 16
2.7. Road Accident Factors ... 17
2.7.1. Age and Gender ... 17
2.7.2. Construction Zones ... 18
2.7.3. Freeways and Vehicle Type ... 18
2.7.4. People's Carelessness ... 19
2.7.5. Weather Conditions ... 19
vi
2.7.7. Technology ... 21
2.7.8. Intersections ... 21
2.7.9. Planning and Design ... 22
2.7.10. Pedestrians ... 23
2.8. Conclusion ... 24
3. EXPLORATORY DATA ANALYSIS ... 25
3.1. Introduction ... 25
3.2. Data Acquisition ... 25
3.3. Accident Trends, 2010-2016 ... 26
3.3.1. Annual Fatalities, Injuries, and Deaths, 2010-2016 ... 28
3.3.2. Analysis by Region and Location Type ... 31
3.3.3. Analysis by Population Group ... 36
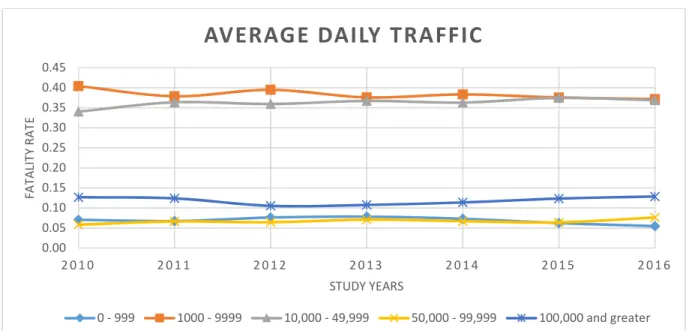
3.3.4. Using the Average Daily Traffic to Analyze the Accident Parameters ... 48
3.4. Intersections ... 51
3.4.1. Intersection Analysis by Population Group ... 54
3.4.2. Intersection Analysis by Average Daily Traffic (ADT) ... 60
3.5. Pictorial Representation of the Accident Database, 2010–2016 ... 63
3.6. Conclusion ... 66
4. GEO-STATISTICAL ANALYSIS ... 67
4.1. Introduction ... 67
4.2. Accident-Detection Count from the City Centroid at 1-Mile Intervals ... 68
4.2.1 Introduction ... 68
4.2.2. Procedure ... 68
4.2.3. Results ... 68
vii
4.3.1 Introduction ... 76
4.3.2. Procedure ... 76
4.3.3. Results ... 78
4.4. Optimized Hotspot Analysis ... 83
4.4.1 Introduction ... 83
4.4.2. Procedure ... 83
4.4.3. Results ... 84
4.5. Space-Time Pattern Mining ... 90
4.5.1 Introduction ... 90
4.5.1.1. Create Space-Time Cube ... 91
4.5.1.2. Emerging Hotspot Analysis ... 92
4.5.1.3. Local Outlier Analysis Tool ... 94
4.5.2. Procedure ... 95
4.5.3. Results ... 99
4.5.3.1. Create Space-Time Cube ... 99
4.5.3.2. Emerging Hotspot Analysis ... 99
4.5.3.3. Local-Outlier Analysis ... 102 4.6. Kriging Analysis ... 105 4.6.1. Indicator Kriging ... 105 4.6.1.1. Introduction ... 105 4.6.1.2. Procedure ... 107 4.6.1.3. Results ... 109
4.6.2. Empirical Bayesian Kriging ... 119
4.6.2.1. Introduction ... 119
viii
4.6.2.3. Results ... 122
5. CONCLUSION & RECOMMENDATION ... 128
5.1. Conclusion ... 128
5.2. Recommendation ... 130
ix
LIST OF TABLES
Table Page
3.1. Example Dataset of Accidents from the Texas DOT ……….…….………...… 26
3.2. Percentage Increase for Traffic Accidents, 2010-2016...…27
3.3. Traffic Accidents, Deaths, and Injuries, Counted by Counties with the Highest Number…. 32 3.4. Traffic Accidents, Deaths, and Injuries by City (Descending Order) ……...…... 35
3.5. Accident Parameters for Injuries in the Rural Population Group …………..………..41
3.6. Accident Parameters for Fatalities in the Rural Population Group …………...………...43
3.7. Accident Parameters for Injuries in the Urban (250,000+) Population Group ……….45
3.8. Accident Parameters for Fatalities in the Urban (250,000+) Population Group ……….47
3.9. Ratios for Accidents, Injuries, Fatalities, and Deaths, 2010-2016.………...…………52
3.10. Casualty Count and Year-to-Year Growth at Intersections by Month and Year (2010- 2016).……...……...………...….………...53
3.11. Intersection Accidents’ Fatality Parameters for the Rural Population Group.………57
3.12. Intersection Accidents’ Injury Parameters for the Urban (250,000+) Population Group.….59 3.13. Crash Injury Rate by Average Daily Traffic Category Ranges.……….…………62
3.14. Injury Fatality Rate by Average Daily Traffic Category Ranges ….……….62
4.1. Statistical Values for the Kernel-Density Maps.……….82
4.2. Z-Score Statistical Values for Each Year’s Accident Dataset from the Optimized Hotspot Analysis Maps.………...……….………...……....89
4.3. P-Score Statistical Values for Each Year’s Accident Dataset from the Optimized Hotspot Analysis Maps.……….………...………...…………...………....90
4.4. Results for Hot and Cold Spots by Accident-Data Category, 2010-2016…….….………....100
4.5. Highest Values for the Local-Outlier Analysis Parameters at Various Time Intervals...……102
4.6. Number and Percentage of Locations by Local-Outlier Analysis Parameters...……….103
x
4.8. Indicator Kriging Characteristic Values of the Semi-variogram Models for Each Year’s Accident Dataset....………..…...………...………..…………...112 4.9. Comparison Parameters for Each Year’s Semi-Variogram Models.…….………...….…….115 4.10. Statistical Values for the Resulting Empirical Bayesian Maps……….…………...123
xi
LIST OF FIGURES
Figure Page
1.1. Research Methodology Flowchart ………...………….……... 5
3.1. Trend for Annual Traffic Accidents in Texas, 2010-2016……...…...27
3.2. Annual Traffic Accident Fatalities and Deaths in Texas from 2010-2016……….…...28
3.3. Texas’ Annual Count for Traffic Injuries, 2010-2016…….……….……...29
3.4. Percentage Difference for Injuries by Year, 2010-2016………...………....29
3.5. Various Ratios for Traffic Accidents, Injuries, Deaths, and Fatalities,2010-2016………….30
3.6. Ratios for the Counties’ Accidents, Deaths, and Injuries, 2010-2016…..………32
3.7. Ratios for the Cities Accidents, Deaths, and Injuries, 2010-2016………....34
3.8. Traffic Death Rate in Texas by Population Group ………...………37
3.9. Traffic Fatality Rate in Texas by Population Group ……….………...37
3.10. Traffic Injury Rate in Texas by Population Group ………...38
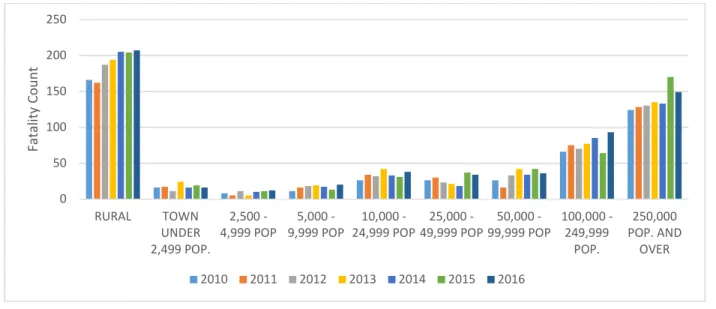
3.11. Road Accidents’ Death Count by Population Group (2010-2016) ………..…….39
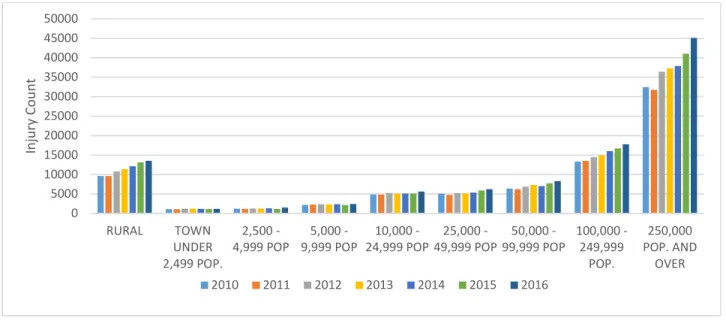
3.12. Road Accidents’ Total Injury Count by Population Group (2010-2016).………..……...….39
3.13. Traffic-Accident Fatality Rate by Average Daily Traffic (ADT) Category …………...49
3.14. Comparison of the Yearly Traffic-Accident Fatality Rate by the Average Daily Traffic (ADT) Ranges.………...………...….….………...…………49
3.15. Traffic-Accident Injury Rate by Average Daily Traffic (ADT) Category ……….50
3.16. Comparison of the Yearly Traffic-Accident Injury Rate for Various Average Daily Traffic (ADT) Ranges.…………...………...51
3.17. Each Year’s Traffic-Accident Injury Count, by Population Groups, at Intersections.…...…55
3.18. Each Year’s Traffic-Accident Fatality Count, by Population Groups, at Intersections.…....56
3.19. Traffic-Intersection Accident Counts by ADT Category Ranges ………...………...60
3.20. Traffic-Intersection Injury Counts by ADT Category Ranges ………...…………. ….61
xii
3.22. Pictorial Representation of Texas’ Accident Counts Using ArcGIS, 2010-2016………….64
3.23. Pictorial Representation of Texas’ Accident Counts, by County, Using ArcGIS, 2010- 2016……….………..………65
4.1. Maps for Houston’s Accident Counts (20-Mile Radius) at 1-Mile Intervals, 2010-2016…….69
4.2. Houston’s Accident Counts (20-Mile Radius at 1-Mile Intervals), 2010-2016………73
4.3. Framework for the Kernel-Density Tool in ArcGIS.……….….77
4.4. Houston’s Kernel-Density Analysis Maps, 2010-2016……….………..78
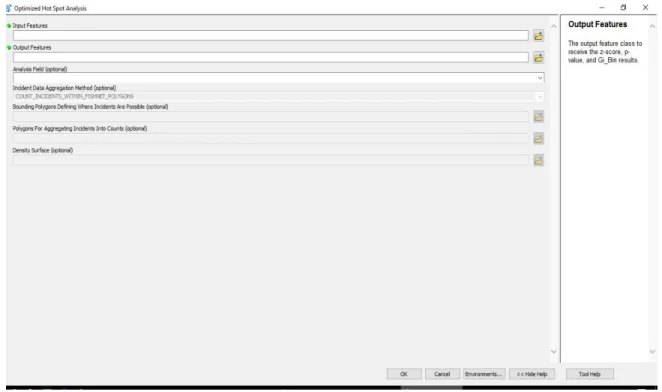
4.5. Framework for the Optimized Hotspot Analysis Tool in ArcGIS.………...84
4.6. Houston’s Optimized Hotspot-Analysis Maps, 2010-2016.……… ………...85
4.7. Symbolic Representation of the Space-Time Cube Model in ArcGIS.………...…….……....91
4.8. Symbolic Representation of the Emerging Hotspot-Analysis Model in ArcGIS.…………....92
4.9. Symbolic Representation of the Local-Outlier Analysis Tool Cube in ArcGIS.……….95
4.10. Framework of the Create Space-Time Cube Tool in ArcGIS.……….………….96
4.11. Framework for the Emerging Hotspot-Analysis Tool in ArcGIS.………..97
4.12. Framework for the Local-Outlier Analysis Tool in ArcGIS.………..98
4.13. Graphical Representation for the Hot and Cold Spots by Accident-Data Category.……….101
4.14. Output Map of the Emerging Hotspot-Analysis Tool.……….102
4.15. Output Map for the Local-Outlier Analysis Tool.………104
4.16. Graphical Explanation of the Semi-Variogram Characteristics.………….……….106
4.17. Framework for the Semi-Variogram/Covariance Modeling in the Geostatistical Analysis……….………...………...108
4.18. Semi-Variogram Model for Houston’s 2010 Accident Dataset...………109
4.19. Semi-Variogram Model for Houston’s 2011 Accident Dataset.……….……….…109
4.20. Semi-Variogram Model for Houston’s 2012 Accident Dataset.…….………110
4.21. Semi-Variogram Model for Houston’s 2013 Accident Dataset.………….………110
xiii
4.23. Semi-Variogram Model for Houston’s 2015 Accident Dataset...………111 4.24. Semi-Variogram Model for Houston’s 2016 Accident Dataset.………….………111 4.25. Indicator Prediction Graphs for Accident-Point Data (2010-2016).………. ……….112 4.26. Result Maps from Indicator Kriging with Houston’s Traffic-Accident Data, 2010-2016…116 4.27. Input Parameters for the Empirical Bayesian Kriging Model.……….………122 4.28. Maps that Result from Using the Empirical Bayesian Tool in ArcGIS.……….…….124
1
1. INTRODUCTION 1.1. Background
The United States has one of the largest roadway infrastructures in the world; this system is constructed with modern technological tools and techniques. The roadway infrastructure accommodates billions of vehicles per year, and numbers are on the upsurge. According to online statistics, about 261.8 million vehicles, including cars and light trucks, were registered in 2016. With the advancement of the roadway system and vehicles, it is predictable that the risks for roadway traffic safety have been amplified severely over time, which is reflected with the statistical facts issued by the Fatality Analysis Reporting System (FARS). According to FARS, about 6.2 million crashes were reported to the police in 2015. In assessing the previous year, road crashes increased by 3.8 percent from the last year. Of the total crashes in 2015, 35,092 people died, and 2.44 million people were injured. Similar to the crashes in 2015, fatalities and injuries also increased. In 2015, 96 people died daily from U.S. traffic accidents, up from 90 people per day during 2014.
The accident statistics from the National Highway Traffic Safety Administration (NHTSA, 2016) website stated that almost 32,675 fatalities were reported in the United States during 2014. Of those 32,675 deaths, around 10.8% of the fatal accidents were in Texas, the highest percentage for any U.S. state. Comparing with the previous year’s fatalities, the positive percentage change of 4% was relatively significant. However, most states indicated a significant percentage decline for fatal accidents in 2014 than in 2013. From all the fatal crashes in Texas in 2014, there were 3,538 people killed. Knowing that Texas is the second-largest U.S. state by population, the statistical figures are still significant when equated with all other U.S. states.
2
The U.S. Department of Transportation (USDOT) is estimated to have a budget of $98.1 billion for fiscal year 2017. According to the USDOT website, the transportation budget is targeted to support and to complete infrastructure projects; to rehabilitate roads, bridges, transit systems, railways, and the aviation system; to make safety improvements; and to perfect the overall budget’s spending practices. By observing the statistical facts and figures, the goal to improve and to enhance roadway safety still needs to be accomplished. There is also a need to invest the budget in the core, identified issues for transportation safety which can be verified with the FARS and NHTSA’s annual reports.
1.2. Problem Statement
Traffic accidents pose a great concern and threat to road safety. This anxiety is
heightened in the United States where roughly 17,000 traffic accidents took place daily in 2015. With such a high number of accidents, 96 people died every day. Knowing the traffic accidents’ severity and importance, the U.S. Department of Transportation is projected to spend about $98.1 billion in fiscal year 2017 in order to improve the overall transportation system; this figure also includes money to enhance and ameliorate the safety. Despite spending nearly $94.7 billion on the transportation budget in 2016, safety issues and problems still exist. Traffic accidents have displayed a positive trend for a decade, and it is expected that the trend would continue.
Moreover, the traffic accidents’ consequences are long-lasting and could easily take lives. Many people die from the accidents yearly, and if the accident does not result in death, injuries may cause a person to live a handicapped life. Researchers have developed various techniques and tools for road safety with in-depth study about the foremost reasons for the accidents. The responsible authorities have succeeded in adopting and implementing these methods and practices for their transportation systems, but these officials are not able to control the U.S.
3
traffic-safety hazards. Therefore, there is a necessity to present transportation authorities with novel techniques so that understanding the main problems and realistic models can serve as a source to counter the traffic-safety threats.
1.3. Research Questions
The research is intended to address the following questions: i. What is the trend for traffic accidents in the state of Texas?
ii. How has the trend changed statistically through time at the Texas state?
iii. In comparison to total number of accidents, what is the rate of injuries and deaths for each year?
iv. What regions or locations account for the record number of accidents?
v. What percentage of accidents have occurred at intersections? Also, identify the factors that contributed to these accidents.
vi. Does the urban and rural population have any effect on the accidents? vii. What factors have caused the accidents to take place by population group?
viii. Does the average daily traffic have any influence on the accidents? If yes, what are the factors that have caused numerous accidents to happen?
ix. Do the accident data provide a more holistic picture when they are analyzed visually by geographical representation?
x. What geostatistical analysis tools are appropriate to identify the hotspot locations for accident-count data for a defined region?
xi. What kriging methods can be implemented on the accident-count data for a significant outcome from the hit-and-trial method?
4 1.4. Aims and Objectives
The study’s goals are as follows:
i. Review the literature to identify what has been done and what needs to be studied on road accidents, specifically in Texas.
ii. Display the trend, statistically, for road accidents, injuries, and deaths in Texas. iii. Identify the accident factors that have a severe effect on road accidents.
iv. Investigate the intersections to detect the major causes of road accidents. v. Create maps to represent the accidents for each year.
vi. Develop geostatistical hotspot maps for each year’s accident data to graphically represent the accident growth.
vii. Establish a prediction map for a specific region that would be applicable to the overall state.
1.5. Research Methodology
Figure 1.1 provides the steps performed for this research. The research activities were conducted in a sequential manner. The processes used for the data analysis, such as data mining and geostatistical analysis, are also labeled in detail and in systematic order in Figure 1.1.
5 Figure 1.1. Research Methodology Flowchart.
6
2. LITERATURE REVIEW 2.1. Introduction
Traffic accidents are a global phenomenon and cause severe concerns about the safety of individuals and government property. In Japan, there has been a report of 800,000 road accidents annually (Matsuzaki, Nitta, & Kato, 2008). With the expanding socio-economic growth around the world and an emphasis on building infrastructures, especially in developing countries and with population growth, there has been a notifiable increase in road-traffic coincidences with the yearly upsurge in traffic volume. According to the World Health Organization (2004), road accidents are the source of 1.2 million worldwide deaths annually (Peden et al., 2004). Millions have suffered from death-defying injuries with some permanent disabilities. In Europe, about 40,000 people die from road fatalities on a yearly basis (Shen et al., 2008). Moreover, the accidents are increasing drastically every year with significant numbers in Europe. With this much chaos on the roads and the uncertainty about traffic protocols and procedures, high responsibilities have been put on the law-enforcement agencies as well as the transportation department to lessen the incidents that are growing at a rapid pace. The facts and numbers show the obvious need to improve the system for the sake of humanity and the socio-economic development for any country. Although tremendous work has been done to enhance road safety and traffic operation, a gap remains, and there has not been notable improvement in the sense of diminishing the road fatalities, posing a significant concern for people and society’s well-being (H. Wu, Gao, & Zhang, 2013).
Over the years, the traffic has created the public’s immense vexation on deaths and injuries resulting from global road crashes. Apart from fatalities, the traffic issue has “by hook or by crook” aggregated the stream of road traffic and inducted road congestion in the traffic-flow
7
maneuver. Explained another way, traffic accidents can be defined as “the nonrecurring events that cause reduction of roadway capacity” (H. Zhang & Khattak, 2010).
The decreased road capacity may not have big effects on the roads in rural zones, but the traffic in urban areas is influenced by the catastrophe of traffic accidents. The traffic flow in urbanized areas is immense, and a minute disturbance on the roads could affect the overall chaos of the road traffic. Imagine yourself in an ambulance on the way to a rescue or a hospital when people are stuck in traffic congestion due to a road crash. The loss of lives, in that case, could be multiplied, i.e., the loss of life from the ambulance’s inability to rescue the person and the loss of life from the accident itself. Typically, traffic accidents account for 30-50% of the traffic
congestion within a municipal jurisdiction (Kwon, Mauch, & Varaiya, 2006; Ozbay & Kachroo, 1999; Skabardonis et al., 1995). Accidents are not limited to crashes with vehicles, but may include abandoned or broken vehicles as well as road debris (H. Zhang & Khattak, 2010). Road debris is a form of road hazard that is on or off the road. The debris includes materials, objects, or substances that exist on the traffic path and cause a flow disruption and is against the typical street atmosphere. The first accidents not only cause traffic-flow delays, but are also responsible for secondary incidents due to the distraction and traffic backups from the original accidents.
The condition of traffic accidents in the United States is not any different than other countries. With the growing U.S. economy as well as closing the gaps between people and cities, there has been a significant and noticeable rise in road crashes. According to the statistics, 35,092 people lost their lives from accidents in the United States during 2015, compared to the 2014 figure which was 32,744 people (National Highway Traffic Safety Administration, 2016). Additionally, the increase for traffic crashes between 2014 and 2015 was 7.22%, the largest in 50 years of history for U.S. traffic accidents. According to the National Highway Traffic Safety
8
Administration (2016), the most substantial increase for traffic crashes was observed from 1965 to 1966 with an estimated percentage upsurge of 8.1%. The increased percentage of accidents is alarming and devastating for any country’s transportation authority, specifically for a country like the United States which spends billions of dollars on road safety and improving the transportation system. According to the USDOT, the requested budget for fiscal year 2017 is $98.1 billion. In contrast, the amount spent in 2016 was $78 billion. The amount that focused on the federal highway administration alone was $42.7 billion. The difference in the amount
requested for 2017 and the money spent in 2016 is enormous, illustrating the need to improve the nation’s transportation system. The question about the credibility on the traffic safety system is still undefined and has all sorts of concern.
Besides, the deaths from road accidents are not the only worrisome thing for the responsible authorities. The crashes’ injury consequence is the primary and foremost issue for the transportation authorities to address. The National Highway Traffic Safety Administration (2016) stated that the injuries during 2015 were felt by 2.44 million people, compared with about 2.34 million people in 2014. Some people were disabled from the severe injuries. The cost for rehabilitating the people who require medical treatment and special care exceeds billions.
Hospitalization and rehabilitation are not the only expenses that authorities need to consider. The property, wage, and productivity losses contribute immensely towards the authorities’
expenditures. The Association for Safe International Road Travel states that road crashes cost the United States $230.6 billion per year, an average of $820 per person. The crashes are not the loss of an individual, but the overall loss of the people affected by the accidents and the respective authorities.
9
Knowing the number of accidents, it is imperative to say that the United States is one of the deadliest places to drive when compared to the world’s traffic reports. Alarmingly, the numbers as well the transportation department’s budget are increasing yearly. The traffic concerns are still in place to provide a better environment for drivers and families to travel in a safe manner and without distress. There are many things that federal and state officials and transport agencies have done to improve the overall safety and stricken the traffic laws.
However, the results have not been achieved, and better plans are required as the growth in road crashes is significant. Additionally, researchers have done various studies, analyzing the factors involved with fatalities in order to come up with a system to improve the public’s road safety for the future.
2.2. Analysis of Traffic Accidents and Safety
As stated earlier, the academic participation to develop an improved road-safety structure to reduce crashes has been enormous. Universities have conducted a plethora of research on various subjects that are linked to the road’s traffic accidents and safety. Every state’s
department of transportation has provided universities with research funds to conduct studies to help improve the overall structure of the traffic system. In an accident, there are multiple contributing factors which account for a crash’s risk and unforeseen mishaps. These factors include, but are not limited to, vehicle design, road design, road environment, the driver’s speed, weather conditions, light conditions, and the driver’s demeanor. Road crashes are the
consequence of multiple factors and scenarios that cannot be avoided at the time of performing analysis and cannot be incorporated to yield an improved product to reduce accidents.
Accident analysis is often done to examine crashes and to prevent similar incidents in the future. The study aids the understanding of factors which are related to a traffic accident (Kumar
10
& Toshniwal, 2016). The best explanation is provided by Bhalla, Tripathi, and Palria (2014): “Accident analysis is carried out to determine the cause or causes of an accident or series of accidents so as to prevent further incidents of a similar kind. It is also known as accident investigation” (Bhalla et al., 2014).
With plenty of statistical techniques available, all sorts and sizes of crash-data analysis can be performed. One outcome could be different and might be not as accurate as another, but each method provides its benefit. With the growing academic and spreading technology, the smooth race of betterment in a traffic system is on the role. One of the most common ways to analyze data is by performing linear models (LM). This method is popular because of the benefits it provides. This technique transforms the data into a linear form, hence the means and variances could easily be derived from the linearly modified data (Oppe, 1992). However, this technique cannot be applied if the crash data do not follow the linear-model trend and if the utilized parameters have no direct relationship. Various researchers have used this approach to build models for analyzing the traffic accidents’ factors (Akoz & Karsligil, 2010; Greibe, 2003; Haque, Chin, & Debnath, 2012; P. Y. Park, Miranda-Moreno, & Saccomanno, 2010). P. Y. Park et al. (2010) used multiple linear models to evaluate the rural highways’ speed factor that is responsible for more accidents and stated that the traditional speed-differential measure is not useful with the early design phase for road construction. Greibe (2003) examined the urban-junction and public-road links to produce accident-prediction models. These models were
intended to precisely forecast traffic accidents at the road junctions and links. Haque et al. (2012) utilized the log-linear model to study motorcycle crashes in Singapore. The research used various factors, such as environment and roadway characteristics, to determine what caused vehicle accidents at different locations.
11
Sequential binary logit models are another method for analyzing accident severity. Various factors were identified in the research and were used to determine the accidents’
severity. Nassar, Saccomanno, and Shortreed (1994) identified the factors as accident dynamics, seating position, vehicle condition, vehicle size, etc. To predict road fatalities in China, Qing and Zhongyin (2015) analyzed crash data by performing a co-integration analysis. The statistical property used to create a model helps to provide a more reliable and precise method in
determining the probability of road accidents. The other statistical technique, quantile regression, was examined to develop a methodology to estimate the crash rate of recurrences (H. Wu et al., 2013). Also, this statistical tool provided a more comprehensive way to study the accident data.
Data analysis is a hectic, long process and requires a longer period, specifically for crash data, because the road-accident volume rises yearly. Techniques such as data mining and cluster analysis have been used to study the factors and conclusions (Kumeta, Miyake, & Ogawa, 2006; Rui, Zhaosheng, & Maolei, 2010; Shanthi & Ramani, 2012). These studies examined aspects such as accident frequency and the crash’s attributes to produce a novel methodology for
predicting road fatalities. The studies showed that sufficient data-analysis research has been done for road crashes. The need is to utilize these techniques in the most effective manner.
2.3. Tools to Improve Road Safety and to Evade Accidents
As with earlier discussion, the Literature Review highlighted the data-analysis practices for road accidents that were applied in the academic research. This section discusses the tools and models which were developed to improve the overall road safety by reducing accidents and mishaps on the highways. The problem to minimize traffic accidents has existed for decades, and several models and tools have been developed to counter that problem. The issue is gaining importance with the passage of time; hence, there is a need to develop more techniques and tools
12
by the aid of latest technology. For that reason, researchers have utilized the latest tools and technology to create a better model for an improved road environment.
Recent applications, such as Adaptive Neuro-Fuzzy Inference System (ANFIS), have been applied in the field of accident data to anticipate the uncertainty and unpredictability of accident data (Hosseinpour, Yahaya, Ghadiri, & Prasetijo, 2013). In the research, ANFIS was utilized to create a model by using the identified indicators; later, ANFIS was compared with the Poisson, negative binomial, and non-linear exponential regression models. The results
demonstrated that the ANFIS model provided more accuracy and exactness than the other models. Hence, the ANFIS model can be used by transportation authorities because of its ability to provide better prediction for enhanced road safety, negating indecision with traffic data (Hosseinpour et al., 2013).
Technology, such as video cameras and photographs, has been used to record crash data in recent years because accurate accident data are a necessity for building realistic prediction models. However, the current practice of recording the accident scene is old fashioned and does not satisfy today’s demand (Z. Guo, Shang, Wang, & Sun, 2000). In order to resolve the
problem, (Z. Guo et al., 2000) used the photogrammetry and computer-vision techniques to capture data using video-camera tools that are integrated with the system. With this method, the data-recording technology was improved and provided accuracy which was matched with the practical measurement requirement. Moreover, technology tools were applied to regulate the vehicles’ maneuvering and speed. For research conducted in Japan, (Matsuzaki et al., 2008) developed an intelligent traffic-light system. Because the rate of accidents for pedestrians and vehicles at a blind intersection is comparatively high, the researchers limited their study to that particular case. To verify the results and effectiveness, the researchers experimented with the
13
intelligent traffic-light system at a blind intersection and installing sensors and receivers on a pedestrian and used a mobile robot car. The result displayed the positive output, and the system was entirely applicable to install for a real-time situation (Matsuzaki et al., 2008).
Apart from using technology to predict road accidents or models to reduce the crashes, several other tools and systems were developed with the passage of time and by using alternative methods. A traffic-accident prediction system based on fuzzy logic was proposed by Driss, Saint-Gerand, Bensaid, Benabdeli, and Hamadouche (2013). From the study, the researchers investigated to measure influences on accidents from the local road network. This system offered prediction of risk exposure for road crashes and an analysis of the complex factors involved (Driss et al., 2013). This system helps to identify risk factors for the highways and is fully applicable as a road-safety tool. Furthermore, the Transport Research Laboratory (TRL)
developed the SafeNet tool that models the risk of a traffic accident and estimates the injuries per year for a particular road network (Basbas, 2005). This tool was tested at the researcher’s local premises and suggested that the tool is valuable for the traffic engineers’ work. Another model to predict traffic accidents, developed by Q. Wang and Liu (2009), is known as the GNN
forecasting model. This model is a combination of two models built on the Grey prediction model and ANN. With this tool, the model provides more precision for predicting traffic accidents and a simple tool that is practically applicable (Q. Wang & Liu, 2009).
2.4. The Empirical Bayesian (EB) vs. Full Bayesian (FB) Method and Their Application on Traffic-Accidents’ Data
The Bayesian method is a statistical inference tool of combining prior and current information in the form of data to describe an event’s probability. With the Bayesian method, there are various approaches to combine and analyze information from the given data. Two
14
approaches are Full Bayesian and Empirical Bayesian, different methods of combining the prior and current information. With Empirical Bayesian, the prior distribution is calculated from the given data, whereas the Full Bayesian (FB) uses the approach of fixed prior distribution without observing the current data.
From a research perspective, the Bayesian approach for analyzing the data is not novel. This method has been used to analyze data in all application categories, including traffic
(Carriquiry & Pawlovich, 2004). The earliest work of applying the Bayesian method to analyze traffic safety started with Hauer and others (Hauer, 1986, 1996a, 1996b; Higle & Witkowski, 1988; B. N. Persaud, 1988). These researchers utilized the Empirical Bayesian (EB) method to analyze the crash data and consider Empirical Bayesian an advantage over other traditional statistical-analysis approaches. The EB approach is well accepted for analyzing traffic data (Carriquiry & Pawlovich, 2004).
In contrast with the advantages for the EB approach, various authors have argued for the FB method to analyze data. Studies that analyzed the traffic-crash data and safety evaluation by comparing the FB and EB methods favored FB over the EB approach (Carriquiry & Pawlovich, 2004; B. Persaud, Lan, Lyon, & Bhim, 2010). They argued for the FB method and concluded that the FB approach has more advantages than EB method. Also, the authors stated that the FB method is more practical and is a more realistic approach for the data process.
As mentioned earlier, the EB method is an acceptable approach to analyze the traffic-crash data. Recent research work has been done to study the traffic-traffic-crash data and to model them with the EB method (Azizi & Sheikholeslami, 2013; Huang, Chin, & Haque, 2009; Schubert & Wanielik, 2011; Srinivasan, Ullman, Finley, & Council, 2011; Zhou, Zhao, Hsu, & Huang, 2013). These studies were conducted to observe the safety effects of some security applications
15
and the crash factors with the EB method. The results stated that the EB method is useful for identifying crash factors and helping to evaluate the safety techniques. The procedure is successfully applicable and acceptable for traffic-data evaluation with some limitations. 2.5. Geographic Information System (GIS): An Effective Tool for Traffic Data
With more development in the field of technology, the geographic information system (GIS) has become a powerful tool to visualize and analyze the data collected from the world graphically. GIS has gained enormous acceptance in all sort of fields and has been part of almost every type of educational study and research. GIS usage is increasing with the passage of time and has been in demand. Likewise, there have been numerous recent studies that utilized GIS to analyze and to manage the accident data as well as to provide geographical information (Y. Chen, Liu, Wu, & Sun, 2011). The advantage of using GIS is that it has the capability for analyzing and processing a huge amount of data with ease (Durduran, 2010). The data are managed and analyzed with various software, such as ArcGIS which is a software and GIS tool that performs numerous functions with the information collected from the GIS. ArcGIS has a framework that works with the world’s map and geographical information.
The GIS’ uniqueness is that it has the capability to provide geographic information along with all the other information to perform a task. For this reason, a GIS is the most efficient tool for managing, organizing, and analyzing the traffic data. Bhalla et al. (2014) used a similar approach to perform a traffic-accident analysis of Ajmer City (India) and suggested that applying a GIS is a useful tool to produce a road-accident database system. Moreover, the factors that account for the traffic accidents are also identified using the GIS, hence helping to improve the traffic conditions (Y. Chen et al., 2011). The traffic-crash data are complex with all sorts of uncertainties and variables that cause accidents. With the increasing number of accidents per
16
year, the data are getting larger, causing difficulty with managing the database, and performing the analysis is very challenging. The GIS with the ArcGIS tool makes it easier to visualize the data and to form a better understanding of the database, hence improving the data’s overall organization, and the information is utilized in the most effective manner (Jinlin Wang, Chen, Zhou, Wang, & Zhang, 2008). Another advantage GIS provides, is forming prediction models and decision-making system from the accident database evaluation, which could help in taking precautionary measures in dangerous conditions (Durduran, 2010). Overall, the benefits of using the GIS are evident in the traffic data from previous research, and it is one of the best techniques to analyze the data.
2.6. An Overview of Traffic-Accident Factors
The trend for road accidents in Texas has grown in recent years. However, the accidents can restrain or confine the proper analysis of the factors that contribute to the traffic fatalities, and on that basis, the prediction models developed (B. Chen, He, & Wang, 2011). The evaluation of traffic-accident factors is an important subject and must be taken seriously to overcome the problem with traffic fatalities. Various studies were conducted to find the factors that contribute to road accidents. X. Li, Lord, and Zhang (2010) studied the application of generalized additive models to conduct research on the crash-modification factors. Likewise, the implication of the binomial regression models was used to construct an accident-modification factor and crash-prediction models for the horizontal curves in the United States (Fitzpatrick, Lord, & Park, 2010; Knecht, Saito, & Schultz, 2016). An algorithm, such as the support vector machine (SVM), is employed to study the classification of the traffic condition involve striking before the accident occurrence (Qu, Wang, & Wang, 2011). Furthermore, there are possible factors for sideswipe accidents in the off-peak hours when vehicles are traveling in a straight line on a multilane
17
highway (Jiangfeng Wang, Zhang, Wang, Weng, & Yan, 2016). The traffic accidents have massive socio-economic consequences, harming road productivity and increasing Medicare expenditures (Naumann, Dellinger, Zaloshnja, Lawrence, & Miller, 2010). Therefore, the value linked to the crashes demands a deep understanding and a model for cost estimation (Hancock, Zhang, Sardar, & Wang, 2016).
In recent years, there have been various studies to analyze the database for traffic-accident severity. The goal for all the studies is to help control road traffic-accidents by providing possible solutions. Statistical tools and methods are used and considered to assess and to analyze road accidents and fatalities (Savolainen, Mannering, Lord, & Quddus, 2011). Examples of the multiple statistical methodologies and models which are employed for the analysis are Poisson regression (Guohui Zhang, Zheng, & Wang, 2012), the simple micro approach (Medina, Shen, & Benekohal, 2014), multiple logistic regression (Guopeng Zhang, Sun, Lou, Xu, & Jiang, 2013), the logistic-regression model (R. Chen, Zhang, Li, & Wang, 2012; MacLeod, Griswold, Arnold, & Ragland, 2012; Schultz, Farnsworth, & Saito; Tefft, 2013), the Bayesian model (Huang & Abdel-Aty, 2010; J. Ma & Li, 2010; Schultz, Black, & Saito, 2014; Schultz et al.), the multinomial logit model (F. Chen & Chen, 2011; H. Chen, 2014), the bivariate
Poisson-lognormal model (X. Ma, Chen, & Chen, 2016), the multivariate Poisson-Poisson-lognormal model (Bai, Liu, Li, & Xu, 2011), and quantile regression (H. Wu et al., 2013).
2.7. Road-Accident Factors 2.7.1. Age and Gender
Age and sex are factors which are connected with fatal accidents and are related to each other. Female drivers follow the same accidental behavior in driving skills parallel to males. However, a study suggests that females are more likely to be in an accident than males due to
18
maneuvering skills when speeding (Kelley-Baker & Romano, 2010). The behaviors and factors that cause crashes vary with age groups and sex (Hao, Kamga, & Daniel, 2015). It has been observed and investigated that older people and teens are prone to more fatalities than middle-aged individuals (Alam, 2011; Masten, Foss, & Marshall, 2011). Teens with learner permits are more likely to have accidents than adults with a similar vehicle. Also, teens are the primary reason for severe crashes (Curry, Hafetz, Kallan, Winston, & Durbin, 2011; Lee, Simons-Morton, Klauer, Ouimet, & Dingus, 2011; Simons-Morton et al., 2011).
2.7.2. Construction Zones
Highway construction zones are hotspots for predictable road accidents. The recurrent incidents at intersections demand thorough consideration to improve safety measures
(Elghamrawy, El-Rayes, & Liu, 2010; Higa & Kim, 2013; Pulugurtha & Nujjetty, 2011; Y. Zhang, Zhu, Wang, Hu, & Liu, 2011). The characteristics of work-zone areas are a vital source of information for transportation authorities to measure construction-zone safety and traffic management (Akepati & Dissanayake, 2011). The findings suggest that nighttime work in construction zones provides less visibility for the workers and creates hazardous conditions (Valentin, Mannering, Abraham, & Dunston, 2010). Z. Wang, Lu, Wang, Lu, and Zhang (2010) model severe crashes in work zones using the ordered Probit regression. The practical
implication made by applying the work-zone barrier system in Oregon City to enhance the safety of workers at labor area (Tymvios & Gambatese, 2014).
2.7.3. Freeways and Vehicle Type
To avoid traffic congestion and maintain the traffic flow, freeways were constructed in the United States. The freeways’ purpose is to help drivers reach their destination quickly and on time. However, freeways create great concern for traffic authorities because of the recurrent
19
crashes and fatalities (Y. Guo & Sun, 2013). Accidents can be categorised by vehicle type, such as buses (Kaplan & Prato, 2012), trucks, etc., because the risks and factors involved with each vehicle type vary. The presence of large vehicles on the highways causes fear and is responsible for a lot of fatalities. The potential risk for truck accidents on the roads is a primary concern, specifically in construction zones. Therefore, possible risk factors are analyzed for a smooth traffic flow with no impediment on the motorways (Elvik, 2016; Y. Li, Cheng, & Bai, 2012; Vadlamani, Chen, Ahn, & Washington, 2010).
2.7.4. People’s Carelessness
Often, people’s negligence leads to major accidents. Abandoned or disabled vehicles on the highways may not pose a danger. However, abandoned and disabled vehicles create adverse safety conditions on the road and account for 78% of the traffic accidents in Tennessee (Chimba, Kutela, Ogletree, Horne, & Tugwell, 2013). Likewise, long driving routes may cause drowsy feelings and fatigue, particularly when you have not had enough sleep, if you have sleep apnea (Philip et al., 2010; Tregear, Reston, Schoelles, & Phillips, 2010), or if you have taken drugs (Pressman, 2011). Drowsy driving accounts for numerous accidents and fatalities. Hence, the drowsy-driving advisory system was developed to overcome the fatalities origin from the drowsiness (Kang, Momtaz, & Barnett, 2015).
2.7.5. Weather Conditions
Similarly, climatic factors cause some accidents. Weather conditions, such as rain and snow, create hazardous conditions for drivers. The United States has plenty of places which receive lots of rain and snow, depending on the season. Snow creates an unsatisfactory road surface, and visibility is affected (Seeherman & Liu, 2015). Rain causes a slippery road and produces unfavorable conditions for drivers. Thus, adverse conditions from rain cause severe
20
crashes and demand an analysis to identify the accident-prone wet locations (Ye, Shi, Huang, & Wang, 2015). A study suggests that drivers respond differently, depending on their age and gender, to changing road-surface conditions (Morgan & Mannering, 2011). Jung, Qin, and
Noyce (2011) used the sequential logistic-regression approach to study crashes that resulted from rain on the high-speed highways. The low visibility and less physically active of a driver may lead to drive in wrong direction. The wrong-way driving may not cause severe damage as other accidents, but it still accounts for crash reports, and majority of these accidents go unreported (Rogers, Al-Deek, & Sandt, 2014). Moreover, Nourzad, Salvucci, and Pradhan (2014) proposed a computational model to examine how driver distraction accounts for accidents. Texting and mobile-phone usage in driving are new issues for the authorities to mitigate and are causes of distraction for drivers (Ige, Banstola, & Pilkington, 2016; Wilson & Stimpson, 2010), especially teens and new drivers (Klauer et al., 2014). Therefore, studies, such as ones that use the
computational model to determine the effect of distracted drivers on the extensive road networks (Nourzad et al., 2014), provide wide-ranging safety information to implement.
2.7.6. Alcohol
Consuming alcohol before or while driving is considered a major issue in the United States, and it poses a real concern for traffic safety. Alcohol-related accidents are responsible for a record number of U.S. crashes, and study suggests that people who are drugged while driving create hazardous road conditions (G. Li, Brady, & Chen, 2013). Therefore, researchers focused their studies on this particular subject. Hajizamani, Shrubsall, and Viegas (2011) designed a device which is installed inside the vehicle to keep an alcohol-impaired person from driving the automobile, and the procedure was evaluated using agent-based modeling (ABM). However, an incentive, such as tax increments and passing laws which have zero tolerance, should be
21
implemented by the government to control the use of alcohol before and while driving (Chang, Wu, & Ying, 2012). Previous studies suggested that increased taxes for alcohol would help to significantly reduce alcohol-related fatalities (Elder et al., 2010; Wagenaar, Tobler, & Komro, 2010).
2.7.7. Technology
Technology has its advantages and has flourished recently. Using technology, such as sensors (Hallowell, Teizer, & Blaney, 2010) and the Advanced Transportation Management Information System (ATMIS; (Choe, Gordon, & Martinez, 2013), has proven benefits for the operation of traffic flow and the overall safety. The adaptive traffic signal control (ATSC) system has been adopted by various places in the United States. The ATSC generates the crash-mediation factors that were used in the research to study intersection accidents (J. Ma et al., 2016). A study found that using technology such as side-view assist, forward-collision warning/mitigation, lane-departure warning/prevention, and adaptive headlights prevents and mitigates road accidents (Jermakian, 2011). Over the years, increased use of the geographic information system (GIS) has had a significant effect on the analysis of crash data. Geospatial analysis using the GIS provides an easy understanding of the data and predicts areas which are inclined to have traffic accidents (Mehta, Li, Fields, Lou, & Jones, 2015; Pulugurtha &
Pasupuleti, 2013). Data about the locations which are prone to accidents provide helpful information that is related economic loss, hence the loss can be estimated (Yang, Lu, & Wu, 2013).
2.7.8. Intersections
Crashes at intersections are of bigger concern for the U.S. transportation authorities. Traffic data at intersections have been studied (X. Wang, Chen, & Sun, 2010), and models have
22
been developed to estimate the crashes at intersections (F. Guo, Wang, & Abdel-Aty, 2010; Pulugurtha & Nujjetty, 2011). One standard practice to mitigate accidents at intersections is to install signals (Shams & Dissanayake, 2014). However, accidents at signalized intersections comprise a large percentage of the crashes (Haleem, Gan, & Alluri, 2014; Xu, Teng, Kwigizile, & Mulokozi, 2014; Guopeng Zhang et al., 2013). Therefore, systematic studies have been done in this particular area to develop numerous systems, such as the integrated dilemma zone protection system (IDZPS; (S. Y. Park, Lan, Chang, Tolani, & Huang, 2016), the access management technique (Xu, Teng, & Kwigizile, 2011), and the Geographically-Weighted
Regression (GWR) technique (Z. Li, Lee, Lee, & Valiou, 2011). Various factors result an
incident, thus the factors can be classified for the accidents at intersections as well. Lighting is one factor studied to investigate the accidents at intersections (Zhao, Jiang, & Li, 2016). Moreover, the finding implicates that roadway lighting provides better vision for drivers and helps to reduce accidents (Isebrands et al., 2010). Controlling accidents at intersections will lessen the rate of accidents in the United States immensely. Thus, there is a need to provide enough resources at the intersection, and multiple options are required to improve safety (Mishra & Khasnabis, 2011). Appiah, Rilett, Naik, and Wojtal (2012) used the actuated warning system to investigate the effectiveness on the intersectional accidents.
2.7.9. Planning and Design
The best possible solution to reduce accidents is by incorporating the accident factors while planning and designing highway networks. The roadway’s geometric design controls the operational speed; therefore, the relationship between the planning and design requires
consistency for traffic safety (K.-F. Wu, Donnell, Himes, & Sasidharan, 2013). Similarly, the design for roundabouts has various factors to control and prevent accidents (Zirkel, Park,
23
McFadden, Angelastro, & McCarthy, 2012). Recent studies have found that shoulder paving had a positive influence on the highways’ traffic safety (Z. Li et al., 2013; Z. Li, Lee, Lee, Zhou, & Bamzai, 2011). Research by Anderson and DeMarco (2013) provides a valid tool and accurate information for designing new slopes. During the planning stage, the median is an important aspect of the road’s infrastructure and is a dividing line between the two roads with traffic flowing in both directions. The dividing line needs to be prominently visible for drivers to stay on the given pathway and not intersect with oncoming traffic, especially at night. High-tension cable barriers are a way to avoid vehicle crashes on the median, hence the costs and benefits of installing cable barriers are studied in comparison with median-related crashes (Villwock, Blond, & Tarko, 2010).
2.7.10. Pedestrians
The consequence of road accidents is high for pedestrians who are crossing the streets or waiting to cross to the other side of the road. Drivers’ inattentiveness as well as broken or poorly implemented laws are the leading causes for pedestrians’ crashes (Zegeer & Bushell, 2012). The vast number of these accidents involve children. Previous studies suggested that regular practice and training to cross streets can lead to safer environments (Schwebel, Combs, Rodriguez, Severson, & Sisiopiku, 2016). Schwebel et al. (2016) experimented with cognitive behavior by providing a virtual semi-mobile and semi-immersive environment at schools and community centers. However, pedestrians’ sloppiness and negligence, such as texting, talking on cell phones, listening to music, etc., lead to distraction for drivers and accounts for road accidents (Neider, McCarley, Crowell, Kaczmarski, & Kramer, 2010; Schwebel et al., 2012).
24 2.8. Conclusion
From the Literature Review, it is clear that traffic accidents are a huge concern for transportation organizations with the increment each year at rapid growth. The demand to take action is getting stronger. The authorities have worked on various projects with researchers to study and to analyze the accident database, creating better systems and models to improve traffic safety. These measures are helpful, but there is still a lot to be done. The models and studies must be updated yearly in the database, and more accident factors are required to identify. Also, using technology requires merging the latest studies for a beneficial outcome and better models. Hence, the overall target should be to improve the safety and well-being for a better
25
3. EXPLORATORY DATA ANALYSIS 3.1. Introduction
This chapter provides a holistic picture of the information that was discovered in the database; this information is discussed in detail. Various methods and techniques were used to analyze the data. The analysis method and technique were based on the hit-and-trial method by first trying different elements and parameters on the data in order to obtain the relationships among parameters. The method provided essential information from the database which was extracted to answer crucial research questions. The results argued and discussed in detail that lead to multiple conclusions. The results are presented in the form of tables, statistical models, and graphical methods. ArcGIS was used to observe trends in the database and to identify the key locations and attributes for the research study. The ArcGIS trend is shown in a separate section, and the significant trends which were mined from the ArcGIS models are elaborated expansively.
3.2. Data Acquisition
The database was obtained from the Texas Department of Transportation (TX DOT) by completing an online request form to provide the database for Texas accident data from 2010 to 2016. The database was huge and consisted of multiple Excel CSV (comma separated value) files for each year, providing geographical information in the form of XYZ coordinates. For analysis purposes, each year’s data were amalgamated into a single Excel file. The crash database provided by the TX DOT was expansive in detail, with different elements and
parameters that included a database dictionary to describe the codes and standards in the accident database. Examples of some data parameters and characteristics for the database acquired from the TX DOT are listed in Table 3.1.
26
Table 3.1. Example Dataset of Accidents from the Texas DOT.
Crash_ID Crash_Date Crash_
Time Case_ID Rpt_CRIS _Cnty_ID Rpt_City_ ID Rpt_Street_ Name 11152318 1/19/2010 10:02 AM 1001140016 165 291 WILLIAMS 11152319 1/19/2010 11:30 AM 1001190017 165 291 ANDREWS 11152320 1/19/2010 4:36 PM 1001190037 165 291 WADLEY 11152327 1/23/2010 1:53 PM 003226 2010- 220 31 SHIRLEY 11152328 1/24/2010 10:55 PM 10001529 43 468 LINE ROAD COUNTY 11152331 1/20/2010 3:55 PM 10000768 61 1626 I35E 11152333 1/26/2010 10:44 PM 2010-3912 101 29 ALEXANDER 11152338 1/8/2010 1:44 AM 19072 15 379 IH35N 11152344 1/8/2010 7:41 AM 19408 15 379 FLORES 11152346 1/10/2010 2:04 AM 10-00026 161 442 PARK LAKE 3.3. Accident Trends, 2010-2016
The overview section elaborates the first perspective after looking at the database by compiling the separate files into one Excel file. The overview offers conclusive information that was evident at the beginning and that lead to further research for more obvious conclusions. Table 3.2 provides a summary of the yearly crash data, 2010 to 2016, and the percentage increase for accidents in Texas.
27
Table 3.2. Percentage Increase for Traffic Accidents, 2010-2016.
Years Total Crashes Percentage Increase in Crashes from Prior Year 2010 472298 0 2011 456034 -3.44 2012 495778 8.72 2013 521101 5.11 2014 554934 6.49 2015 598791 7.90 2016 624734 4.33
Figure 3.1. Trend for Annual Traffic Accidents in Texas, 2010-2016.
Figure 3.1 represents the trend for traffic accidents in Texas. The data suggest that the number of traffic accidents rose every year except 2011. In 2011, road accidents decreased by 3.44% from the preceding year. Figure 3.1 shows the positive trend for the relationship between the number of total crashes and the year, with an average of 531,953 accidents per year between 2010 and 2016. From Figure 3.1 and Table 3.2, we see the alarming situation in Texas: the
472298 456034 495778 521101 554934 598791 624734 y = 28642x - 6E+07 R² = 0.9432 400000 450000 500000 550000 600000 650000 2010 2011 2012 2013 2014 2015 2016 To ta l C ra sh es Years
28
increased percentage of traffic accidents is significant. The highest percentage increases for traffic crashes are in 2012 and 2015 with higher increments of 8.72% and 7.9%, respectively. The positive trend in Figure 3.1 provides a significant R2 value of 0.9432, and a fitted linear
equation is provided in Eq. 3.1:
Y = 28642x – 6E+07 (Eq. 3.1) 3.3.1. Annual Fatalities, Injuries, and Deaths, 2010-2016
The important aspect for analyzing any crash data is by counting the fatalities, deaths, and injuries for each year. This information illustrates the importance of traffic-safety issues for a state compared to other states and measures the performance of the respective state authorities. However, Texas portrays a traumatic picture of a dangerous U.S. state with the most fatal
accidents. Figure 3.2 elaborates the number of traffic fatalities, deaths, and injuries in the Texas from 2010 to 2016.
Figure 3.2. Annual Traffic Accident Fatalities and Deaths in Texas from 2010-2016.
In Figure 3.2, “fatalities” refers to accidents that have resulted in one or more deaths, whereas “deaths” denote the total number of deaths for an individual year. Figure 3.2 has a positive trend with ups and down, and there is a significant increase in deaths and fatalities by
2010 2011 2012 2013 2014 2015 2016 Fatalities 2817 2857 3081 3094 3231 3227 3438 Deaths 3098 3121 3461 3437 3578 3619 3804 2500 2700 2900 3100 3300 3500 3700 3900 Co un ts Years Fatalities Deaths
29
2016. The fatalities dropped in 2015, yet the decrease is insignificant with just four fewer fatalities than the previous year. The numbers also show a decline in deaths for 2013 with a decrement of less than 1%. The highest number of fatalities and deaths is in 2016, with an increase of 22% and 22.8%, respectively.
Figure 3.3. Texas’ Annual Count for Traffic Injuries, 2010-2016.
Figure 3.4. Percentage Difference for Injuries by Year, 2010-2016.
Figures 3.3 and 3.4 represent the number of injuries and the percentage of difference for 2010 to 2016. Figure 3.3 is skewed towards the left because it shows the positive tendency for the number of injuries which increased yearly except in 2011. The highest number of injuries is noted in 2016, with a value of 269,152, and the lowest value is observed in 2010 (222,585
222585 217199 236335 238054 244016 253333 269152 y = 7844.6x + 208718 R² = 0.9146 200000 210000 220000 230000 240000 250000 260000 270000 280000 2010 2011 2012 2013 2014 2015 2016 In ju rie s Years 0 -2.42 8.81 0.73 2.50 3.82 6.24 -4 -2 0 2 4 6 8 10 2010 2011 2012 2013 2014 2015 2016 Pe rc en ta ge d iff er en ce Years
30
injuries). The mean for injuries for the 7-year period is 240,097. A fitted linear equation (Eq. 3.2) is plotted for each year’s injuries, and an R2 value of 0.9146 is attained, a relatively significant
finding.
Y = 7844.6x + 208718 (Eq. 3.2) Figure 3.4 demonstrates that the greatest percentage increase (8.81%) for injuries was in 2012. In 2011, the injuries from traffic accidents went down 2.42%. The average for the 7-year accident database is a 3.28% increase for an individual year. Despite the decreased number of injuries in 2011, there are more deaths and fatalities than the previous year. A minimal injury increase, with a value of 0.73%, is noted in 2013.
Figure 3.5. Various Ratios for Traffic Accidents, Injuries, Deaths, and Fatalities, 2010-2016. Figure 3.5 provides another perspective to examine the extracted data about fatalities, deaths, and injuries for the 7 years. Figure 3.5, along with statistical numbers, offers the fatality, death, and injury rate (per accident) and the fatality-to-death ratio for an individual year.
Irrespective of recordable accidents for 2015 and 2016, the injury rate per crash has values of 0.423 and 0.431, respectively, which is lower than the other years. On the other hand, the injury
2010 2011 2012 2013 2014 2015 2016
Fatality rate per crashes 0.0060 0.0063 0.0062 0.0059 0.0058 0.0054 0.0055 Death rate per crashes 0.0066 0.0068 0.0070 0.0066 0.0064 0.0060 0.0061 Injury Rate per crashes 0.471 0.476 0.477 0.457 0.440 0.423 0.431 Fatality to Death Ratio 0.909 0.915 0.890 0.900 0.903 0.892 0.904
0.00 0.10 0.20 0.30 0.40 0.50 0.60 0.70 0.80 0.90 1.00
31
rate per crash is highest in 2012 with a 0.477 value; the next closest value is in 2011 when it is 0.476. Interestingly, 2011 has a higher fatality rate per crash than all subsequent years and close to the highest number for the death rate per crash. The highest mortality rate per crash is in 2012. To find a conclusive result to determine which year was the deadliest regarding fatalities and accidents, we have calculated the ratio of fatalities and deaths. Irrespective of the smaller number of accidents and injuries, the fatality-to-death ratio suggests that 2011 was the most lethal year in the 7-year period with a prominent value of 0.915; the next-closest ratio is 0.909 in 2010. The results conclusively illustrate that a year with a lower number of accidents has a higher fatality-to-death ratio compared to years with a higher number of accidents.
3.3.2. Analysis by Region and Location Type
It is vital to determine the accident-prone counties and cities in order to implement active safety measures and to protect people’s lives. The purpose is to promote a healthy transportation environment and to safely maneuver on the road. The approach will aid in identifying the key areas and locations where problems and issues exist. Moreover, this in-depth research will lead to conclusive evidence for recognizing the existing problem and the accident parameters for the following places.
32
Table 3.3. Traffic Accidents, Deaths, and Injuries, Counted by Counties with the Highest Number.
Years Parameters Counties Ratios
Harris Bexar Dallas Tarrant El Paso Travis 2010 Accidents 84378 45337 42170 29977 17414 15532 0.497 Deaths 373 153 190 138 62 82 0.322 Injuries 35770 18547 25174 16348 6418 10647 0.507 2011 Accidents 78025 44229 41378 28979 17456 15712 0.495 Deaths 387 154 185 155 98 88 0.342 Injuries 34191 18661 24412 15653 6494 10904 0.508 2012 Accidents 91411 48087 42550 30855 18564 17947 0.503 Deaths 374 174 212 124 76 109 0.309 Injuries 40752 20820 24778 15644 7147 12794 0.512 2013 Accidents 101794 48908 46456 33609 18164 17291 0.511 Deaths 378 191 227 146 114 61 0.325 Injuries 43126 20250 25472 16391 12153 6827 0.522 2014 Accidents 119044 52252 48626 34034 18026 18395 0.523 Deaths 425 190 240 150 70 96 0.327 Injuries 47028 21003 25567 16508 6843 11744 0.527 2015 Accidents 129472 58422 55124 36906 21993 19466 0.537 Deaths 400 193 265 160 62 147 0.339 Injuries 47790 23672 28013 17340 7302 11847 0.537 2016 Accidents 127330 63171 62318 41332 22688 21419 0.541 Deaths 454 224 320 161 83 114 0.356 Injuries 47612 25512 32400 19783 7659 12810 0.542
Figure 3.6. Ratios for the Counties’ Accidents, Deaths, and Injuries, 2010-2016.
0.000 0.100 0.200 0.300 0.400 0.500 0.600 2010 2011 2012 2013 2014 2015 2016 Ra tio s
33
Table 3.3 shows the counties that had the most accidents in the 7-year period, in
descending order from left to right, and statistics for the resulting deaths and injuries. Texas has 254 counties; the 6 counties with the most accidents from 2010 to 2016 are given. The
designated counties, in the order of the most to least accidents, are Harris, Bexar, Dallas, Tarrant, El Paso, and Travis, respectively. The statistics for accidents, injuries, and deaths reflect the fact that accidents have mostly increased in each county by year, and as the numbers suggest,
transportation authorities’ proactive measures have failed to cope with the issues and problems. Moreover, deaths and injuries have an increasing trend in each county. The table’s important aspect is to identify the portion that these counties contribute towards the overall accidents, deaths, and injuries each year; for this purpose, the ratios are recognized and displayed Table 3.3. Figure 3.6 shows the trend for all years. The rates are calculated by dividing the accidents, death, and injuries of each year with the value of total accidents, deaths, and injuries in the respective year. The values in Table 3.3 and Figure 3.6 show that the 6 counties are responsible for most accidents in Texas, with an average value of 0.52 and a median of 0.51. The ratio provides the value for the standard deviation (0.0174), which is relatively low. The numbers suggest that half of the accidents in the Texas occur in 6 of the 254 counties. The mean and median for the injury rate are 0.52 and 0.522, respectively, endorsing and restating the same facts discussed earlier. The standard deviation for the injury rate is 0.0128. However, the death rate is lower than the accidents and injuries, and displays the mean and median as 0.33 and 0.327, respectively, with a standard deviation of 0.0144. The previous statement expresses the dissimilarity with the
accident and injury rate for the 7-year period, illustrating that the death rates in these counties are relatively low for the number of accidents and injuries. However, the mortality of only 0.33 in 6 counties is a significant value and cannot be neglected. Figure 3.6 shows the slight positive
34
increase for all three parameters, although there was a substantial upsurge for the death rate in 2011.
Figure 3.7. Ratios for the Cities Accidents, Deaths, and Injuries, 2010-2016.
0.000 0.050 0.100 0.150 0.200 0.250 0.300 0.350 0.400 0.450 2 0 1 0 2 0 1 1 2 0 1 2 2 0 1 3 2 0 1 4 2 0 1 5 2 0 1 6 RA TI O S YEARS