Doctoral Dissertations Graduate Research and Creative Practice
4-2016
A Process Improvement Project: Demonstrating a
Patient Portal to Increase Enrollment and Use in an
Underserved Population with Chronic Illness
Jonathan Gibson
Grand Valley State University, [email protected]
Follow this and additional works at:http://scholarworks.gvsu.edu/dissertations Part of theNursing Commons
This Dissertation is brought to you for free and open access by the Graduate Research and Creative Practice at ScholarWorks@GVSU. It has been accepted for inclusion in Doctoral Dissertations by an authorized administrator of ScholarWorks@GVSU. For more information, please contact [email protected].
Recommended Citation
Gibson, Jonathan, "A Process Improvement Project: Demonstrating a Patient Portal to Increase Enrollment and Use in an Underserved Population with Chronic Illness" (2016).Doctoral Dissertations.Paper 39.
A PROCESS IMPROVEMENT PROJECT: DEMONSTRATING A PATIENT PORTAL TO INCREASE ENROLLMENT AND USE IN AN UNDERSERVED POPULATION WITH
CHRONIC ILLNESS Jonathan Curtis Gibson
A Dissertation Submitted to the Graduate Faculty of GRAND VALLEY STATE UNIVERSITY
In
Partial Fulfillment of the Requirements For the Degree of
DOCTOR OF NURSING PRACTICE
Kirkhof College of Nursing
3
Acknowledgements
First I have to thank God for giving me the ultimate direction and guidance for this project over the past few years. Doors were opened to me seemingly at just the right time over and over again. My lovely wife L.A. and girls Jireh, Casiana, and Lillian; you put up with me and supported me in the heavy burden of doctoral study over these three-plus years. Yes, even our dog Woodson, the only other boy in my house, was a comfort to me at times. A hearty thanks to Dr. Peter Christensen at the clinic, who is not only a friend but advocate for me in this project. The same goes for Dr. Cynthia Coviak who stated at our first meeting that as my dissertation chair, her main task was to be my advocate in this endeavor. Drs. Guenter Tusch and Lori Houghton-Rahrig, thank you for giving of your time and considerable experience to guide me along. Also instrumental to me was the help of GVSU statisticians Dr. Gerald Shoultz and Shana Kelley. My wrestling with SPSS was futile until I enlisted your services.
4
Abstract
High risk, high cost chronic conditions such as diabetes, asthma, and congestive heart failure are prevalent in the United States. Nearly half of all Americans have at least one chronic condition (Centers for Disease Control and Prevention, 2009). Almost four-fifths of total health care spending in the U.S. is related to high risk, chronic conditions (Baker, Johnson, Macaulay, & Birnbaum, 2011). The use of patient portals in ambulatory care may be an avenue toward improving chronic disease management. Portals can be used by patients to schedule
appointments, send secure messages to their providers, request medication refills, review lab and test results, make payments, and other activities. The purpose of this quality improvement project was to evaluate whether combining portal demonstration to patients during clinic visits with immediate enrollment would increase the use of a portal in a safety-net primary care clinic. Most of the participants (N = 51) were Caucasian aged 38 to 47 years, high school graduates, and diabetic with no comorbid conditions. Over half were daily internet users. Participants’ use of the portal was recorded over three months. The use rate improved from none prior to portal
demonstration to 39.2%. The demonstration was timed and a cost analysis was performed to present a sustainability plan for demonstration adoption in the primary care clinic. Increased portal use rates may over time equate to improved patient-provider communication and increased patient self-care, leading to improved chronic condition management.
5 Table of Contents List of Tables……… List of Figures………... List of Appendices……… Chapter 1 INTRODUCTION
Scope of the Issue………...………... National Data………. Diabetes……….. Chronic Obstructive Pulmonary Disease………... Cardiovascular Disease and Hypertension…………... Michigan Data……… Uninsured and Underserved………... Self-Care Management……….. Patient Portals……… Meaningful Use……….. Financial Incentives………... The Clinic………...…. Patient-Centered Medical Home……… Targeted Population………... Proposed Clinical Intervention……….………. Potential Result of the Project………
2 LITERATURE REVIEW
Literature Regarding Patient Portals……….. Search Methods……….. Critical Appraisal………...……… Results……… Characteristics of Portal Users……….……….. Effect of Portals………. Techniques for Improved Portal Adoption……… Synthesis……… Relevance to MyCare………
3 CONCEPTUAL FRAMEWORK
Conceptual and Implementation Frameworks for the Project………... Chronic Care Model History………..… Four Main Chronic Care Model Components……… Research on the Chronic Care Model……… PARIHS Framework History and Elements……….…. Evidence………. 8 9 10 12 12 12 12 13 14 15 16 17 17 18 19 20 21 23 25 27 27 29 30 30 36 39 41 43 45 45 47 48 50 52
6
Context………... Facilitation………. Successful Implementation……… MyCare in Relation to the CCM and PARIHS………. Setting……… Roles of DNP Student Facilitator and Physician Champion…. Characteristics of the Population………... Implications for Future Research………..
4 METHOD
Method for MyCare Implementation……… Early Phase……… Clinic Characteristics………. Stakeholder Involvement………... Middle Phase………. MyCare Functionality……… Recruitment Methods and Inclusion Criteria………. Intervention……… Data Management and Variables………... Anticipated Barriers………... Clinical Context………. Participants………. Anticipated Facilitators……….. Late Phase……….. Measurement Indicators………. Dissemination………. 5 RESULTS Implementation Timeline……….……….…. Barriers………... Facilitators………. Demographic Statistics of Participants……….. Demonstration Description………... Portal Usage………... Statistical Analysis………. 6 DISCUSSION Summary of Findings……… Successful Implementation……… Operationalization……….. Fidelity………... Contextual Factors………. Diffusion……… Strengths ………... Limitations………...……….. Outcome Measures……… 53 53 54 55 55 55 55 56 58 58 59 60 60 60 62 63 65 68 68 68 69 71 71 72 74 74 75 75 78 78 79 81 81 81 82 82 82 83 84 85
7
Recommendations……….. Sustainability Plan……….………. Cost Analysis……….………. Doctor of Nursing Practice Essentials and Roles……….. Future Research or Project Recommendations……….. Policy Implications……… Practice Ramifications……….. Conclusion………. APPENDICES……….. REFERENCES……….. 86 86 87 88 89 90 92 93 95 99
8
List of Tables
Table 1 – Demographic and Descriptive Characteristics of Participants………... 77 Table 2 – Summary of Quantitative Variables………... Table 3 – Pearson’s r Correlations between Quantitative Variables………...
78 80
9
List of Figures
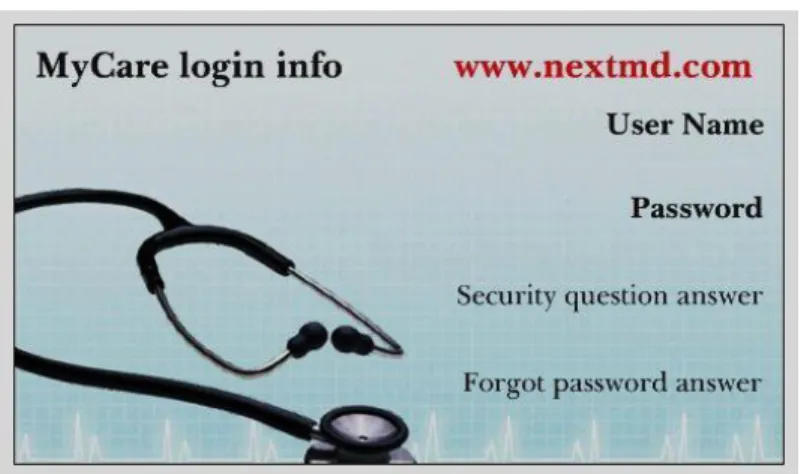
Figure 1 – The Chronic Care Model……….. 46 Figure 2 – PARIHS Diagnostic and Evaluative Grid………...………. 51 Figure 3 – VistaPrint Wallet Card……….. 64
10
List of Appendices
Appendix A – PARIHS Model Permission……… 94
Appendix B – Chronic Care Model Permission……… 95
Appendix C – Human Subjects Determination……….. 96
11
CHAPTER 1 INTRODUCTION
Improving self-care management for patients with high risk, high cost chronic conditions like diabetes, asthma, and congestive heart failure (CHF) is becoming a national priority.
Americans with multiple chronic conditions cost the United States over $2 trillion dollars in healthcare expenditures annually (Ory et al., 2013). Disease prevention efforts and better chronic condition management can help reduce these costs (Kaiser Family Foundation, 2012).
Performing healthy behaviors such as adhering to medication regimens and attending regular clinic visits are important components of effective self-care management. Patient portals are a new mechanism primary care clinics are using to enhance the patient-provider connection and improve self-care management.
The primary goal of this project was to increase patient registration into and use of MyCare, a patient portal within the NextGen electronic health record (EHR) at a Federally Qualified Health Center (FQHC) in Holland, Michigan. The FQHC provides primary care to underserved individuals who primarily have Medicaid or are uninsured. The population of interest were adult, underserved patients of any race who suffered from one or more high risk, uncontrolled chronic illness(es) and had internet access. For the purposes of this project, the term “high risk” was defined as chronic illness such as diabetes, hypertension, chronic obstructive pulmonary disease (COPD), or any other, which was in an uncontrolled state or not meeting guideline recommended parameters for control. These criteria will be explained in the target population section.
12
Scope of the Issue National Data
The prevalence of chronic diseases like diabetes, cardiovascular disease, hypertension, and COPD is on the rise in the United States. As of 2013 according to the Centers for Disease Control and Prevention (CDC), approximately 117 million American adults, nearly half of the total population, suffer from at least one chronic condition (CDC, 2014). This proportion of the population is expected to increase by one percent per year through 2030. Current life expectancy is just below 80 years of age and continues to increase (Murphy, Xu, & Kochanek, 2013). This equates to a larger population of individuals in the U.S. living with chronic disease. In total, deaths from these conditions accounted for 26.7% of all deaths in the United States during 2010-2013 (CDC, 2010-2013).
Diabetes In 2012, the total cost of diabetes care in the U.S. was $245 billion (American Diabetes Association, 2013). This was 41% higher than in 2007. The cost of care per individual with diabetes in 2012 related solely to diabetes was roughly $8,000. The American Diabetes Association (ADA) reported that people with diabetes create healthcare expenditures nearly two to three times what those without diabetes incur. Data from the CDC show the prevalence of diabetes in adults in the U.S. has tripled from 1980 to 2013 (CDC, 2013). Of the top ten leading causes of death as of 2012, diabetes ranked seventh nationally (CDC). Optimum diabetes management involves close follow-up in the primary care clinic, often quarterly, since tight glycemic control is difficult to accomplish (ADA, 2014).
Chronic Obstructive Pulmonary Disease The primary cause of COPD is years of
smoking. This damages the small airways and alveoli in the lungs rendering them less efficient. Although smoking rates are decreasing in the United States, COPD is still a major health concern
13
(Vestbo et al., 2013). As of 2013, chronic respiratory disease ranked fourth out of the top ten causes of death (CDC, 2013). COPD costs, although not nearly as burdensome as diabetes, are expected to increase to $49 billion by 2020 (Ford et al., 2014). The Global Initiative for Chronic Obstructive Lung Disease (GOLD) guidelines (2013) state that proper management of COPD involves managing acute exacerbations (Vestbo). This requires diligent, close communication between providers and patients; and increased patient self-awareness of disease processes and when to seek treatment. The use of patient portals may help this by improving communication through secure messaging.
Cardiovascular Disease and Hypertension The number one cause of death in adults aged 18 years and older from 2005-2010 in the U.S. was related to some form of heart disease (CDC, 2013). Heidenreich et al. (2011) of the American Heart Association predicted that healthcare costs related to cardiovascular disease would triple to $818 billion by the year 2030.
Hypertension is a leading cause of heart disease. Roughly 80% of Michigan adults were on an antihypertensive in 2010 (CDC). The Eighth Joint National Committee on Hypertension (JNC8) recommended that blood pressure be controlled to less than 150/90 mmHg in all adults (James et al., 2014). This often takes multiple antihypertensive agents and frequent visits to manage
successfully. Here again, close communication between providers and patients on side effects of medications and blood pressure reporting can be augmented by the use of a patient portal.
The improved control of diabetes, COPD, cardiovascular disease, and other financially burdensome diseases, can save large amounts of taxpayer dollars. These conditions, in uncontrolled states, are very common in the clinical setting and can become better managed through the use of patient portals. Improved communication and the use of reminders through portals may be helpful to decrease problems with lack of follow-up visits in primary care, and
14
shorten the length of time it takes to get these problems under control. This will be discussed further in the section on portals.
Michigan Data
Of all preventable hospitalizations in Michigan in 2013; heart disease, COPD, and diabetes accounted for 28.8% (MDCH, 2013). Nearly 10% of adults in Michigan had been diagnosed with diabetes alone in 2013 (MDCH). In 2015, 13% of Michigan residents had no health insurance (Population Health Institute, 2015) and 15.7% lived below the poverty line (CDC, 2013). Michigan ranks 34th nationally in state health status (United Health Foundation, 2013) and nearly 2.3 million Michigan residents are covered by Medicaid only (Kaiser Family
Foundation, 2010). In Ottawa County, Hispanic adults make up 9.5% of the population, of which over 10% consider themselves of fair to poor health status (Ottawa County Health Department, 2014).
The FQHC in Holland, Michigan cares for an underserved patient population. Education and income levels are often low. Hispanic adults with less than a high school education make up a staggering 33% of the Michigan population, while low education rates among Caucasians in Michigan are only 9.7% (Michigan Department of Health and Human Services, 2013). The African American rate exists between these two groups with 18.1% having less than a high school diploma. The median annual household income for Hispanics through 2010 was $38,049, Caucasians $50,265, and African Americans $30,047 (MDHHS). Translating these numbers to the federal poverty level, 27.5% of Hispanics, 11.7% of Caucasians, and 32.7% of African Americans lived below the poverty line through 2010 (MDHHS). Self-care management is often poor among this population as survival and financial concerns are often more immediate.
15
Uninsured and Underserved
The uninsured represent 15% (46 million) of the U.S. population and are less likely to have a medical home or a usual source of care when compared to those with insurance (DeNavas-Walt, Proctor, & Smith, 2008). Uninsured patients are also more likely to experience poorer outcomes than those with the same condition who are insured (Institutes of Medicine, 2009). Uninsured Hispanics and African Americans, or those who have Medicaid that live in medically underserved areas, experience a higher rate of preventable hospitalizations than well-insured individuals (Oster & Bindman, 2003).
Ambulatory care sensitive conditions (ACSCs) are conditions that high-quality primary care can affect to prevent hospitalizations or complications from severe disease (Agency for Healthcare Research and Quality, 2001). ACSCs such as diabetes, asthma, and CHF cause a great deal of preventable hospitalizations through emergency departments for patients who do not routinely utilize primary care services. In Michigan, 20.1% of all hospitalizations in 2012 were considered preventable had patients’ chronic health conditions been better managed in the ambulatory care setting (MDCH, 2013).
Data from the National Hospital Ambulatory Medical Care Survey from 2006-2009, show that uninsured patients account for 16.6% of U.S. emergency department visits annually
(Carlson, Menegazzi, & Callaway, 2013). That is roughly 20 million per year or 1 in every 6 visits. These patients receive fewer diagnostic tests and procedures than those with insurance. These authors were able to demonstrate that despite receiving fewer diagnostic tests, uninsured patients experienced the same hospitalization rates as those who were insured. The significance of this finding is unclear. What is clear is that activated patients, those who have the knowledge, confidence, and skill to manage their own health care, experience improved health outcomes
16
(Greene & Hibbard, 2012). Moving patients toward being “activated” is a tremendous challenge however, especially among underserved populations. Patient portals are intended to help activate patients toward improved self-care management.
Self-Care Management
The Agency for Healthcare Research and Quality (AHRQ) defines self-management support as the support given to patients to help them manage chronic conditions on a daily basis (AHRQ, 2014). The vision is that care should remain patient-centered; patients utilizing their healthcare team to set goals and make healthy choices. This approach should lead to better self-care management and improved health for patients. Providers are expected to improve follow-up communication with patients through email, text messaging, or mailings to facilitate patients’ continued self-care management. As a result, these actions should contribute to improved healthcare quality outcomes and patient and provider satisfaction. A true partnership between providers and patients will help patients build the confidence and skills they need to lead active, fulfilling lives. Unfortunately, this partnership does not occur in many instances and many patients lack understanding of their plan of care. As a result, they do not participate fully in their own health care decisions.
The AHRQ delineates a number of ways self-care management can be effectively supported by a primary care clinic. Methods which could prove beneficial include: (a) using actionable, understandable teaching tools; (b) gathering clinical data prior to a visit; (c) setting an agenda for the visit; (d) helping patients set healthy goals; and (e) tracking health outcomes. Patient portals have been developed to facilitate some of these concepts.
17
Patient Portals
HealthIT.gov (2014) defines a patient portal as a secure online website that gives patients convenient 24 hour access to personal health information from anywhere with an internet connection. Although patient portals have existed in some fashion since 1990, the Health Information Technology for Economic and Clinical Health (HITECH) Act of 2009, part of the American Recovery and Reinvestment Act (ARRA) economic stimulus bill of 2009, spurred on portal growth (HITECH Act, 2009). The HITECH Act was intended to promote the adoption and meaningful use of health information technology. Portals can be used by patients to schedule appointments, send secure messages to their providers, request medication refills, review lab and test results, make payments, and other activities. The Federal Communications Commission (FCC) proposed the “overarching goal that by 2017 mHealth, wireless health and e-Care
solutions will be routinely available as part of best practices for medical care” (FCC, 2012, p. 1). These concepts relate to mobile interfaces, like smartphones or tablets, and involve telehealth innovations that improve remote access to care.
Meaningful Use
The use of patient portals has been encouraged by the Centers for Medicare and Medicaid Services (CMS) mandate that ambulatory care practices achieve “meaningful use” (MU) of certified electronic health records by 2015 (HealthIT.gov, 2014). Meaningful use involves using certified electronic health record technologies to achieve health and efficiency goals by engaging patients and families in their care, and improving care coordination and population health. This is congruent as well with the Institute for Healthcare Improvement (IHI) Triple Aim to improve the patient experience of care, improve population health outcomes, and reduce healthcare costs (IHI, 2014).
18
The final rule for stage two MU attestation criteria was published by CMS in August 2012 (CMS, 2012). Eligible providers who wish to attest to stage two MU must meet 20 core
objectives. These are divided among five patient-centered domains: (a) improving quality, safety, and efficiency; (b) engaging patients and families; (c) improving care coordination; (d)
improving public and population health; and (e) ensuring privacy and security of personal health information (HealthIT.gov, 2014). Examples of these core objectives include: (a) e-prescribing, (b) recording smoking status, (c) problem lists, (d) clinical summaries, (e) transmitting health information, (f) secure electronic messaging, and several others. As of April 2015, roughly half of all eligible providers in the U.S. had attested successfully to stage one MU but very few had attested to stage two criteria (Office of the National Coordinator, 2015). E-prescribing is simply sending of prescriptions electronically by providers to pharmacies.
Looking beyond stage two meaningful use, stage three meaningful use may rely heavily on portal involvement to improve quality and increase data sharing (Andrews, 2015). As of August, 2015, CMS had not considered requesting public comment on stage three. The chairman of the Senate Health Policy Committee, Lamar Alexander, had called for a halt to stage three planning because most providers still had not successfully attested to stage two criteria (Health IT
Exchange, 2015).
Financial Incentives
The CMS vision is that EHRs will help achieve improved health outcomes and efficiency goals and reduce health disparities through more intentional involvement of patients in their own health care (HealthIT.gov, 2014). This is done by eligible providers “attesting” to core measures of MU in three separate stages, each stage building upon the last. Eligible providers that do not engage in MU will eventually face a financial penalty of decreased Medicare reimbursement, 1%
19
per year to a maximum of 5% reduction. Those who do attest to stages of MU will receive as much as $44,000 per provider from Medicare and up to $63,750 from Medicaid. Clearly this is a large financial incentive to comply with CMS requirements.
The Clinic
The FQHC in Holland, Michigan, is currently working to achieve stage two requirements. Their certified electronic health record technology is called NextGen and their patient portal is called MyCare. All stage two meaningful use core measure requirements had been met at the time of this project except the two specific measures dealing with portals: 7 and 17. These core measures involved providing patients with the ability to view, download, and transmit health information; and the use of secure electronic messaging to communicate with patients. These two criteria were the final measures the clinic needed to meet to be able to successfully attest to stage two MU requirements. The target set by CMS was that 50% of all prevalent patients in a practice will enroll in a patient portal (Measure 7) and that 5% of these patients will communicate with their provider via secure message at least once (Measure 17).
Assisting the clinic to achieve these measures was a potential avenue to increase
stakeholder acceptance of this project. The MyCare patient portal is specifically designed to be able to address these measures. Strategies for optimizing patient adoption and use of portals and meeting meaningful use requirements have been described by the HealthIT.gov website
(HealthIT.gov, 2013). Among the important concepts to consider is that active promotion of patient use of a portal and facilitation of registration by providers is a key ingredient to patient adoption. The positive effects of portal acceptance include: (a) improved patient activation; b) more effective, efficient communication; (c) timely self-care; (d) the ability to focus on high-risk patients; and (e) improved patient satisfaction. Achieving MU and optimization of patient portals
20
is considered to be imperative in achieving patient-centered medical home status (HealthIT.gov, 2014).
Patient-Centered Medical Home
The concept of a medical home is the idea, rather than an actual place, of a centralized care center in which a patient’s primary care provider is the first point of contact for all health related issues. The medical home maintains all records for the patient, primarily electronically; organizes and coordinates other needed types of care; focuses on holism and prevention of disease; and attempts to improve access by expanded hours and connection with providers through media such as email or text message. This is an innovative attempt by Congress to address the issues of access to health care and rising costs without compromising quality by streamlining and organizing health care delivery.
According to Schram (2012), the patient-centered medical home (PCMH) concept began as an attempt by the American Academy of Pediatrics (AAP) to coordinate care for children with special needs. It was refined in 2007 by the AAP, the American Academy of Family Practice, the American College of Physicians, and the American Osteopathic Association to include seven joint principles: (a) a personal physician; (b) care directed by a personal physician; (c) coordination of care, quality, and safety; (d) enhanced access; (e) a holistic focus; and (f) different reimbursement structures that reflect modernization rather than the standard fee-for-service model.
Patients and their families stand to benefit from streamlined provision of services and improved and increased access to primary care. Streamlined care and improved access fits well with the federal mandate for insurance coverage for all per the Affordable Care Act (ACA) guidelines. As the levels of the uninsured decrease, the public should reap the reward through the
21
PCMH model. Health care costs should decrease from improved chronic condition management and fewer people accessing the system at more critically ill stages.
The FQHC in Holland, Michigan has attained patient-centered medical home (PCMH) status, granted by the National Committee for Quality Assurance (NCQA). The NCQA is a non-profit agency that is a hub for accreditation and certification of medical homes as they promote extensive programs in which providers can participate to demonstrate their commitment to quality outcomes. The NCQA provides standards, guidelines, and survey tools to assist providers with enrollment in a medical home pilot program (National Committee for Quality Assurance, 2011). One of the NCQA requirements to become a full-fledged PCMH is the presence of a functional EHR. As stated, the NextGen EHR has been employed by the clinic since November, 2011 and the MyCare patient portal as of February, 2014.
Targeted Population
The Health Resources and Services Administration, a division of the U.S. Department of Health and Human Services (USDHHS), designates Medically Underserved Areas/Populations (MUA/P) as having too few primary care providers, high infant mortality, high poverty, and/or high elderly population. Many in MUP are either not insured or have government insurance, primarily Medicaid. Parts of Ottawa County qualify as a MUA and the FQHC in this
underserved area services a high percentage of the medically underserved population. This population is transient in nature and the general milieu of care is one of crisis, episodic care; not one of routine, chronic disease management.
The FQHC in Holland, Michigan is designated as one of the clinics serving a medically underserved population (USDHHS, 2012). As a PCMH, one of the clinic’s stated goals is to utilize existing informatics technologies to improve care management processes and the
22
provider-patient relationship. The clinic plans to accomplish this goal and maintain PCMH status through the use of their certified electronic health record NextGen. Fortunately, this EHR has its own patient portal incorporated within it. This is not always the case with EHRs.
Lack of patient follow through and poor self-care management are two primary frustrations of Dr. Peter Christensen, a family physician at the clinic. Dr. Christensen had been trying to develop a “recall list” to more effectively manage patients with chronic conditions (personal communication, October 27, 2014). Some primary care providers are able to generate patient lists through their EHRs of patients who have not scheduled routine screening and preventive visits to manage their chronic conditions. Staff can then contact patients to schedule
appointments. This has not been successful according to Dr. Christensen as staff members have not had time to operationalize this follow-up (personal communication, October 27, 2014).
Examples of patients’ uncontrolled chronic conditions are those that do not meet guideline-recommended parameters. For example, the American Diabetes Association recommends most patients achieve a target hemoglobin A1C level of less than 7.0% (ADA, 2014). Patients who do not meet this criterion would be considered to have an uncontrolled, high-risk chronic condition. In the same way, new guidelines from the Eighth Joint National Committee (JNC8) recommend a target blood pressure of under 140/90 mmHg for those diagnosed with hypertension (James et al., 2014). Patients that do not meet this goal have uncontrolled hypertension and are at higher risk for cardiovascular complications than patients with controlled blood pressure.
The same type of evaluative criteria can be applied for a host of other conditions such as thyroid disease, coagulopathies, and others. Since so many of Dr. Christensen’s patients had uncontrolled pain and comprise the highest number of visits per year for medication refill
23
requests, these patients were included as a high-risk population as well (personal communication, December 1, 2014). These patients may in fact prove to be the highest users of MyCare to
communicate with their providers and requesting refills. Yet, the specific diagnosis was not important for this project, only whether or not the patient was in an uncontrolled state or had multi-morbidity. This will be discussed further in Chapter Four: Methods. The FQHC was the primary care clinic of interest for implementation of this new care management process.
Proposed Clinical Intervention
The proposed clinical intervention to address care management in this population was a process improvement intervention using the MyCare patient portal at the FQHC clinic. Knee-to-knee demonstration of the portal to patients at the end of clinic visits was coupled with
immediate enrollment. The primary outcome measure was whether this method would increase portal use rates. Secondary measures included the time required for the demonstration and whether any demographic group of participant was more likely to use the portal than another. The MyCare portal was available both by computer and smartphone interface according to patient preference and accessibility. Amante, Hogan, Pagoto, and English (2014) claimed that minority patients with lower education and income levels are more likely to utilize smartphones as their main means of connecting to the internet.
The emerging term, mHealth, is broadly defined as the support of medical and health practices by mobile devices (Tomlinson, Rotheram-Borus, Swartz, & Tsai, 2013). The Federal Communications Commission (FCC) proposed the “overarching goal that by 2017 mHealth, wireless health and e-Care solutions will be routinely available as part of best practices for medical care” (FCC, 2012, p. 1).
24
Garside (2012) wrote that, “the number of devices connected to mobile phone networks will overtake the number of people on Earth within five years” (para 1). A 2011 report predicted there would be an increase in the numbers of downloads of health applications (apps) to mobile devices from 44 million in 2012 to 142 million by 2016 (iHealth Beat, 2011). A higher
percentage of Hispanics and African-Americans in the United States own cell phones than Caucasians, which is perhaps unexpected (Fox & Duggan, 2012). As of May 2013, the
prevalence of smartphone ownership overall had eclipsed that of basic phones; three out of five Americans then owned one (Smith, 2013). One study found 70.7% of nearly 250 homeless emergency department patients in Connecticut owned smartphones (Post et al., 2013).
Health-related, smartphone apps are becoming ubiquitous in the market today but only very recently, the phenomenon of incorporating care management strategies into app technology is becoming apparent. In a webinar presentation through the Health Information and Management Systems Society, Ranney (2014) reported 90% of high-risk patients desire a tech-based platform to improve their health, 50% expect mHealth to help them manage chronic conditions, and 9% had already used text-based, health-related reminders. The challenge for the future, as presented in the webinar, is to develop an evidence base for this type of technology outside of randomized, controlled trials in a real-life clinical setting, and devise ways to increase acceptability by
providers by integrating these interventions into the clinical workflow.
The FQHC employed three physicians, two nurse practitioners, and one physician assistant in addition to many support staff. Staff at the clinic were informed of the intent of the project. Most closely associated with it was one of the leading physicians, Dr. Peter Christensen, and the project director (Jon Gibson BSN, Doctor of Nursing Practice (DNP) student at Grand Valley
25
State University) along with selected administrative support personnel which included medical assistants and medical records staff.
Outcome measures of interest were, primarily, whether MyCare enrollment and use could be successfully increased at the clinic and secondarily, the amount of time needed to demonstrate the portal and register patients on site. The long-term goal beyond this demonstration project was that through portal use, patients will improve in self-care management by being more active participants in their care and employing healthy behaviors such as attending clinic visits more frequently.
Potential Result of the Project
Wagner’s Chronic Care Model provided the theoretical basis for the intervention and is discussed in Chapter Three: Conceptual Framework. Whether or not the technique for improved MyCare enrollment was successfully implemented at the clinic was be the primary outcome as suggested by the Promoting Action on Research Implementation in Health Services (PARIHS) framework. Successful implementation is a concept within the PARIHS framework that represents the function of interactions between evidence, context, and facilitation. This is discussed in more detail in Chapter Four: Methods. Successful implementation of MyCare involved the realization and uptake of the innovation into clinical practice as measured by actual use, clinician perception of value and usefulness, and the modifications that were made to the innovation to enhance or bypass barriers.
The next chapter focuses on the demographics and characteristics of patients who use portals, efficacy of patient portals to improve self-care management, and strategies that have been attempted by clinics to increase patient adoption and acceptance of portals. A gap in portal use was discovered in that underserved individuals with lower socioeconomic status utilize
26
portals least frequently (Ancker et al., 2011; Goel et al., 2011; Lyles et al., 2013; Osborn, Mayberry, Wallston, Johnson, & Elasy, 2013; Ronda, Dijkhorst-Oei, Gorter, Beulens, & Rutten, 2013; Sarker et al., 2010). This made the FQHC in Holland, Michigan an ideal venue to attempt an intervention which could address this disparity because the population of patients fits the description of those who would be least likely to use MyCare.
27
CHAPTER 2 LITERATURE REVIEW
Literature Regarding Patient Portals
The phenomenon of patient portals is relatively new. The Health Information Technology for Economic and Clinical Health (HITECH) Act of 2009 was intended to promote adoption and use of electronic health records. Through the HITECH Act, CMS developed criteria by which providers could prove “meaningful use” of certified electronic health record technology (CEHRT) in stages resulting in significant financial incentive (HealthIT.gov, 2014). As
discussed in the introduction, patient portals were necessary to achieving meaningful use stage two requirements for CMS, which the FQHC in Holland, Michigan was attempting to do. Portals are secure online websites patients can access 24 hours a day that facilitate self-care management by allowing access to providers via secure messaging, appointment scheduling, medication refill requests, and online medical record viewing, among other features (HealthIT.gov, 2014).
Improving and increasing patient-centered care was the impetus behind the CMS promotion of patient portals. This chapter will provide a review of the current state of the science relative to patient portal efficacy, characteristics of patients that use them, and strategies for processes attempted at the primary clinic level to improve patient uptake or portals.
Search Methods
The strategy for this review involved searching the Cumulative Index to Nursing and Allied Health Literature (CINAHL), MEDLINE (Web of Science), PubMed, PsychInfo, Cochrane, grey literature (Mednar), and Google Scholar databases for all studies in English related to patient portals and improving their adoption or uptake. Searching was limited to
28
studies from 2010 to the end of the literature search in 2015 since the most relevant literature regarding portals seemed to begin in 2010. Keywords and combinations of keywords used in the search were patient, portal, improve, effect*, impact, demonstrate, and adopt. Over 150,000 citations in total throughout these databases resulted from the term “patient portal.”
The use of the word “patient” clearly influenced the number of articles so when the term “patient portal” was specified, the most relevant articles climbed to the top of the searches. Despite thousands of results from this type of search, the number of articles specifically reflecting the term “patient portal” diminished quickly in each database, making the process simpler. Abstracts were scanned according to the inclusion and exclusion criteria listed below. In addition, manually searching reference lists of selected articles led to a final count of 19 articles, 4 of which were systematic reviews.
Inclusion criteria were broad, encompassing any studies related to patient portals. Systematic reviews that evaluated randomized controlled trials (RCTs) were desired although other designs were not excluded. The goal was to find studies outlining the characteristics of patients who use portals and interventions that had been attempted to improve their acceptance, as well as to discover if the use of portals had been successful in helping manage chronic conditions. Studies involving underserved populations were important to find due to the relevance to the population in question for this project. Broad inclusion criteria allowed for flexibility and prevented overlooking studies that may have shown the use of portals to be successful in managing chronic disease.
Literature was excluded if the intervention did not involve at least some relation to patient portals and increasing their use, or their effect on chronic disease management. The newness of the technology acted as a self-limiting criterion as data were limited regarding portal
29
use until well into the 2000s. Studies were organized into categories reflecting characteristics of portal users, techniques to attempt improved enrollment, and overall effects of patient portals.
Critical Appraisal
Systematic reviews were evaluated for quality using the Assessing the Methodological Quality of Systematic Reviews (AMSTAR) tool developed by Shea et al. (2007). This tool scores systematic reviews across 11 items found to have face validity according to Shea et al. (2009). These items evaluate study quality related to design, literature search, methodology, and biases. All 11 items are answered with either yes, no, cannot answer, or not applicable. The 11 items are presented below. Interrater reliability between two reviewers among the individual AMSTAR tool items achieved a mean kappa of 0.70 (95% confidence interval [CI]: 0.57, 0.83) with an intraclass correlation coefficient of 0.84 (95% CI: 0.65, 0.92).
AMSTAR Criteria
1. Was an “a priori” design provided?
2. Was there duplicate study selection and data extraction? 3. Was a comprehensive literature search performed?
4. Was the status of publication (i.e. grey literature) used as an inclusion criterion? 5. Was a list of studies (included and excluded) provided?
6. Were the characteristics of the included studies provided?
7. Was the scientific quality of the included studies assessed and documented? 8. Was the scientific quality of the included studies used appropriately in formulating
conclusions?
9. Were the methods used to combine the findings of studies appropriate? 10.Was the likelihood of publication bias assessed?
30
11.Was the conflict of interest included?
Two of the four studies scored well, over 6 (Ammenwerth, Schnell-Inderst, & Hoerbst, 2012; Goldzweig et al., 2013), the other two scored 6 or less (Amante, Hogan, Pagoto, &
English, 2014; Otte-Trojel, de Bont, Rundall, & van de Klundert, 2014). Limitations reported by studies generally involved heterogeneity of patient populations, interventions, and outcome measures. A variety of methodologies including RCTs are represented in this literature review, as well as several qualitative studies. However, only four studies specifically reference a population similar to the one at the clinic (Dhanireddy et al., 2012; Goldzweig et al., 2013; Sanders et al., 2013; Schickedanz et al., 2013).
Results Characteristics of Portal Users
The eleven studies presented in this section involved demographic characteristics of populations that have traditionally accepted patient portals to a higher degree. In general, these studies reveal Caucasian patients who are of a higher socioeconomic status tend to be more motivated to use patient portals. This reveals a gap in the use of portals for a large percentage of Americans who are underserved and could benefit a great deal from use of a portal.
Osborn, Mayberry, Wallston, Johnson, and Elasy (2013) observed 75 adults with type 2 diabetes to identify differences between portal users and non-users, frequency of portal use, and any effect of portal use on glycemic control. How and why patients used the portal was assessed qualitatively. Portal users were most often Caucasian (62.7%), privately insured (78.7%), and had annual incomes over $60,000 (42.1%). These differences in characteristics were all highly significant (p < .01). This presents a significant gap in engagement for those with chronic conditions who may need the most healthcare assistance, namely lower income, underserved
31
patients with no or limited insurance. No difference was found in hemoglobin A1C between portal users and non-users but hemoglobin A1C did show improvement within the portal use group (p = 0.02). Specific A1C measurements were not reported although most (62%) were already less than 7.0%. Features of the portals that non-users were most interested in employing included secure messaging to schedule appointments, and viewing protected health information such as lab tests and medication lists. Users most frequently reported the ability to request online medication refills as of value.
One of the largest and most successful patient portals in terms of patient and provider satisfaction in the United States exists within the Kaiser Permanente system in California. Sarker et al. (2010) utilized the records of over 14,000 patients of diverse ethnic backgrounds with type 2 diabetes, to examine the relationship between health literacy and use of patient portals. Only 28% of the sample reported ethnicity as non-Hispanic white. Participants were surveyed
regarding their experience signing on to their portal combined with health literacy scores from a validated tool measuring problems with reading, understanding, and filling out forms (Chew, Bradley, & Boyko, 2004; Chew et al. 2008). Those with self-reported limited health literacy (scoring ≤14 out of 15 throughout the 3 problems) had higher odds of never registering for their
portal (OR = 1.7). Even among registered portal users, limited health literacy was significantly associated with never signing on to the portal (OR = 1.4).
One of the major contributions of this study is that it parsed out the proportion of participants who engaged in each step in the portal process: (a) registration, (b) logon, and (c) use of each of the features like emailing providers, requesting medication refills, scheduling appointments, and viewing medical records. Despite limitations in health literacy, 40% (n = 5671) of participants did register for the portal and 76% (n = 4311) of the 5671 participants went
32
on to logon and become active users. Viewing medical records was the most frequent portal feature used; followed by medication refill requests, emailing providers, and scheduling appointments.
Lyles et al. (2013) conducted a secondary analysis of the data collected by Sarkar et al. (2010) of over 14,000 diabetic patients to determine levels of trust in providers. Trust was
measured using a single, validated item in the Trust in Provider scale developed by Thom, Ribisl, Stewart, and Luke (1999). In this study of Latinos, Caucasians, African Americans, and Asians; Latinos were noted to use patient portals most when levels of trust in the provider were high (RR = 1.51). Trust in provider influences overall secure messaging use as well in Caucasians (RR = 1.29) although this relationship is much less so for other races (RR = 0.55).
These findings suggest a lack of uniformity across demographic groups in the influence that trust in the provider has toward portal use. The Consumer Assessment of Healthcare Providers and Systems (CAHPS) survey was also used to measure overall patient-provider communication and levels of provider listening, respect, explaining things well, and spending enough time with patients. Overall ratings were high, the mean score being 81 out of 100. Lyles et al. (2013) also mentioned that providers who engage in high rates of secure messaging and encourage their patients to use their portal influence portal use rates. Despite the aggressive push from Kaiser for patients to adopt their portal, the digital divide exists between individuals with lower or higher socioeconomic status in rates of portal acceptance. Since this study was cross-sectional, relationships of high trust and communication leading to portal use, or vice-versa, were found, but causality could not be established.
In a 2-year study using data from the Institute for Family Health of over 74,000 patients, Ancker et al. (2011) reported similar findings. Caucasians with higher levels of income,
33
education, and better insurance made use of a patient portal more than minorities of a lower socioeconomic status (p < .05). Interestingly, only 16% (n = 11,903) of participants had received a portal access code from their provider, and 60% (n = 7138) of these went on to register.
Multivariate logistic regression revealed that women who were white, insured, and English speaking, with more chronic conditions, were most likely to receive access codes for the portal (OR = 1.06, 1.60, 4.10, 2.80, 1.15 respectively).
Barriers to enrolling in a patient portal were assessed by phone interviews of 159 patients of an urban internal medicine clinic who had not enrolled within 30 days of invitation to do so (Goel et al., 2011). Nearly three-quarters of participants were female and had a college
education; half were black; and the average age was 51 years. Sixty-three percent reported a lack of information or motivation and thirty percent stated they had a negative view of portals. After adjusting for age, gender, education, and chronic disease state, blacks were less likely than whites to value the self-management features of portals (p < 0.05). These authors suggested ensuring patients understand the features of a portal and that attitudes toward the technology should be addressed.
Four focus groups of urban patients (N = 30) in Boston involving a wide variety of demographics were interviewed to gauge attitudes toward having access to their medical record through a portal (Dhanireddy et al., 2012). Patients in this qualitative study reported an
overwhelmingly positive response to the concept of online access to their records. Negative themes identified by the focus groups included: (a) cynicism toward full transparency of their providers, (b) privacy and security concerns, (c) increasing the clinician’s workload, and (d) technology replacing face-to-face contact. Several patients also expressed fear of knowing what was actually in the record. Nevertheless, several positive themes identified by the patient groups
34
included a sense of empowerment, an enhanced understanding of health, convenience, and a bolstered relationship with their providers. These patients felt a portal would stimulate interest in better self-care management. Despite a small sample size, this study involved a vulnerable, urban population with chronic illness, which is similar to that of this project’s target population.
Amante et al. (2014) systematically reviewed 16 articles evaluating characteristics, barriers, and facilitators related to portal enrollment and use among diabetic patients identified between 2005 and 2014. Nine studies were quantitative, three were qualitative, and four were mixed-method studies with a total sample size of N = 59,303. This review scored 6 out of 11 using AMSTAR criteria. Patients enrolled in and utilized portals more frequently when providers encouraged and engaged patients in portal use. Notable barriers to enrollment and utilization from the patient perspective included a lack of awareness of the availability and functionality of the portal, and limited buy-in to the benefits of portals by providers and patients. Other notable factors included inadequate internet access and difficulty manipulating technology. Regarding a face-to-face demonstration of a patient portal coupled with immediate registration, the authors concluded, “leveraging teachable moments and using time spent in waiting rooms to introduce and educate patients with diabetes on portal technology create potential to improve the quality and efficiency of care” (p. 791).
Underserved patients’ attitudes toward email communication with providers were assessed by interviewing 408 patients of safety net provider clinics in San Francisco whose median annual income was less than $20,000 (Schickedanz et al. 2013). The clinics were all FQHCs. Seventy-one percent of respondents indicated they were interested in using email to communicate with their providers, yet only nineteen percent of these who expressed interest reported having used email to correspond with their providers. Even among the small percentage of patients who did
35
not use email, 40% (n = 22) stated they would use email to communicate with providers if it were available to them. This demonstrates an unmet need. Another theme in this study, as in others, was that participants felt email contact would increase the burden on healthcare workers and the face-to-face visit would suffer. Differences among racial lines in this study were
consistent with the other studies reported in this literature review. Nearly all the patients
interviewed indicated they would like to receive health-related text message reminders. Training for patients who may not be at ease with technology was recommended as a strategy which could be beneficial in improving email communication. The authors reported that access to internet and email would not likely be a primary barrier to adopting web-based communication strategies in this population.
Through their surveys of 654 patients in seven safety net practices in Rochester, New York, Sanders et al. (2013) found that race was not associated with interest in portal use. Internet use was the most influential factor for portal interest. Almost half, 45.2% (n = 295), of all
respondents used the internet daily on their own computers and 47.7% (n = 312) reported they were not interested. Obtaining test results online received the highest interest among 84% (n = 550) of respondents, followed closely by requesting medication refills (82%, n = 537), and scheduling appointments (70%, n = 458). A large proportion of individuals, 62% (n = 405), stated they were interested in having their provider demonstrate how to communicate via the portal. Those with moderate interest in internet use were nearly three times as likely to exhibit portal interest (OR = 2.7) as those with low internet use, while those with high internet interest were almost 10 times as likely to desire using a portal (OR = 10.07). Therefore, if almost half of underserved patients use the internet on a daily basis, there seems to be a high likelihood they will use a patient portal as well.
36
Nearly 13,000 people with diabetes within 62 primary care practices in the Netherlands were sent questionnaires between 2011 and 2012 to gauge diabetes care self-management among those who had requested a login to their portal, compared with those who had not (Ronda, Dijkhorst-Oei, Gorter, Beulens, & Rutten, 2013). Data were analyzed from 1,390 respondents according to several criteria: (a) satisfaction with diabetes care, (b) diabetes-specific distress, (c) health status, (d) diabetes knowledge, and (e) self-efficacy. As might be expected, younger, more highly educated patients who had working knowledge of diabetes, greater perception of diabetes burden, and higher self-efficacy levels, requested a login most frequently (p < .001). The
disparities gap in use of portals for self-management of chronic disease is evident in this study as underserved patients may be less motivated to manage their conditions well.
Effect of Portals
The next five articles help define the contribution of patient portals toward improving preventive care and overall outcomes. Overall, it appears that patients do appreciate being able to utilize portals to manage their own care and maintain it with regularity as opposed to an episodic, transient nature. However, initial evidence is equivocal and more research is needed to truly understand the effect of portals on healthcare in general.
Patient portals can improve the outcomes of uncontrolled, chronic conditions through a variety of mechanisms. Otte-Trojel et al. (2014) performed a systematic review of 32 articles from 2003 to 2013 evaluating patient portals. These included 18 randomized, controlled trials (RCTs). The authors’ claim was that a “realist review method” would help to discover how, for whom, and in what circumstance patient portals work. However, this review was of mediocre quality, scoring only 5 out of 11 AMSTAR criteria. Of the RCTs, 15 demonstrated positive effects of portal use on clinical outcomes, adherence to treatment, provider-patient
37
communication, patient empowerment, and patient satisfaction. There were four mechanisms the authors cited which seemed to be responsible for the improvements: (a) patient insight into their information, (b) the activation of said information such as through the use of reminders, (c) continuity of care, and (d) convenience.
There were no adverse consequences found through implementation of portals, although in terms of quality, the strength and consistency of positive effects in some of the studies was suspect (Otte-Trojel et al., 2014). Higher rates of healthcare utilization were seen, suggesting that patients may seek to manage their conditions more proactively and in a preventive fashion, as opposed to episodic care. Regarding the appropriateness of portal use in underserved
populations, the authors wrote, “paradoxically, patient portals may have higher impact in more fragmented contexts that are less conducive to patient portal implementation and use” (p. 756).
A systematic review of the impact of portals on patient care revealed 4 pertinent controlled studies out of a potential sample of 1,306 articles from 1990-2011 (Ammenwerth et al., 2012). The authors reported surprise that there were so few studies, given that portals have been in use for some time. The only exclusionary criterion was that the CEHRT had to allow patient access to medical records. No meta-analysis was completed because of heterogeneity in outcome measures. This study scored 9 out of 11 using AMSTAR criteria. Improvement in health outcomes was not found to be significantly different between portal and control groups. Endpoints that were significant included: (a) a decrease in clinic visits and phone calls from patients, (b) an increase in the number of messages received, and (c) better adherence to treatment.
Yet another systematic review involved 14 RCTs, in addition to 32 articles employing other study methods. This review provided mixed evidence for the effect of portals on outcomes
38
and patient satisfaction, likely due to the newness of the technology (Goldzweig et al., 2013). No meta-analysis was completed because of variability in portal capabilities and heterogeneous results. Instead, groups of articles were described. This study scored 8 out of 11 using AMSTAR criteria. The authors claimed more time and experience with the use of portals is necessary to truly evaluate their effects on health outcomes. High-quality studies that did show improvement in diabetes, hypertension, and depression combined portal use with care management. Use of portals was consistent with other studies that show patients of ethnic minority background with lower education levels use portals less often. However, the authors did note a higher level of use by those with multiple chronic conditions. Low patient-perceived value in portals remains a barrier to enrollment and use. Very little information was found by these authors to indicate that the methods practices have employed to date to enroll and engage clients have improved portal enrollment.
In a qualitative study of 17 patients and 64 health care providers, respondents were asked five open-ended questions about their experiences with the same portal (Urowitz et al., 2012). Four themes emerged through questioning: (a) facilitators of disease management; (b) barriers to use such as slow internet access, and the time and difficulty involved in data entry; (c) patient-provider communication; and (d) recommendations for portal improvements. Patients felt the portal helped them make small but important changes in their self-management, such as being motivated to change diet and exercise regimens after seeing blood sugar or weight parameters in their records. The portal itself seemed user-friendly and easy to navigate, but patients did
demonstrate a degree of apathy towards it. Providers reported the use of the portal was time-consuming and there was concern diabetes may not be the right condition to target for
39
health professionals besides physicians: nurses, dieticians, nurse practitioners, and diabetes educators, interacted more frequently with patients than did their physicians, although patients reported they wished they had more contact with their physicians. Physicians believed the portal to be of more benefit to the patients for self-management than for significant provider use. In general, recommendations for improvements in the portal revolved around greater training for patients and support for its use.
In a longer-term study of 422 registered patient portal users over three years, Nagykaldi, Aspy, Chou, and Mold (2012) found more patients received recommended preventive care measures (aspirin use or vaccinations) via the use of reminders from the portal despite having fewer overall visits than a control group who received no reminders (84.4% versus 67.6%, respectively; p < 0.0001). The 13-item Patient Activation Measure developed by Hibbard,
Stockard, Mahoney, and Tusler (2004) and the CAHPS were used to assess patient activation and perception of patient-centeredness of care. Participants in this study were not representative of underserved populations. Only 22% (n = 93) were of an ethnic minority group and 80% (n = 338) had some college education. Yet, this was a RCT of some quality. Most patients found the portal easy to use (90%, n = 380), considered it a valuable resource (83%, n = 351), and thought that it fostered greater participation in their own care (80%, n = 338). This study shows the potential benefit of portals in improving preventive care and patient activation. The length of the study, 3 years, was also beneficial due to the difficulties inherent in measuring portal usage in the short-term.
Techniques for Improved Portal Adoption
The final four articles provide a brief introduction to techniques that have been employed to increase portal use and adoption. There have not been many published studies related to this
40
phenomenon; hence the knowledge gap in understanding how best to implement portals is evident. Some of the marketing tactics that clinics have used to varying levels of success are postcards, brochures, and posters; staff persuasion; videos; emails; and the like. By far, the greatest effect comes from providers encouraging patients to consider use of their portal.
Demonstrating the use of a patient portal by video during an office visit, North et al. (2011) were able to show a higher rate of patient registration into their portal when compared to a paper instruction sheet or no portal promotion (11.7%, 7.1%, and 2.5% respectively; p < .0001). Over 12,000 office visits were included in this analysis and patient portal registration within 45 days was the measurement criterion. These authors compared a group receiving a paper instruction sheet about a portal, a group who watched a video demonstration of a portal, and a control group receiving no portal demonstration. While waiting in the lobby, the video demonstration group watched a two-minute video reflecting the capabilities of the portal. The researchers did not attempt registration at this time but measured enrollment within 45 days after the clinic visit. Nevertheless, the effect persisted six months after the intervention. Those who had seen the video initiated contact with their providers via secure message more often than those who received paper instruction or none (3.5%, 1.2%, 0.75% respectively; p < .0001). Although significant, these are very low percentages, and assisting patients with registration may prove beneficial.
Krist et al. (2014) outlined strategies eight primary care clinics employed to achieve a significant linear increase in portal registrations by 1% monthly over 31 months (p < .001). Some of the workflow changes that showed the most dramatic improvement included a team-based approach. Front office staff stapled information cards to registration sheets, nurses discussed the portal and registration instructions, and clinicians reinforced the importance of the portal. Clinics
41
that relied on providers to increase registrations did poorly. Buy-in of all providers and clinic staff was essential in promoting portal use. The attitude of providers toward the portal was the most significant factor. The most influential hindrance to promoting portals was competing demands for staff time to encourage and educate patients on use of their portals.
Wald (2010) observed four different practice enrollment techniques and found that posters or postcards presented at the time of a patient visit are minimally effective unless coupled with enthusiasm from providers. Staff and provider knowledge and enthusiasm about a portal product impacted patient adoption, as did providers having their own portal account to understand portal features. The most successful of the four practices viewed the portal as critical to the process of care and explained to patients that the portal was an extension of their services, so patients would receive prompt, high-quality service.
A pediatric clinic in Kansas demonstrated their patient portal to 171 adult, parent participants (Ahlers-Schmidt & Nguyen, 2013). Most participants (72%) had not heard of a patient portal prior to the demonstration. Participants were given a demonstration of the patient portal in the waiting room prior to their child’s appointment. There were no details given regarding precisely how the demonstration was presented. The average age of participants was 28 years old and 40% were white, 22% Hispanic. Following demonstration of the portal, 92% of participants reported it was easy to use. Messaging the provider was the most frequently used feature. Parents planned to view the medical records and laboratory results for their children and use the portal in the future (62%).
Synthesis
The available evidence to date appears to indicate that underserved patients of ethnic minority backgrounds, with limited education and low income, are the least likely candidates to
42
use patient portals (Ancker et al.,2011; Lyles et al., 2013; Osborn et al., 2013; Ronda et al., 2013; Sarker et al., 2010; Schickedanz et al., 2013) although Lyles et al. (2013) determined Latinos demonstrate higher levels of trust in their providers. Sanders et al. (2013) did not find a
relationship between race and portal use but instead noted a tenfold increase in the potential to use a portal among those who accessed the internet on a daily basis, regardless of race. Otte-Trojel et al., 2014 claimed that patients in fragmented care settings who are least likely to adopt and use a portal may stand to benefit the most. This finding was echoed in a survey of 76 portal users by the California Healthcare Foundation claiming that patients with chronic conditions and limited education and income were most likely to experience the positive benefits of access to their health information (California Healthcare Foundation, 2010). This adds support to the appropriateness of the targeted population for this project.
As demonstrated in the introduction, FQHC clinic patients in Holland, Michigan qualified as a vulnerable population and were likely to exhibit the highest risk in terms of morbidity, mortality, and expense due to uncontrolled chronic conditions. One caveat to the information presented in this review is that the science was nascent enough that this body of evidence is fairly equivocal. Much work is needed to fully evaluate the influence portals can have on population health. Yet, from the data presented, patients seemed to appreciate being able to email providers, view medical history information, and request medication refills the most; scheduling clinic visits least (Osborn et al., 2013; Sanders et al., 2013; Sarker et al., 2010; Schickedanz et al., 2013). This may be simply because clinic visits take the most time and effort on the part of the patient.
When this project began, portals were viewed as a necessary tool for improving patient-centered care and improving self-care management. The studies presented here were of
43
reasonable quality to provide the evidence that an intervention designed to improve portal enrollment rates among underserved populations would be beneficial to that population. Regarding interventions to increase the use of portals by patients, two studies advocated for provider demonstration of portals (Ahlers-Schmidt & Nguyen, 2013; North et al., 2011) and two cited the importance of provider enthusiasm for a portal as crucial (Krist et al., 2014; Wald, 2010). Unfortunately, there were no studies specifically evaluating the intervention of choice for this project which involved the combined face-to-face demonstration of a portal, coupled with immediate, onsite registration assistance. Nevertheless, sufficient data were available to support that encouragement from providers to use a portal, along with registration assistance and training on how to use it, could be successful.
Relevance to MyCare
The clinical site for this project lacked a uniform method for providing patients with access to the portal other than front office staff mentioning MyCare to patients as they came in to register for their visit. Again, patient characteristics of those most likely to use a portal did not match well with the majority of the underserved population at the clinic. Facilitating the portal registration process for patients and demonstrating portal capabilities was hoped to increase portal use among this population.
The next chapter discusses the theory underlying the MyCare process improvement and the framework selected as a prospective guide to implementation of the intervention into the clinic. The intervention itself was very simple and cost-effective. There was no cost other than the few minutes it took to demonstrate the portal with patients and to help them register.
However, in a busy primary care practice, even a few extra minutes can be burdensome to staff. If face-to-face demonstration with patients can improve enrollment and use of MyCare, the
44
increased staff time may be offset by the incentive money offered by CMS for successful stage two MU attestation. Sustainability of the intervention could then be realized as it would be financially beneficial for the clinic to ensure MyCare demonstration continued.
45
CHAPTER 3
CONCEPTUAL FRAMEWORK
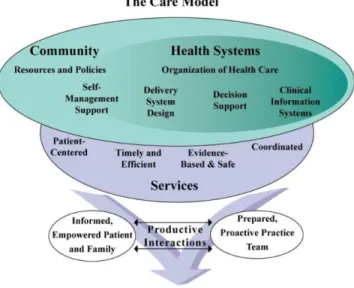
Conceptual and Implementation Frameworks for the Project Wagner’s Chronic Care Model (CCM) and the Promoting Action on Research
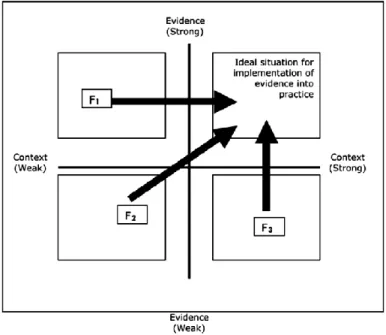
Implementation in Health Services (PARIHS) proposed by Kitson and colleagues in 1998 were used in this project to guide the implementation of the MyCare intervention in the primary care setting. This chapter will discuss how some of the components of the CCM interact to facilitate the improved self-care of activated, informed patients; and how the PARIHS framework
elements work together to promote successful implementation of a care management tool in the primary care setting.
Chronic Care Model History
Wagner’s Chronic Care Model originated through a review of literature in the early 1990s undertaken by the MacColl Institute for Healthcare Innovation (Improving Chronic Illness Care, n.d.). The Robert Wood Johnson Foundation (RWJF) sponsored a 9-month review of the CCM by an advisory panel of experts, comparing elements of the model to chronic illness care management strategies employed throughout the U.S. The CCM was refined and a final
publication was released in 1998. Improving Chronic Illness Care (ICIC) is a program directed by Dr. Wagner through the RWJF which seeks to help health systems implement the CCM to better serve low-income persons. Continuing quality improvement efforts, research, and
dissemination of results pertaining to CCM implementation occur today under the auspices of the ICIC.