Article Type: Research Paper
The Role of Leadership in Improving
Performance Through Organization
Commitment, Motivation and Job
Satisfaction of Village Employees
Lukman Ahmad Imron Pahlawi* and Siti FatonahAbstract: This study aims to analyze the role of leadership in improving performance through organizational commitment, motivation, and job satisfaction of village employees. This research is survey research. This study used primary data. The sample in this study was 100 villages. The sampling technique is using the census method. The data was obtained from the results of the distribution of questionnaires. The analytical tool in this study is regression. The results showed that there is a significant leadership relationship against organizational commitment, motivation, and job satisfaction. Leadership, organizational commitment, motivation, and job satisfaction were substantial to performance. The total R2 of 0.989 indicates the Performance Assessment from the variables of Leadership, Organizational Commitment, Motivation, and Job Satisfaction is 98.9%. Job satisfaction is the most effective variable in improving performance because it has the most significant importance.
Keywords: Leadership; Organizational Commitment; Motivation; Job Satisfaction; and Performance
Introduction
According to Law Number 12 of 2008 on the Second Amendment of Law Number 32 of 2004 on Regional Government, mentioned in article 1 point n; “Kelurahan (village) is the working area of the lurah (head of the village) as an apparatus of a regency or city area under a district.” Regarding this issue, the village can not be separated from the government of city or regency’s policies (including the guidance and supervision of its apparatus). Likewise, the implementation of regional autonomy, the village is part of the application of the regional autonomy. The consequence of this implementation is that the village government is demanded to have an increasingly high capacity to overcome the challenges of increasingly heavy tasks. Therefore, efforts are needed to improve the ability of the village government to take initiatives, planning implementation, and
AFFILIATION:
STIE Adi Unggul Bhirawa Surakarta. Jawa Tengah. Indonesia
*CORRESPONDENCE:
imron.aub@stie-aub.ac.id
THIS ARTICLE IS AVALILABLE IN:
http://journal.umy.ac.id/index.php/mb
DOI: 10.18196/mb.11191 CITATION:
Pahlawi, L. A. I., & Fatonah, S. (2020). The Role of Leadership in Improving Performance Through Organization Commitment, Motivation and Job Satisfaction of Village Employees. Jurnal
Manajemen Bisnis, 11(1), 105-120.
Received: 21 February 2020 Accepted: 31 March 2020
In the current reform era, government performance has received extra attention from the community. The criticism emerged without exception ranging from the central government to the lowest level of government, namely the village government. In Surakarta, there are 51 villages, with all head of villages are directly elected by the mayor. The phenomenon of determining the head of the village by directly chosen is very interesting to be observed. Especially the leadership role in improving the performance of employees to make a satisfaction service for the community. The evaluation of the village employee’s performance is not only carried out at the top management level but also the middle management level and the overall level below. The leadership role of the head of the village in Surakarta is very important in improving the performance of his subordinates. For this reason, the leadership role that is supported by organizational commitment, motivation, and job satisfaction factors needs to be improved; then, the performance of a village employee can improve adequately. Relevant research results conducted by Riyadi (2014), which showed that leadership influences employee performance. The research was undertaken by Suripto (2015) on leadership improves employee performance in Purwosari village, Pemalah regency showed that leadership has a considerable influence on the performance of its employees. Also, it relies heavily on a leader in fostering and directing its members to improve their performance. The research conducted by Alberto, and Adiwidjaja (2014) on the role of leadership in motivating performance, showed that the leadership role of the village head greatly motivates employee performance. The leadership motivates employee performance by creating two-way communication, paying attention to employee salaries, giving rewards for employee hard work recommending proposals rank, and providing adequate facilities and infrastructure.
On the contrary, relevant research results were also conducted by Rahmayanti and Afandi (2014), who stated in their research results that leadership did not affect performance. The phenomenon of sub-optimal employee performance becomes a concern primarily related to intellectual abilities, managerial skills, and understanding of a leader's organizational management. Thus, it is expected to provide examples and role models to subordinates and ultimately produce high performance and work results in the organization. Based on the phenomena, theoretical basis, and gap theory and research gap, it is necessary to empirically re-examine the influence of leadership on employee performance in villages in Surakarta.
Literature Review and Hypotheses Development
Performance
According to Bernardian and Russell in Sedarmayanti (2008), performance is defined as the record of outcomes produced on a specific job function or activity during a particular period. Meanwhile, according to Brahmasari and Suprayetno (2008), every human being has the potential to act in various forms of activity. The ability to work can be obtained
by humans either naturally (present from birth) or learned. Although humans have the potential to behave in specific ways, that behavior is only actualized at certain times. The potential for certain behaviors is called ability, while the expression of this potential is known as performance. The sustainable, effective, and fair performance appraisals will increase employee motivation and performance. Tika (2008) defines performance as the results of the job function or activity of a person or group in an organization that is influenced by various factors to achieve organizational goals within a specific period. Leadership
Leadership is the overall pattern of the actions of a leader, both visible and invisible to his subordinates. Leadership describes a harmonious combination of the philosophy, skills, traits, and attitudes that underlie a person's behavior. Leadership that shows directly or indirectly about a leader's confidence in the ability of subordinates (Zainal, 2006).
A leader requires the following conditions (Kartono, 2005):
1. Cultural flexibility. Cultural flexibility is not only for managing but also for recognizing and accepting the issue of differences in the organization.
2. Communication skills. Effective leaders must be able to communicate in writing, verbally, and non-verbally.
3. Skills in human resource management. HRD skills are the skills of leaders in their efforts to improve the atmosphere of learning, design training programs, disseminate information and experience, predict outcomes, conduct career counseling, create organizational change, and adapt to all parties.
4. Creativity. Creativity is not only owned by the leader but as a leader. Organizational Commitment
According to Allen and Meyer in Theresa, Joiner and Steve (2006), organizational commitment represents a psychological attachment to the employing organization. According to Jewell and Siegall (2006), organizational commitment is a state of an employee siding with a particular organization with specific goals and maintain membership in the organization. Meanwhile, Panggabean (2006) stated that organizational commitment is described as a tendency to be bound in a consistent line of activities because it considers the costs of implementing other activities.
Meyer, Stanley, Herscovitch, and Topolnytsky (2002), stated that there are three components of organizational commitment:
1. Affective commitment occurs when an employee wants to be part of an organization because of emotional attachment. In other words, this happens to be the desire of employees.
2. Continuance commitment arises when employees remain in an organization because they need a salary and other benefits.
organization is the right thing to do. In other words, this commitment occurs because employees feel obliged (ought to).
Robbins (2006) argues that organizational commitment is the amount of partiality of an employee in a particular organization and its goals, and the intention of maintaining membership in that organization. High organizational commitment means that there is a top priority for the organization. Commitment as a predictor of a person's performance is a better predictor, global in character, and perseveres in an organization as a whole rather than merely job satisfaction. Someone can be dissatisfied with a particular job and consider it as a temporary condition. However, dissatisfaction with a specific task that spreads into the organization can encourage someone to consider quitting work. Motivation
According to Chung and Megginson in Gomez (2006), motivation is defined as goal-directed behavior. It concerns the level of effort one exerts in pursuing a goal…it is closely related to employee satisfaction and job performance. The statement reflects that motivation is formulated as behavior aimed at the target. As for Heyell in Manullang (2005) stated that motivation refers to the degree of readiness of an organism to pursue some designated goal and implies the determination of the nature and locus of the forces inducing the degree of readiness. This definition implies that motivation is an effort to encourage employees in the organization to achieve the design goals and desired results of the organization.
Hasibuan (2007) defines motivation as a willingness to struggle or try to a higher level in order to achieve organizational goals with the condition that it does not neglect the ability to obtain satisfaction in fulfilling personal needs. Samsudin (2005) stated that motivation is the process of influencing or encouraging from the outside towards a person or working group; then, there is a willingness to carry out something that has been set.
According to Samsudin (2005), motivation models can be grouped into three models, namely:
1. The model of traditional. In this case, a crucial aspect of the leader's job is to enable employees to carry out tedious and repetitive work in the most efficient way. Leaders have traditionally encouraged or motivated employees by providing rewards in the form of increased salaries. This method indicates that if the employee is diligent and active, the wage will be increased. This view assumes that lazy employees can be motivated again only with financial rewards.
2. The model of human relations. This model emphasizes and considers the importance of employee social contact factors at work rather than the reward factor, as stated by the traditional model. In this model, leaders can motivate employees by fulfilling social needs and making employees feel relevant and useful.
3. The model of human resources. This model arises as a criticism of the social relations model, namely employee motivation, not only job satisfaction, but it can be from various factors. An important motivation for employees is the development of shared
responsibility to achieve organizational goals by contributing something to the organization under the interests and abilities of every employee.
Job Satisfaction
According to Mathis and Jackson (2006), job satisfaction is a positive emotional state and is the result of evaluating someone's work experience. According to Robbins and Judge (2015), job satisfaction is a general attitude towards one's work, the difference between the reward received by a worker and the amount believed to be received by them. Meanwhile, according to Sutrisno (2009), job satisfaction is an employee's attitude towards work related to work situations, cooperation among employees, rewards received at work, and issues relating to physical and psychological factors. Based on the understanding expressed by some of the experts above, it can be concluded that the notion of job satisfaction is a feeling of pleasure and joy experienced by someone in carrying out their work.
Research Method
Location and Research Object
The research will be carried out in Surakarta, and the object of this study is an employee of the village Civil Servants (ASN) in Surakarta.
Variables and Operational Definitions
Research Variables and Definition of Variable Operations 1. Research Variables
The variables used in this study are leadership variables as independent variables. Meanwhile, organizational commitment, motivation, and job satisfaction are intervening variables. Also, performance as the dependent variable.
2. Operational Definition
Operational Definition is an operational definition of variables that are measured accurately to an object or phenomenon using specific parameters (Hidayat, 2007). a. Performance
Performance indicators: Loyalty, Job performance, Responsibility, Obedience, Honesty, Cooperation, Initiatives, and Leadership
b. Leadership
Leadership uses indicators: Fair, Concern, Empathy, Attitude, and Modeling. c. Organizational Commitment
Organizational commitment uses indicators: proud to be part of the organization, concerned with the fate of the organization, happy to work in the organization, have the same values as adopted by the organization, have willing to work extra.
d. Motivation
Motivation uses indicators: security needs, social needs, self-esteem needs, autonomous needs, self-actualization needs.
e. Job Satisfaction
Job satisfaction uses indicators: the happiness of salary, the satisfaction of promotions, the pleasure of coworkers, the satisfaction of supervisors, and the satisfaction of work.
Population and Sample 1. Population
The population is the subject of research. Population research is carried out if someone wants to examine all the elements that are in the research area. Study or research is also called population studies or census studies (Arikunto, 2008). The population of this research is village employees in Surakarta. The total number of villages in Surakarta is 51 villages. Following the ASN employee data issued by the Surakarta City Government, there were 379 Employees. Thus, the population of the study was 379 employees
2. Sample
According to Arikunto (2008), the sample is part or representative of the population under study.
The sampling used in this study is the proportional random sampling method of sampling. Respondents' research criteria are based on randomly selected populations. Samples taken in this study were 100 respondents.
Data and Data Collection Techniques 1. Data
The data in this study used primary data in the form of a questionnaire from respondents.
2. Data Collection Techniques
Data collection techniques in this study are: a. Observation
b. Questionnaire
Result and Discussion
Test Research Instrument1. Validity Test
a. The Validity of the Leadership Variable (X1)
The leadership variable consists of 6 question items. This validity testing uses the technique of one-shot methods by comparing the value of rcount with the value of rtabel = 0.194. It is found that the results of 6 question items are valid because it has the value of ritems greater than the value of rtable.
b. The Validity of the Question Items for the Organizational Commitment Variable (X2) The organizational commitment variable consists of 6 question items. The validity testing uses the technique of the one-shot method by comparing the value of rcount with the value of rtable = 0.194. The results of the 6 question items are all valid because they have the value of ritems greater than the value of rtable.
c. The Validity of the Question Items for the Motivation Variable (X3)
The motivation variable consists of 5 question items. The validity testing uses the technique of the one-shot method by comparing the value of rcount with the value of rtable = 0.194. The results of the 5 question items are all valid because they have the value of ritems greater than the value of rtable.
d. The Validity of the Question Items for the Job Satisfaction Variable (X3)
The job satisfaction variable consists of 5 question items. This validity testing is using one-shot methods technique by comparing the value of rcount with the value of rtable = 0.194. The results of the 5 question items are all valid because they have a ritems value higher than the rtable value.
e. The Validity of the Question Items for the Performance Variable (Y)
The performance variable consists of 6 question items. The validity testing is using the one-shot method technique by comparing the value of rcount with the value rtable = 0.194. The results of the 6 question items are all valid because they have a ritem value more significant than the rtable value.
2. Reliability Test
The instrument reliability test aims to determine the magnitude of the instrument trust index of the independent variable. After the validity test is carried out, and valid items are obtained, the reliability test is then performed using the Cronbach Alpha formula. The way to find out that the instrument is reliable is if the value of r Alpha> 0.6 (Nunaly, 1967 in Ghozali, 2005).
From the reliability test results, it appears that the coefficient (r) alpha of all variables is higher than the required criteria or rule of thumb that is equal to 0.6. Thus, it can be said that the question points of all variables are in a stable state. Therefore, it can be used to collect data and can measure a thing that is measured consistently over time.
Hypothesis Testing Results 1. Path Analysis
In this study, this path analysis is used to determine the effect of the independent variables on the dependent variable using 2 (two) equations.
a. Result of Equation Path Analysis 1
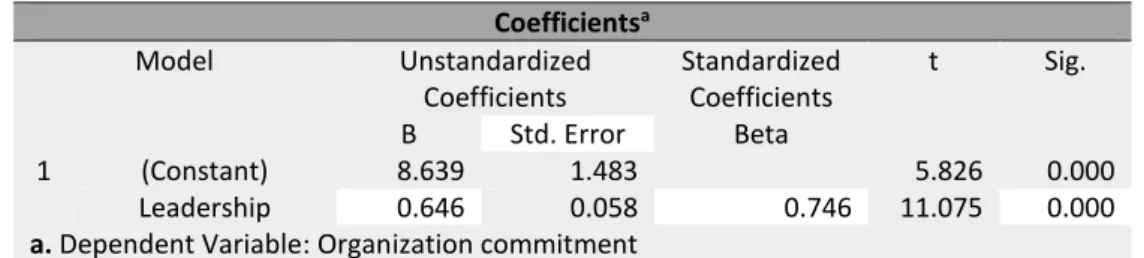
Table 1 Result of Equation Path Analysis 1 Coefficientsa Model Unstandardized Coefficients Standardized Coefficients t Sig. B Std. Error Beta 1 (Constant) 8.639 1.483 5.826 0.000 Leadership 0.646 0.058 0.746 11.075 0.000 a. Dependent Variable: Organization commitment
From table 1, the first regression equation can be made as follows: Y1 = 0.746 X1 + є1 Sig (0.000)** Info: Y1 = Organizational Commitment X1 = Leadership є1 = Residual ** = Significant
β1 = Leadership variable regression coefficient of 0.746 with a significant value of 0.000 <0.05. These results indicate that the leadership variable has a positive and significant effect on organizational commitment. Furthermore, if Leadership increases, Organizational Commitment will also increase.
b. Results of Equation Path Analysis 2
The result of equation path analysis 2 can be presented in the following table:
Table 2 Results of Equation Path Analysis 2 Coefficientsa Model Unstandardized Coefficients Standardized Coefficients t Sig. B Std. Error Beta 1 (Constant) -1.729 2.252 -.768 0.444 Leadership 0.824 0.089 0.685 9.303 0.000 a. Dependent Variable: Motivation
From table 2, the first regression equation can be made as follows: Y2 = 0.685 X1 + є2 Sig (0.000)** Ket : Y2 = Motivation X1 = Leadership Є2 = Residual ** = Significant
β1 = Leadership variable regression coefficient of 0.685 with a significant value of 0.000 <0.05. These results indicate that the leadership variable has a positive and significant effect on motivation. Furthermore, if leadership increases, then
motivation will also increase. c. Result of Equation Path Analysis 3
The result of equation path analysis 3 can be seen in the following table: Table 3 Result of Equation Path Analysis 3
Coefficientsa Model Unstandardized Coefficients Standardized Coefficients t Sig. B Std. Error Beta 1 (Constant) 2.638 1.386 1.904 0.060 Leadership 0.696 0.054 0.790 12.771 0.000 a. Dependent Variable: job satisfaction
From table 3, the first regression equation can be made as follows: Y3 = 0.790 X1 + є3 Sig (0.000)** Ket : Y3 = Job satisfaction X1 = Leadership Є3 = Residual ** = Significant
β1 = Leadership variable regression coefficient of 0.790 with a significant value of 0.000 <0.05. These results indicate that the leadership variable has a positive and significant effect on job satisfaction. Thus, if Leadership increases, Job Satisfaction will also increase.
d. Result of Equation Path Analysis 4
The result of equation path analysis 4 can be seen in the following table: Table 4 Result of Equation Path Analysis 4
Coefficientsa Model Unstandardized Coefficients Standardized Coefficients t Sig. B Std. Error Beta 1 (Constant) -4.108 1.263 -3.251 .002 Leadership Organization commitment Motivation Job satisfaction .176 .288 .137 .654 .073 .083 .062 .110 .152 .218 .143 .502 2.402 3.488 2.206 5.926 .018 .001 .030 .000 a. Dependent Variable: performance
From table 4, the first regression equation can be made as follows: Y4 = 0.152 X1 + 0.218 X2 + 0.143 X3 + 0.502 X4 + є4
Exp : Y4 = Performance X1 = Leadership X2 = Organizational Commitment X3 = Motivation X4 = Job Satisfaction Є4 = Residual ** = Significant
1) β1 = the regression coefficient of leadership variable is 0.152 with a significant value of 0.018 <0.05. This data shows that the leadership variable has a positive and significant effect on performance. This result means that if the leadership increases, then the performance will also increase.
2) β1 = the regression coefficient of Organizational Commitment variable is 0,218 with significant value of 0,001 <0,05. This data shows that the Organizational Commitment variable has a positive and significant effect on performance. This result means that if the Organizational Commitment increases, then Performance will also increase.
3) β1 = the regression coefficient of Motivation variable is 0.143 with a significant value of 0.030 <0.05. This data shows that the Motivation variable has a positive and significant effect on performance. This result also reflects that if motivation increases, then performance will also increase.
4) β1 = the regression coefficient of the Job Satisfaction variable is 0.502, with a significant value of 0.000 <0.05. This data shows that the Job Satisfaction variable has a positive and significant effect on performance. This result reflects that if Job Satisfaction increases, then Performance will also increase.
2. Test t
a.
Test t equation 1The result of test t equation 1 can be seen in this following table:
Table 5 Result of Test t equation 1
Coefficientsa Model Unstandardized Coefficients Standardized Coefficients t Sig. B Std. Error Beta 1 (Constant) 8.639 1.483 5.826 0.000 Leadership 0.646 0.058 0.746 11.075 0.000
a. Dependent Variable: Organization commitment From table 5, it can be concluded as follows:
Leadership has a positive and significant effect on Organizational Commitment. This result can be seen from the significance value of 0,000 <0.05.
H1: Leadership has a significant effect on the Organizational Commitment of
b.
Test t equation 2The result of test t equation 2 can be displayed in the following table: Table 6 Result of test t equation 2
Coefficientsa Model Unstandardized Coefficients Standardized Coefficients t Sig. B Std. Error Beta 1 (Constant) -1.729 2.252 -.768 0.444 Leadership 0.824 0.089 0.685 9.303 0.000 a. Dependent Variable: Motivation
From table 6, it can be concluded that:
Leadership has a positive and significant effect on motivation; this can be seen from the significance value of 0,000 <0.05.
H2: Leadership has a significant effect on the Motivation of Village Employees in
Surakarta (Proven Hypothesis)
c.
Test t equation 3The result of test t equation 3 can be observed in the following table: Table 7 Result of test t equation 3
Coefficientsa Model Unstandardized Coefficients Standardized Coefficients t Sig. B Std. Error Beta 1 (Constant) 2.638 1.386 1.904 0.060 Leadership 0.696 0.054 0.790 12.771 0.000 a. Dependent Variable: job satisfaction
From table 7, it can be concluded as follows:
Leadership has a positive and significant effect on job satisfaction. This result can be seen from the significance value of 0,000 <0.05.
H3: Leadership has a significant effect on the Job Satisfaction of Village
Employees in Surakarta (Proven Hypothesis)
d.
Test t equation 4Table 8 Result of test t equation 4 Coefficientsa Model Unstandardized Coefficients Standardized Coefficients t Sig. B Std. Error Beta 1 (Constant) -4.108 1.263 -3.251 .002 Leadership Organization commitment Motivation Job satisfaction .176 .288 .137 .654 .073 .083 .062 .110 .152 .218 .143 .502 2.402 3.488 2.206 5.926 .018 .001 .030 .000 a. Dependent Variable: performance
From table 8, it can be concluded that:
Leadership has a positive and significant effect on performance. This result can be seen from the significant value that is 0.018 <0.05.
H4: Leadership has a significant effect on the Performance of Village Employees
in Surakarta (Proven Hypothesis)
Organizational Commitment has a positive and significant effect on performance. This data can be seen from the significance value of 0.001 <0.05.
H5: Organizational Commitment has a significant effect on the Performance of
Village Employees in Surakarta (Proven Hypothesis)
Motivation has a positive and significant effect on performance. This data can be seen from the significant value that is 0.030 <0.05.
H6: Motivation has a significant effect on the Performance of Village Employees
in Surakarta (Proven Hypothesis)
Job Satisfaction has a positive and significant effect on performance. This result can be seen from the significance value of 0,000 <0.05.
H7: Job Satisfaction has a significant effect on the Performance of Village
Employees in Surakarta (Proven Hypothesis) 3. Test F
Table 9 Result of test F
ANOVAb
Model Sum of
Squares
df Mean Square F Sig. 1 Regression 1377.469 4 344.367 164.165 0.000a
Residual 199.281 95 2.098
Total 1576.750 99
a. Predictors: (Constant), job satisfaction, organization commitment, leadership b. Dependent Variable: performance
Based on the results of the simultaneous test (Test F) in the second equation, the value of F = 164,165 significance 0.000 <0.05. So, it can be concluded simultaneously that the variables of Leadership, Organizational Commitment, Motivation, and Job Satisfaction affect the Performance of Village Employees in Surakarta.
4. Coefficient of Determination (R2)
From the coefficient of total determination, the following results are obtained:
𝑅2 𝑡𝑜𝑡𝑎𝑙 = 1 − {(∈
1)2𝑥 (∈2)2 𝑥(∈3)2𝑥 (∈4)2 = 1 – {(0.666)2 x (0.729)2 x (0.612)2 x (0.355)2}
= 1 – {(0.444) x (0.531) x (0.375) x (0.126)} = 1 – 0.011 = 0.989
From the results of the total determination coefficient, it can be explained as follows:
The total R2 value of 0.989 indicates that Performance is explained by the variables of Leadership, Organizational Commitment, Motivation and Job Satisfaction at 98.9%. Meanwhile, the remaining 1.1% is explained by other variables outside the research model, for example compensation, work environment and work discipline.
5. Direct Effects, Indirect Effects, and Total Effect
Path analysis takes into account direct and indirect effects as well as total effects. a. Direct Effect
The direct effect is the influence of one independent variable on the dependent variable without passing through other dependent variables.
1) The Effect of Leadership on Performance
Based on the results of statistical calculations, it is known that Leadership influences Performance, with a coefficient value of 0.152. This data reflects that the higher the Leadership, the Performance will increase.
2) The Effect of Organizational Commitment on Performance.
Based on the results of statistical calculations, it is known that Organizational Commitment affects Performance with a coefficient value of 0.218. From these results, it can be seen that the higher the organizational commitment, the performance will increase.
influences performance with a coefficient value of 0.143. This data indicates that the higher the motivation, the performance will increase.
4) The Effect of Job Satisfaction on Performance
Based on the results of statistical calculations, it is known that Job Satisfaction influences Performance with a coefficient value of 0.502. This data indicates that the higher the Job Satisfaction, the performance will increase.
b. Indirect Effects and Total Influences
The Effect of Leadership on Performance through Organizational Commitment. Based on the results of statistical calculations, it is known that the indirect effect of Leadership on Performance through Organizational Commitment is 0.167. Meanwhile, the total effect is 0.319.
1) The Effect of Leadership on Performance through Motivation.
Based on the results of statistical calculations, it is known that the indirect effect of Leadership on Performance through Motivation is 0.098. Meanwhile, the total effect is 0.250
2) The Effect of Leadership on Performance through Job Satisfaction.
Based on the results of statistical calculations, it is known that the indirect effect of Leadership on Performance through Job Satisfaction is 0.396. Meanwhile, the total effect is 0.548.
Conclusion
Based on the result of the study, some suggestions can be proposed to the villages in Surakarta as follow Leadership can improve Performance through Job Satisfaction concretely. Leadership can be improved by looking at the highest indicator value on the validity of the Job Satisfaction test; items question 4, 3, and 2; (a) Leaders can guarantee the opportunity for employees to participate in decision making (b) Leaders can ensure the applied system of mutation, rotation and demotion can satisfy employees (c) Leaders can increase the salary received by employees regularly.
Following these findings, there will be an increase in the Performance of Village Employees in Surakarta in the form of behavior according to the highest score in the Performance validity test located in items 6, 1, and 2. The highest score indicates that the item is a dominant indicator forming a response to the Performance, namely an increase in behavior; (a) Employees always have the skills and initiative to complete their work (b) Employees can always complete the work in accordance with the targets set (c) Employees have a sense of responsibility for the results of the work. For future researchers, it should develop a model or re-test the conceptual model of research in order to strengthen the findings of this study.
References
Alberto, A. S., & Adiwidjaja, I. (2014). Peran Kepemimpinan Dalam Memotivasi Kinerja Pegawai. Jurnal Ilmu Sosial dan Ilmu Politik, 3(2), 1-5. Retrieved from
https://www.google.com/url?sa=t&rct=j&q=&esrc=s&source=web&cd=1&cad=rja &uact=8&ved=2ahUKEwi98e3ykcToAhWFfn0KHZrPAfkQFjAAegQIAhAB&url= https%3A%2F%2Fpublikasi.unitri.ac.id%2Findex.php%2Ffisip%2Farticle%2Fview%
2F72&usg=AOvVaw1b75nvZIFR4p8tmZEHD_Qo
Arikunto, S. (2008). Prosedur Penelitian: Suatu Pendekatan Praktek. Jakarta: Rineka Cipta. Brahmasari, I. A. & Suprayetno, A. (2008). Pengaruh Motivasi Kerja, Kepemimpinan dan
Budaya Organisasi Terhadap Kepuasan Kerja Karyawan serta Dampaknya pada Kinerja Perusahaan (Studi Kasus pada PT. Pei Hai International Wiratama Indonesia).
Jurnal Manajemen dan Kewirausahaan, 10(2), 124-135.
https://www.google.com/url?sa=t&rct=j&q=&esrc=s&source=web&cd=1&cad=rja &uact=8&ved=2ahUKEwiVsoiulMToAhW7xjgGHXFwDAQQFjAAegQIAhAB&ur l=http%3A%2F%2Fjurnalmanajemen.petra.ac.id%2Findex.php%2Fman%2Farticle%
2Fview%2F17039&usg=AOvVaw2ltD2Xwtor17G5LxftIj_5
Ghozali, I. (2005). Aplikasi Analisis Multivarians dengan Program SPSS. Semarang : Badan Penerbit Universitas Diponegoro.
Ghozali, Imam. (2008). Aplikasi Analisis Multivariate dengan Program SPSS. Semarang: Badan Penerbit Universitas Diponegoro.
Gomes, F. C. (2001). Manajemen Sumber Daya Manusia. Yogyakarta: Andi Offset Hasibuan, M. S. P. (2007). Manajemen Sumber Daya Manusia. Jakarta: Bumi Aksara.
Hidayat. A.A.A. (2007). Metode Penelitian Keperawatan dan Tekhnik Analisa Data. Jakarta: Salemba Medika.
Jewell, L. N. & Siegall, M., (1998). Psikologi Industri/Organisasi Modern: Psikologi Penerapan
Untuk Memecahkan Berbagai Masalah di Tempat Kerja, Perusahaan, Industri, dan Organisasi, Ed-2. Jakarta: Arcan.
Kartono, K. (2005). Pemimpin dan Kepemimpinan. Jakarta: PT. Raja Grafindo Persada.
Mathis, R. L., & Jackson, J. H. (2006). Human Resource Management. Jakarta. Penerbit Salemba Empat.
Meyer, J.P., Stanley, D.J., Herscovitch, L. and Topolnytsky, L. (2002) Affective, Continuance, and Normative Commitment to the Organization: A Meta-Analysis of Antecedents, Correlates, and Consequences. Journal of Vocational Behavior, 61, 20-52.
https://doi.org/10.1006/jvbe.2001.1842
Panggabean, M. (2006). Manajemen Sumber Daya Manusia. Jakarta: Ghalia Indonesia.
Rahmayanti, D., & Afandi, I. (2014). Analisis Pengaruh Kepemimpinan, Motivasi Lingkungan Kerja,
dan Kedisplinan Terhadap Kinerja Karyawan (Studi Kasus: Operator Welding 1A, PT. XYZ Motor). Jurnal Optimasi Sistem Industri, 13, (1), 556-561.
https://doi.org/10.25077/josi.v13.n1.p556-561.2014
Riyadi, I. B. (2014). Pengaruh Perilaku Pimpinan, Kepuasan Kerja, Lingkungan Kerja dan Kemampuan Kerja Terhadap Kinerja Karyawan PT. BPR Central Artha Tegal. Media
Ekonomi dan Manajemen, 29(2), 152-165. Retrieved from
http://jurnal.untagsmg.ac.id/index.php/fe/article/view/226
Robbins, S P. (2006). Perilaku Organisasi, Edisi Kesembilan, Jakarta; PT. Indeks.
Robbins, S. P., & Judge, T. A. (2015). Perilaku Organisasi. Jakarta. Penerbit: Salemba Empat. Robbins, S.P. (2006). Perilaku Organisasi, Konsep-Kontroversial-Aplikasi. Jilid I. Edisi Bahasa
Suripto. (2015). Kepemimpinan Lurah Dalam Meningkatkan Kinerja Pegawai Di Kelurahan Purwosari Kabupaten Pemalang. Paper. Retrieved from
https://www.academia.edu/32266177/KEPEMIMPINAN_LURAH_DALAM_ME NINGKATKAN_KINERJA_PEGAWAI_DI_KELURAHAN_PURWOSARI_KA
BUPATEN_PEMALANG_Suripto
Sutrisno, E. (2009). Manajemen Sumber Daya Manusia, Jakarta: Kencana Pranada Media Group. Theresa, A., Joiner, & Steve, B. (2006). The Antecedents of Organizational Commitment:
The Case of Austra-lian Casual Academics. International Journal of Educational
Management. 20(6), 439–452. https://doi.org/10.1108/09513540610683694
Tika, M. P. (2008). Budaya Organisasi dan Peningkatan Kinerja Perusahaan. Jakarta: Bumi Aksara. Zainal, V. R. 2006. Kepemimpinan dan Perilaku Organisasi. Jakarta: PT. Raja Grafindo Persada.