ISSN Online: 2151-1969 ISSN Print: 2151-1950
Does Environmental Risk Affect Human
Migration Behavior?
Seong Nam Hwang
1, Sang-Woo Lee
21Environmental Science Program, Department of Biology, Southeast Missouri State University, Cape Girardeau, USA 2Department of Forestry and Landscape Architecture, Konkuk University, Seoul, Korea
Abstract
This study tests the influence of environmental risks associated with floods, hurricanes, and hazardous material releases on human migration behavior. With close attention to a function of environmental risk factors, socio-demo- graphic attributes, hazard risk and locational attributes were measured and correlated to the standardized number of recent arrivals and long term resi-dents at the census tract level. Two groups (i.e., recent arrivals and long-term residents) were created to compare their moving behavior. The results indi-cate that flood risk showed little relationship to either recent arrivals or long- term residents. These results are consistent with past research which suggests that people tend to ignore their vulnerability to natural hazards. However, both groups had negative relationships to the risk from hurricanes and ha-zardous material releases. This counter-intuitive result suggests that other factors, such as proximity to employment opportunities or property tax ad-vantages, need to be examined. In particular, the recent arrivals were nega-tively related to chemical risk while long-term residents were posinega-tively re-lated to chemical risks, indicating that people that just arrived and old resi-dents are somewhat different in perceiving environmental risks. In addition, the results of this study suggest that people are objective about environmental risks in selecting their habitat. However, once the habitat is settled, people’s perception of the risks may be interfered or reduced by other factors.
Keywords
GIS, Environmental Hazards, Emergency Management, Moving Behavior, Environmental Risk
1. Introduction
It’s clear that almost every year natural and man-made hazards lead to many
How to cite this paper: Hwang, S.N. and, Lee, S.-W. (2017) Does Environmental Risk Affect Human Migration Behavior? Journal of Geographic Information System, 9, 493- 504.
https://doi.org/10.4236/jgis.2017.94031 Received: August 1, 2017
Accepted: August 18, 2017 Published: August 21, 2017 Copyright © 2017 by authors and Scientific Research Publishing Inc. This work is licensed under the Creative Commons Attribution International License (CC BY 4.0).
human causalities, and enormous economic losses all across the United States. Federal Emergency Management Agency (FEMA, 1997) concludes that 9.6 mil-lion US households and property valued at $390 bilmil-lion currently are at risk from a 1% annual chance of flooding in such locations. Along the Atlantic and Gulf coasts, about $3 trillion in infrastructure adjacent to the shoreline, is vulnerable to erosion from flooding and hurricane hazards [1]. Furthermore, as many ur-ban areas of the United States have increased development in hazard prone areas, losses of property from natural and technological disasters have been ris-ing, even though fatality rates have been falling due to advanced its early warn-ing systems [2] [3]. Conrad and his colleague [4] estimate average annual federal expenditure for disaster relief and preparedness at $7 billion. In addition to the economic and human losses resulting from environmental hazards, there are significant social costs, like personal stress from evacuations, life in temporary emergency shelters, and disruption of neighborhoods. This increased vulnerabil-ity raises questions about people’s perceptions of, and response to, these envi-ronmental hazards.
Many researchers have shown that locational behaviors depend upon a variety of personal, locational, cultural, social, demographic, economic, environmental, and policy factors. In particular, existing research has explored a number of neighborhood amenities and disamenities, which influence immigration and duration of stay [5] [6]. In this regard, residential satisfaction is a main trigger-ing factor of people’s migration decision maktrigger-ing and behavior [7] [8]. Rossi [9] posits that “in the typical ideal case, a household becomes dissatisfied with its dwelling, decides to move, searches for a set of alternative dwellings that appear to be more satisfactory, and then decides among that set of alternatives (p.24)”. Amerigo and Aragones [7] developed a comprehensive model depicting the rela-tionship between the individual and his/her residential environment. This model shows that residential satisfaction is a function of objective and subjective attributes of residential environment, and personal characteristics. The objective attributes of residential environment include physical conditions of built envi-ronment, various types of infrastructure, and natural factors such as woodlands, parks, and water bodies in the neighborhood. The subjective attributes include an individual’s evaluation of quality of house, safety, noise, overcrowding, and attachment to the neighborhood as well as the objective variables described above. The subjective attributes are influenced by personal characteristics such as social/economic/demographic characteristics. The individual’s evaluation of the residential environment leads to his/her adaptive behavior (e.g., stay or moving) [10]. With regard to this, several studies demonstrated that moving be-havior followed the low levels of satisfaction about housing and neighborhood [8] [9] [11] [12].
du-ration of stay in a neighborhood. In this light, this paper attempts to test whether environmental characteristics of a neighborhood are related to people’s moving behaviors, such as habitat selection and duration of stay. With a close attention to the function of environmental risks on the migration decision making and behavior of residents, it was hypothesized first that environmental risks includ-ing flood, hurricane, and chemical hazards are likely to affect human movinclud-ing behavior, and, second, residents who have been attached to their neighborhood for a long time are less objective about their environments than recent arrivals. These two groups (i.e., recent arrivals and long-term residents) are expected to differ in a number of ways. First, long-term residents may have a different level of risk perception, compared to recent arrivals, because the former are likely to have more hazard adjustment measures, higher personalization of the risk with adaptive behavior to their neighborhood vulnerability over time, and more chances of having direct/indirect disaster experience and hazard-related infor-mation in their neighborhood. Second, recent arrivals may follow self-insurance theory [14], which explains that humans tend to locate their houses in a less vulnerable area to reduce losses in future disasters. Therefore, recent arrivals are likely to evaluate environment risk more objectively than long-term residents. Rapoport [15] supports this theory by asserting that people move out of un-wanted environments and search for attractive ones. Third, long-term residents may adjust to their residential environment. The stress-threshold model hypo-thesize people tend not to consider moving when they do not experience strain associated with residential environment [16] [17]. Based upon this model, long- term residents may have a lower level of risk perception. Also, they may place more interest and value on the natural environment (i.e., scenic view around their dwelling), built environment (i.e., various amenities) and social/demogra- phic factors in their neighborhood (i.e., strong ties with local social networks).
As stated earlier, there have been a wide range of research showing that vari-ous factors influence human mobility intentions and moving behavior. However, there was little research done to characterize such behavior by employing GIS technology and statistical method. Therefore, it would be meaningful to investi-gate whether there are relationships between environmental risks from floods, hurricanes, and chemical hazards, and locational behavior by using GIS and sta-tistical analysis.
2. Data and Method
2.1. Study Area
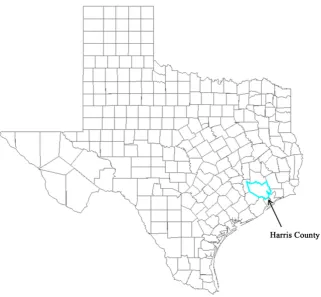
The study area is Harris County, Texas (see Figure 1). According to the 2010 census data, Harris County is in the third largest county in the United State, with a land size of 1729 square miles, a population of 4,092,459, 1,598,698 housing units, and a median household income of $50,422.
Figure 1. Study area: Harris county, TX.
cluding hurricanes, floods, tornadoes and chemical accidents, and there still ex-ists the potential for such disasters to lead to property damage and casualties. In June 2001, the latest extreme event, Tropical Storm Allison devastated major areas of the county and neighboring communities, claiming 22 lives and da-maging 20,000 homes and 5000 other buildings at an estimated cost of 20 billion dollars. The vulnerability of this area to great hurricanes (e.g., Saffir-Simpson Categories Four and Five) is even greater. Also, the hundreds of petrochemical manufacturing and distribution facilities create a significant risk of hazardous material accidents on highways and in urban areas. In fact, a recent headline in the Houston Chronicle said Harris County was ranked first in U.S. for likelihood of chemical disasters.
2.2. Data
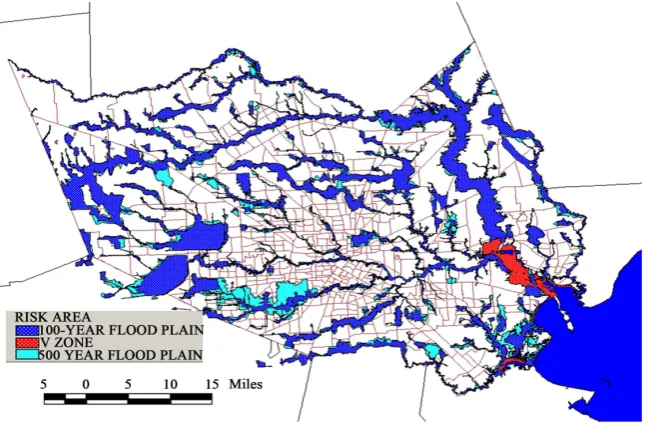
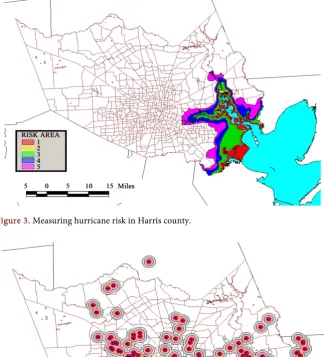
is the scientifically estimated environmental risk from flood, hurricane, and chemical hazards. Flood risk was assessed using Federal Emergency Manage-ment Agency’s countywide flood insurance digital data produced in 1996. Flood risk is defined as 100-year and 500-year flood plain areas. The 100-year flood plain means that the area can experience a chance of flooding once per 100 years. Hurricane risk was assessed from hurricane risk area maps developed in 1999 by the Hazard Reduction and Recovery Center (HRRC) at Texas A&M University. Hurricane risk concerns the land areas that are vulnerable to surge inundation from five different categories of hurricanes. Chemical risk was de-termined from EPA’s 1996 Toxic Release Inventory Data. This database contains information on toxic chemical releases and other waste management activities reported annually by certain covered industry groups as well as federal facilities. These three risk variables are used as main independent variables.
The three different types of environmental risks evaluated in this study in-clude scientifically measured risks from flood, hurricane, and chemical hazards. The reasons why such types of environmental risks were chosen is that our study area is especially vulnerable to those natural and man-made hazards. To know whether those environmental risks are related to human moving behaviors, two groups have been used as dependent variables. The first group is termed recent arrivals and the other, long-term residents. The first group or recent arrivals were measured as the number of persons per square mile who moved into the neighborhood within the previous five years as of 1990. Recent arrivals can be contrasted with long-term residents. The long-term residents were measured as the number of householders per square mile who stayed in the neighborhood over 10 years from 1959 or earlier through 1980. The variables and their defini-tions are summarized in Table 1.
2.3. Method
Figure 2. Measuring flood risk in Harris county.
Table 1. Variable, definition, and source.
Variable Definition Source Independent Variables
MedIncome Median household income Censusa
Edu Percentage of persons with college or higher degrees Census PctPov Percentage of poverty Census PctWhite Percentage of white persons Census
FldRisk prone areas, such as 100- and 500-year flood plains, The extent of scientifically estimated flood
and storm surge vulnerable zone. FEMA
b
HurrRisk inundation due to 5 different categories of hurricanes. Identified the land areas that are vulnerable to surge HRRCc
HzMatRiks Established the geographical distribution of TRI sites and EPAd
CBDprox from centroid of census tract Euclidian distance to CBD TIGERe
LakeProx Euclidian the nearest distance to the lake from centroid of census tract TIGER
SeaProx to the sea from centroid of census tract Euclidian the nearest distance TIGER Dependent Variables
RecArr moved into the neighborhood within the previous 5 years The number of householders per square mile who Census
LtRes who lived in the neighborhood more than 10 years The number of householders per square mile Census
Figure 3. Measuring hurricane risk in Harris county.
Figure 4. Measuring chemical risk in Harris county.
Statistical analysis was employed to study the effect of scientifically estimated environmental risk on both recent arrivals and long-term residents. The number of residents in the two groups was divided by the size of the census tracts to standardize and to be correlated with socio-demographic variables (i.e., median income level, education level, percentage of poverty and percentage of whites), geographical characteristics (i.e., proximity from downtown, proximity to the nearest lake and proximity to the sea), and evaluated environmental risks in-cluding hurricane, flooding and hazard facilities.
3. Results
mographic characteristics need to be viewed as an overall picture of the study site even though they have limitations of delineating actual socio-demographic characteristics. Table 2 provides the overall picture of environmental characte-ristics of the study site. The mean median household income in the study site is $31,712 and the maximum income level is $150,000. The table also shows some degree of aggregation in terms of ethnic groups. Regarding environmental risks, chemical risk is higher in this site than other types of risk from hurricane and flooding. The mean distance from the centroid of each census tract to CBD is 11.19 miles and the maximum distance is 40.44 miles. All centroids of the census tracts are located within about 53 miles from the sea and 13miles from any lakes in Harris County.
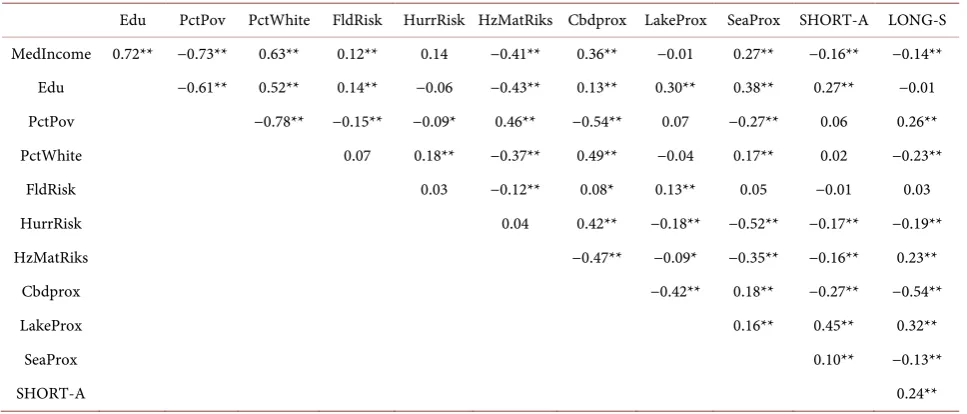
[image:8.595.210.539.297.472.2]The results of Pearson-moment correlation analysis were summarized in Ta-ble 3. The results of correlation analysis show that the number of recent arrivals
Table 2. Mean, standard deviation, minimum and maximum values of the variables.
Variables M STD MIN MAX MedIncome 31,712 17,254 4999 150,001
Edu 0.22 0.19 0 0.78 PctPov 0.17 0.13 0 0.68 PctWhite 62.48 29.63 0 100 FldRisk 0.23 0.26 0 1 HurrRisk 0.08 0.26 0 1 HzMatRiks 0.49 0.42 0 1 Cbdprox 11.19 6.74 0.47 40.44 LakeProx 5.64 2.87 0.07 12.93 SeaProx 16.2 9.05 0 52.88
N = 565.
Table 3. Result of pearson-moment correlation analysis.
Edu PctPov PctWhite FldRisk HurrRisk HzMatRiks Cbdprox LakeProx SeaProx SHORT-A LONG-S MedIncome 0.72** −0.73** 0.63** 0.12** 0.14 −0.41** 0.36** −0.01 0.27** −0.16** −0.14**
Edu −0.61** 0.52** 0.14** −0.06 −0.43** 0.13** 0.30** 0.38** 0.27** −0.01 PctPov −0.78** −0.15** −0.09* 0.46** −0.54** 0.07 −0.27** 0.06 0.26** PctWhite 0.07 0.18** −0.37** 0.49** −0.04 0.17** 0.02 −0.23**
FldRisk 0.03 −0.12** 0.08* 0.13** 0.05 −0.01 0.03 HurrRisk 0.04 0.42** −0.18** −0.52** −0.17** −0.19** HzMatRiks −0.47** −0.09* −0.35** −0.16** 0.23**
Cbdprox −0.42** 0.18** −0.27** −0.54** LakeProx 0.16** 0.45** 0.32**
SeaProx 0.10** −0.13**
SHORT-A 0.24**
[image:8.595.57.541.515.722.2]is significantly correlated with socio-demographic, locational, and environmen-tal risk characteristics. Specifically, the number of recent arrivals is positively correlated with the education level, proximity to lake and proximity to the sea, with correlation coefficients of 0.27, 0.45 and 0.19 respectively. On the contrary, the number of recent arrivals is negatively correlated with the median household income, the risks of hurricanes and hazardous material releases and proximity to the central business district (CBD), with correlation coefficients of −0.17, −0.16 and −0.27 respectively. However, no significant relationship was found between the number of recent arrivals, the percentage of poverty, the percentage of white persons, and flood risk. The number of long-term residents shows a significant positive relationship with the percentage of poverty (r = 0.26), hazardous ma-terial release risk (r = 0.23) and proximity to lake (r = 0.32) while it shows a sta-tistically significant negative relationship with median household income (r = −0.14), the percentage of white persons (r = −0.23), hurricane risk (r = −0.19), proximity to downtown (r = −0.54) and proximity to the sea (r = −0.13).
Focusing on environmental risks, the results indicate that flood risk show no significant relationship with either the number of recent arrivals, or the number of long-term residents while hurricane risk is negatively related to both the re-cent arrivals and long-term residents. Interestingly enough, chemical risk shows somewhat disparate results. Specifically, the chemical risk is negatively corre-lated with the number of recent arrivals and is positively correcorre-lated with number of long-term residents. A negative relationship was found between chemical risk and flood risk, with correlation coefficient of −0.12. It is noticeable that flood risk is positively correlated with the median household income and educational attainment while it is negatively correlated with the percentage of poverty. Hur-ricane risk shows a negative relationship with the percentage of poverty (r = −0.09) and a positive relationship with the percentage of white persons (r = 0.18). Chemical risk shows a relatively stronger relationship with socio-demo- graphic characteristics. Particularly, chemical risk is negatively associated with the median household income (r = −0.41), educational attainment (r = −0.43), and percentage of whites (−0.37), but positively correlated with the percentage of poverty (r = 0.46).
of hazardous materials. It is also noteworthy that there is a positive correlation between the number of recent arrivals and the number of long-term residents. In other words, census tracts with more current residents are more likely to attract more new arrivals.
4. Conclusions
The factors that affect human moving behavior are various. They could either move out or stay in their neighborhood, depending upon on objective and sub-jective residential environment attributes, and personal attributes. Particularly, understanding how environmental disamenities are related to residential selec-tion is critical. Namely, planners and policy makers are provided with informa-tion not only on how their local residents adjust their behaviors toward a hous-ing issue in relation to environmental risks, but also on how different groups of residents respond to the issue in terms of social/economic/demographic charac-teristics.
Basically, existing research showed that environmental disamenities were po-sitively related to the moving intentions, while environmental amenities were negatively related to the stay of duration. The main purpose of this study was to investigate the effect of environmental risk as environmental disamenities on people’s moving behavior. Two groups were created to compare their migration behavior in this study. The results indicate that flood risk showed little relation-ship to either recent arrivals or long-term residents. These results are consistent with past research which suggests that people tend to ignore their vulnerability to natural hazards. However, both groups had negative relationships to the risk from hurricanes. This counter-intuitive result suggests that other factors, such as proximity to employment opportunities or property tax advantages need to be examined. Meanwhile, the recent arrivals were negatively related to chemical risk while long-term residents were positively related to chemical risks. With re-gard to the relationship between the recent arrivals and chemical risk, these findings should follow the self-insurance theory in which people select safer places when they search for homes.
Both objective and subjective environmental attributes affect human moving behavior. However, the results of this study suggest that people who moved in relatively recently tend to avoid environment disamenities in their habitat selec-tion, compared to people who stayed for more than 10 years. In this sense, it is conclusive that recent arrivals seem to weigh objective residential environment (e.g., technological hazard) rather than subjective residential environment. It is noteworthy that the long-term residents have a negative relationship to income, positive relationship to the percentage of poverty. Simply, long-term residents may not be able to afford to move out even though they are at risk of flooding, hurricane and chemical hazards.
5. Discussion
perception of environmental risks. Therefore, understanding the relationship between environmental risk and individual’s perceived risks in a neighborhood needs additional study. In effect, even though it is true that the public risk per-ception is affected somewhat by the objective environmental risk, there is also enough evidence to show that the public risk perception level bears upon race, age, gender, occupation, personality differences, income, education, the amount of the hazard information, and past experience, among other variables [18] [19] [20] [21] [22]. Even an individual’s perceived risk estimates can change over time [23]. Additionally, researchers have claimed that the public underrates the hazardous quality of their environment, mainly because they put their priorities on their enormous daily issues of living [24] [25]. Therefore, it would have been better to use the survey research method to ask the public to rate their perceived risk through a questionnaire survey.
References
[1] Federal Emergency Management Agency (1997) Multi-Hazard Identification and Risk Assessment. The International Decade for Natural Disaster Reduction, Wash-ington DC.
[2] Mileti, D. (1999) Designing Future Disasters: A Sustainable Approach for Hazard Research and Application in the United Sates. Joseph Henry/National Academy Press, Washington DC.
[3] Kousky, C. (2014) Informing Climate Adaptation: A Review of the Economic Costs of Natural Disasters. Energy Economics, 46, 576-592.
https://doi.org/10.1016/j.eneco.2013.09.029
[4] Conard, D.R., McNitt, B. and Stout, M. (1998) Higher Ground: A Report on Vo-luntary Property Buyouts in the Nation’s Floodplains, a Common Ground Solution Serving People at Risk, Taxpayers, and the Environment. National Wildlife Federa-tion, Washington DC.
[5] Bonaiuto, M., Aiello, A., Perugini, M., Bonness, M. and Ercolanti, A.P. (1999) Mul-tidimensional Perception of Residential Environment Quality and Neighborhood Attachment in the Urban Environment. Journal of Environmental Psychology, 19, 331-352. https://doi.org/10.1006/jevp.1999.0138
[6] Hwang, S.N. (2004) Environmental Amenities and Disamenities, and Housing Prices; Using GIS Techniques. Ph.D. Dissertation, Texas A&M University, College Station.
[7] Amérigo, M. and Aragonés, J.I. (1997) A Theoretical and Methodological Approach to the Study of Residential Satisfaction. Journal of Environmental Psychology, 17, 47-57. https://doi.org/10.1006/jevp.1996.0038
[8] Wang, D. and Wang, F. (2016) Contributions of the Usage and Affective Experience of the Residential Environment to Residential Satisfaction. Housing Studies, 31, 42-60. https://doi.org/10.1080/02673037.2015.1025372
[9] Rossi, P.H. (1980) Why Family Moves. 2nd Edition, Sage, Beverly Hills.
[10] Clark, W.A. and Lisowski, W. (2017) Decisions to Move and Decisions to Stay: Life Course Events and Mobility Outcomes. Housing Studies, 32, 547-565.
https://doi.org/10.1080/02673037.2016.1210100
Planning A, 30, 1473-1495. https://doi.org/10.1068/a301473
[12] Speare, A. (1974) Residential Satisfaction as an Intervening Variable in Residential Mobility. Demography, 11, 173-188.https://doi.org/10.2307/2060556
[13] Baum, A., Fleming, R. and Singer, J.E. (1985) Understanding Environmental Stress: Strategies for Conceptual and Methodological Integration. In: Baum, A. and Singer, J.E., Eds., Advances in Environmental Psychology, Volume 5, Erlbaum Associates, New Jersey, 185-205.
[14] Ehrlich, I. and Becker, G.S. (1972) Market Insurance, Self-Insurance, and Self-Protection. Journal of Political Economics, 80, 623-648.
https://doi.org/10.1086/259916
[15] Rapoport, A. (1980) Environmental Preference, Habitat Selection and Urban Housing. Journal of Social Issues, 36, 1980.
https://doi.org/10.1111/j.1540-4560.1980.tb02039.x
[16] Wolpert, J. (1965) Behavioral Aspect of the Decision to Migrate. Papers of the Re-gional Science Association, 15, 159-169.https://doi.org/10.1007/BF01947871
[17] Brown, L.A. and Moore, E.G. (1970) The Intra-Urban Migration Process: A Pers-pective. Geografiska AnnalerSeries B, 52, 1-13. https://doi.org/10.2307/490436
[18] Lindell, M.K. and Hwang, S.N. (2008) Households’ Perceived Personal Risk and Responses in a Multihazard Environment. Risk Analysis, 28, 539-556.
https://doi.org/10.1111/j.1539-6924.2008.01032.x
[19] Lamson, C. (1983) I Think They Are All Caught up: An Inquiry of Hazard Percep-tion among Newfoundland and Inshore Fishermen. Environment and Behavior, 15, 458-486.https://doi.org/10.1177/0013916583154004
[20] Turner, R.H., Nigg, J.M., Paz, D.H. and Young, B.S. (1979) Earthquake Threat: The Human Response in Southern California. Institute for Social Science Research, University of California, Los Angeles.
[21] Hodge, D., Sharp, V., and Marts, M. (1979) Contemporary Responses to Volcanism: Case Studies from the Cascades and Hawaii. In: Sheets, P.D. and Grayson, D.K., Ed., Volcanic Activity and Human Ecology, Academic Press, New York, 221-248. [22] Simpson-Housley, P. and Bradshaw, P. (1978) Personality and the Perception of
Earthquake Hazard. Australian Geographical Studies, 16, 65-72.
https://doi.org/10.1111/j.1467-8470.1978.tb00316.x
[23] Nigg, J.M. (1982) Awareness and Behavior: Public Response to Prediction Aware-ness. In: Saarinen, T.F., Ed., Perspectives on Increasing Hazard Awareness, Mono-graph No. 35, University of Colorado, Institute of Behavioral Science, Boulder, 71- 96.
[24] Covello, V.T. (1983) The Perception of Technological Risks: A Literature Review. Technological Forecasting and Social Change, 23, 285-297.
[25] Drabek, T. (1986) Human System Responses to Disaster: An Inventory of Sociolog-ical Findings. Springer Verlag, New York.
https://doi.org/10.1007/978-1-4612-4960-3
Submit or recommend next manuscript to SCIRP and we will provide best service for you:
Accepting pre-submission inquiries through Email, Facebook, LinkedIn, Twitter, etc. A wide selection of journals (inclusive of 9 subjects, more than 200 journals)
Providing 24-hour high-quality service User-friendly online submission system Fair and swift peer-review system
Efficient typesetting and proofreading procedure
Display of the result of downloads and visits, as well as the number of cited articles Maximum dissemination of your research work
Submit your manuscript at: http://papersubmission.scirp.org/