ISSN Online: 2327-5227 ISSN Print: 2327-5219
DOI: 10.4236/jcc.2017.511002 Sep. 4, 2017 16 Journal of Computer and Communications
Feature Extraction to Polar Image
Donghua Gu
1, Zhenyu Han
1, Qinge Wu
2*1Engineering Training Center, Zhengzhou University of Light Industry, Zhengzhou, China
2College of Electric and Information Engineering, Zhengzhou University of Light Industry, Zhengzhou, China
Abstract
Some algorithms of feature extraction in existing literature studied for image processing was the gray image with one-dimensional parameter. However, some feature points’ extraction for three-dimensional color of polar image, such as the color edge extraction, inflection points, and so on, was urgently to be solved a polar color problem. For achieving quickly and accurately the col-or feature extraction to polar image, this paper proposed a similar region of color algorithm. The algorithm was compared to polar image, and the effect to color extraction was also described by the combination of the proposed and existing algorithms. Moreover, this paper gave the comparison of the pro-posed algorithm and an existing classical algorithm to extraction of color fea-ture. These researches in this paper provided a powerful tool for polar image classification, color feature segmentation, precise recognition, and so on.
Keywords
Similar Region of Color Algorithm, Polar Image, Edge Detection, Corner Point Extraction
1. Introduction
More and more color image data grew at present. Since the color image included a lot of information characteristics, it was widely used and concerned, for exam-ple, hospital surgeon surgery, the surgeons were often carrying out operation positioning with the help of images for operating some surgeries. But most of them were utilizing a gray image in a few years ago, thus the success rate is not too high for a number of key operations. Most of them have made use of color tones, color images and other color images or projection surgery in recent years, the success rate increased a lot. To further improve the success rate of surgery, it should develop some new algorithms for image processing such as the edges, corner points, inflection points, and so on for color image, and the developed
How to cite this paper: Gu, D.H., Han, Z.Y. and Wu, Q.G. (2017) Feature Extrac-tion to Polar Image. Journal of Computer and Communications, 5, 16-26.
https://doi.org/10.4236/jcc.2017.511002
Received: August 10, 2017 Accepted: September 1, 2017 Published: September 4, 2017
Copyright © 2017 by authors and Scientific Research Publishing Inc. This work is licensed under the Creative Commons Attribution International License (CC BY 4.0).
DOI: 10.4236/jcc.2017.511002 17 Journal of Computer and Communications algorithms should have some better advantages, such as it should make the algo-rithm faster, easy to calculate, easy to program, etc. In addition, the public secu-rity system in the detection of cases need fast and accurately search for valuable information for some color, color video, picture texture and other characteristics of extraction, which are urgently need to provide a powerful tool. The arctic and polar scientific research department collected various polar data need carry out an effective feature extraction, fine classification, arctic environmental control, resource protection, rational development of resources, and resource regenera-tion and other scientific research to establish a reasonable database based on these color pictures. These problems need to develop color image edge, corner and other feature extraction methods.
An important requirement is to extract effective features from the image in image retrieval, calibration, classification, clustering, etc. However, the color feature is most widely used visual features. The use of color histograms is the most common way to represent color features. In [1], the color feature extrac-tion based on square histogram was proposed. The use of quadratic tree decom-position in images with different sizes and homogeneous wood blocks was de-fined, and the color histogram and surface skin of the same size were extracted. Compared with the global color histogram, the image retrieval results showed the effectiveness and feasibility of this method. But it did not give a color edge extraction algorithm. In the literature [2], it gave a fuzzy facial expression recog-nition system, and achieved the facial expression color identification. The litera-ture [3] described a method regarding ant colony optimization that was pro-posed as a method of general clustering analysis of color, and it was used to clas-sify and extract the color of polar images. The literature [4] discussed a digital processing for the flame color image according to flame color and vibrational frequency analysis. The literature [5] implemented a unified color region space to color processing based on perceptual image processing, and [6] discussed the video processing and actual image by using Matlab tools.
Since the earlier detection algorithms on edge involved a gradient operation, there were sensitive on noise, computing-intensive and other demerits. Actually, an algorithm in [7] was only based on the comparison of gray about surrounding pixels, which did not involve any computations on gradient, so its computation was relatively small, and its anti-noise ability was very strong. But these algo-rithms were to carry out the gray scale processing for one-dimensional parame-ter. However, doctors needed to pinpoint the color image during surgery and diagnosis [8]; the polar department had wanted to establish a rational database, which was required to carry out the fine classification of data for various types of mass data, but the data classification needed to deal with effectively color images
[9] [10]. For the color feature extraction on images, it will require developing some new extraction algorithms.
DOI: 10.4236/jcc.2017.511002 18 Journal of Computer and Communications similar region of color algorithm, and also gives the comparison and experiment of the proposed and existing algorithms for polar color distribution. Finally, the two algorithms were applied to the classification and recognition of polar image.
2. Similar Region of Color Algorithm
2.1. Data Sources
The data of this paper is mainly based on the polar optical observation data of the north and south polar ground stations. This section mainly uses the all-sky imager to study the morphology of polar by high time and spatial resolution of the polar optical observation equipment. The polar data have been carried out for 15 years of ground polar collection, accumulated a large number of polar ef-fective optical observation data. To carry out polar research has a strong data base. China Polar Research Center has established a system for polar all-sky video image processing and analysis to carry out the polar all-sky video (analog) image data digitization and coordinate transformation and so on.
Figures 1(a)-(i) shows an example of a polar image taken by an all-sky cam-era (the image of this sequence is processed to turn the original black back-ground into a white backback-ground). The sequence begins at 11:00:30 UT on June 16, 2012, ending at 23:35:02 UT on June 16, 2012, interval of each frame image is 15 minutes. The interior of circle of the camera is the observed region of view in the image of each frame. The first frame image marked the geomagnetic An- tarctic and geomagnetic north direction (white lines in the figure, the vertical direction denotes the north and south that is up south and down north, the
(a) (b) (c)
(d) (e) (f)
(g) (h) (i)
DOI: 10.4236/jcc.2017.511002 19 Journal of Computer and Communications horizontal direction is east and west that is left west and right east). From the 4, 5, 6, 7 frame which are shown Figures 1(c)-(f) in the field of view, we can clear-ly see the bright light arc cover more than half of the sky.
2.2. Similar Region of Color Algorithm
Because the integration that the hue combines with the saturation is called the color, this section gives the similar region of color algorithm, is to use the com-pared difference between the hue, luminance and saturation of the center of the chosen color and those of its similar color pixels, and based on the given appro-priate thresholds of edge, inflection and corner points, carries out the feature points extraction, i.e., edge, inflection and corner points extraction. The detec-tion algorithm to feature points is given as follows:
A characteristic point or an interest point in an interestregion is chosen, which the point is called the corepoint C. (1) If CR0 >0 exists, and label the
circle to C.The center of the circle is the point C and the radius is CR0, which contains only a kind of color pixels, then this point C is not a corner or an edge point, is a flat point. (2) For any length CR>0 and the circle C, if the center of circle is the point C and its radius is CR, all contain more than two
colors’ pixels, then the point C is not a corner or an edge or a bifurcation. The luminance I, hue H and saturation S of the core point C are compared with those of each pixel within the circle C. If the respective differences between the luminance, hue and saturation of the pixel of the core point C and those of within the circle C all are less than the given corresponding thresholds, then the core C and this point within the circle are similar or same, and some pixels that satisfy such conditions to constitute a region, which the region is called a similar region of color (SRC).
po-DOI: 10.4236/jcc.2017.511002 20 Journal of Computer and Communications sition. Then the center of circle that the color jump times is n (n>2) is
marked as a n bifurcation position.
By the times of color change, the corner point and the edge point cannot be distinguished. To distinguish between the two types of characteristic points, it needs further to extract the corner, bifurcation and the edge by the saturation, hue, luminance of the pixels, and the given thresholds. The analysis for these feature points is given as follows:
When the circle C is completely in the target or completely in the background, the area of SRC is the largest, i.e., SRC is the largest in the flat region. However, the area of SRC is gradually becoming smaller when the core point is near the corner or edge points of target. When the core point is on edge of target, the size of SRC reduces to half. When the core point lies in the corner point of target, SRC is the smallest. The basic principle of extraction algorithm for corner and edge points by using SRC can be obtained. That is, the SRC is smaller at the edge and SRC is the smallest at the corner point. The SRC algorithm is based on dif-ferent area of SRC at each point to distinguish the current point is the interior point, corner points or border points of the studied region. The size of SRC of each point in the image is acted as the distinctive measurement of the feature on this point, and then the feature of point that its SRC is the smaller is remarkable. This algorithm can quickly detect the corner points, intersections, edge points once, and no directional requirement, and these different points are called the feature points in the following. The concrete algorithm is given in the following.
The feature detection algorithm by SRC is to calculate the pixel points within the circle O of the given size in the image so as to produce the initial response of feature, then to process the initial feature response so as to obtain the final fea-ture.
The luminance I, hue H and saturation S of the core C and those of each point within the circle C are compared by similar contrast function in the following.
(
)
( ) ( )
( ) ( )
0 11 0
0 1
1, ,
0,
I p I p g
C p p
I p I p g
− ≤ = − >
(1)
(
)
( )
( )
( )
( )
0 22 0
0 2
1, ,
0,
H p H p g
C p p
H p H p g
− ≤ = − >
(2)
(
)
( )
( )
( )
( )
0 33 0
0 3
1, ,
0,
S p S p g
C p p
S p S p g
− ≤
= − >
(3)
In the formula, g1, g2 and g3 are respectively the difference thresholds of
the luminance, hue and saturation, which are the threshold values to make sure the similarity degree. The choice of gi is confirmed by the contrast degree
be-tween background and color of image. p0 is the current core position
(
x y0, 0)
. p is any other point position( )
x y, in the circle C. I p( )
0 and( )
I p , H p
( )
0 and H p( )
, S p( )
0 and S p( )
are the luminance, hue andsaturation of the core and other points in the circle C, respectively. C p pi
(
0,)
isDOI: 10.4236/jcc.2017.511002 21 Journal of Computer and Communications output, where i=1,2,3.
By comparing the luminance, the size of SRC can be computed by the formu-la:
( )
(
)
( )0
1 0 1 , 0
p c p
n p C p p
∈
=
∑
(4)
By the comparison of the hue, the size of SRC can be computed by the formu-la:
( )
(
)
( )0
2 0 2 , 0
p c p
n p C p p
∈
=
∑
(5)
By comparing the saturation, the size of SRC can be computed by the formula:
( )
(
)
( )0
3 0 3 , 0
p c p
n p C p p
∈
=
∑
(6)
The size of SRC can be finally obtained by the following equation:
( )
0 mini{
1( ) ( ) ( )
0 , 2 0 , 3 0}
n p = n p n p n p (7)
In the formulae, n p
( )
0 is the size of SRC of the core point p0, and c p( )
0is the circular region with p0 as the center of circle.
In a real image with noise, if the core is near the feature, n is not generally greater than the value 4nmax 5 based on the experimental analysis. The initial
feature response is created by the following expression:
( )
0( )
0( )
0 0 0if
0 otherwise
n n p n p n
f p = − <
(8)
In the expression, n0 is a threshold. f p
( )
0 is the response function.Through calculating the mean value of n p
( )
under the noise exists, it can be seen that the mean value is close to 0.79 but less than 0.79. Therefore, define the threshold is n0=4nmax 5, where nmax is the maximum that n p( )
0 can beobtained.
The size of initial feature response is attained by the Formula (5) accords with a rule, i.e., “the smaller the SRC is, the greater the initial feature response is”.
To make sure the feature direction, the feature is divided into two different things. The first thing is that SRC is a symmetry region of axis about pixels, i.e., there are definite distance between the position of gravity center of the pixels in SRC and the position of the core. The second thing is that the gravity center po-sition of the pixels in SRC and the popo-sition of the core are coincident or are close to superposition. The feature direction is determined in the following.
For the first case of feature, the vector direction between the gravity center position and position of core is perpendicular to the feature direction. The cen-ter of gravity is computed by the following equation:
( )
(
(
0)
)
(
)
0 0 , , , p g g p
pC p p
g p x y
C p p
=
∑
=∑
(9)
DOI: 10.4236/jcc.2017.511002 22 Journal of Computer and Communications For the second case of feature, the feature direction can be made sure by searching the longest symmetric axis of all pixels in the SRC. By the theoretical and experimental results analysis found, the connective line between the center of gravity and the core point C is the longest symmetric axis in the SRC.
For any point
(
x y,)
= p within the SRC, its symmetric point about the core(
0, 0)
C x y is p′ =
(
2x0−x y,2 0−y)
, and then the connective line between pand p′ is the feature direction, that is
0 2
0
y y k
x x
− =
− where
(
x y,)
= p,(
x y0, 0)
=p0.Based on the above analysis and discussion, the detailed computing process is given as follows:
1) Make a circle C on each pixel of image.
2) In the circle C, to use the Equations (1)-(3) to compute the luminance, hue and saturation of pixels which are similar to those of the core, and use the Equa-tions (4)-(6) to compute the number of these pixels. At time, the number of these pixels is called as the SRC.
3) Using the equation (8) to produce the feature response image.
4) Make use of center of gravity of the SRC and the longest symmetry axis to make sure the local feature direction after achieving the initial feature response.
5) Take the point position of local maximum of initial response as the feature point at the local feature vertical direction. Then, select a transform function
( )
tφ to make
( )
2(
)
, 2k 2k
k l t t l
φ
=φ
− , and let it with this local feature do the dot product in order to achieve some image smoothing, such as, enhance, refine, de-noise, eliminate the pseudo feature points, connect the discontinuous feature points, remove small branches of feature, and so on, so as to obtain a smooth, single, continuous output of the feature.3. Comparison of Proposed and Existing Algorithms for
Color Extraction of Polar Image
3.1. Comparison of Proposed and Existing Algorithms for
Color Extraction
abil-DOI: 10.4236/jcc.2017.511002 23 Journal of Computer and Communications ity which the signal to noise rate processed is 5:3. For a color image with size 365 × 550, its processing time is only 0.159 s. At the same time, since some thre-sholds such as threthre-sholds of the edge response, corner response, comparison function, can be differently set up in simulation according to actual situation and experimental analysis, the use of this algorithm is flexible.
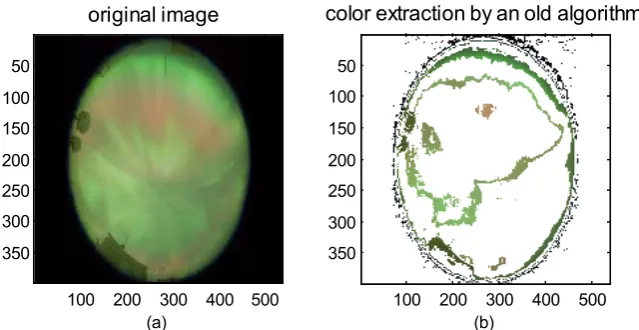
For a color image, which the hue and luminance of the color border gradually change, as shown in Figure 2(a), the probability that different color occurs in region of interest is calculated by existing algorithm, and then some colors are extracted. Simulation result is shown in Figure 2(b).
When the proposed algorithm is used to carry out some color extraction, the similarity comparison function’s threshold values for detecting corner points and edges are set upto g1=10, g2=9 and g3=11, respectively. The initial
edge response function’s threshold is set upto n0=2381. The threshold for
de-tecting the corner points is set upto nangle =1412. Simulation is carried out and
the results are shown in Figure 3(a) and Figure 3(b). Figure 3(a) is the color edge and corner points extraction, Figure 3(b) is the extraction of color.
[image:8.595.212.532.323.488.2]Figure 2. Color extraction by the existing algorithm to ambiguous color boundary of polar.
Figure 3. Color extraction by the proposed algorithm to ambiguous color boundary of polar.
(a)
original image
100 200 300 400 500 50
100 150 200 250 300 350
(b)
color extraction by an old algorithm
100 200 300 400 500 50
100 150 200 250 300 350
(a)
extraction of edge
100 200 300 400 500 50
100 150 200 250 300 350
(b)
extraction of color by the proposed algorithm
100 200 300 400 500 50
[image:8.595.213.517.534.687.2]DOI: 10.4236/jcc.2017.511002 24 Journal of Computer and Communications It can be seen from Figure 2 and Figure 3, for color extraction by using the two algorithms to ambiguous color boundary of polar, extraction effect of exist-ing algorithm is not too well, because some colors extracted is lost. However, the proposed algorithm regards the unclear borderline color as a flat region to ex-tract it, so it can well use most color information.
3.2. Color Extraction Based on the Combination between
Proposed and Existing Algorithms
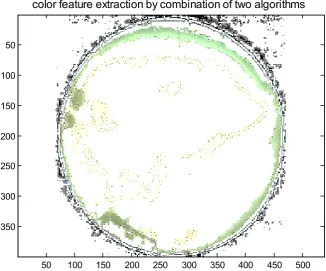
If the proposed algorithm and the existing algorithm are combined with, for a color image that the color boundary is not obvious, as shown in Figure 2(a), the extraction effect of color by the combined method is better than that of the sin-gle two algorithms, because the extraction effect of color not only is more ob-vious, but also the detection rate to characteristic points such as edges, corner points, etc., is higher, as well as the anti-noise ability is strong. The extraction result of feature points of color is shown in Figure 4.
4. Conclusions
[image:9.595.210.537.423.694.2]This paper discusses the color features of polar images, presents the feature ex-traction of three-dimensional parameter color polar images, studies the feature extraction algorithm, as well as gives the comparison and experiment between the proposed and existing algorithms to color of polar image. Finally, for color feature extraction of polar image, the extraction effects which are given by the
Figure 4. Extraction of feature points of color by combination of proposed and existing algorithms.
color feature extraction by combination of two algorithms
50 100 150 200 250 300 350 400 450 500
50
100
150
200
250
300
DOI: 10.4236/jcc.2017.511002 25 Journal of Computer and Communications proposed algorithm and an existing extraction algorithm to feature of color im-age are compared. For the proposed algorithm to extract the features of color of polar image, such as edges, corners, bifurcation points, and so on, the simulation results show that it has some merits such as stronger anti-noise ability, faster processing speed, better extraction effect, more flexible use, as well as the direc-tion informadirec-tion detecdirec-tion of feature points, because its processing time is faster by 0.369s and its eliminating noise ability is stronger by 10% than those of exist-ing algorithms.
How to extract simultaneously the comparative characteristics of the lumin-ance, hue and saturation of color image will need to be studied in the future work.
Acknowledgements
This work is supported by Henan Province Outstanding Youth on Science and Technology Innovation (No. 164100510017); National 973 Program (No. 613237), respectively.
References
[1] Alamdar, F. and Keyvanpour, M.R. (2011) A New Color Feature Extraction Method Based on Quad Histogram. Procedia Environmental Sciences, 10, 777-783.
https://doi.org/10.1016/j.proenv.2011.09.126
[2] Ilbeygi, M. and Shah-Hosseini, H. (2012) A Novel Fuzzy Facial Expression Recogni-tion System Based on Facial Feature ExtracRecogni-tion from Color Face Images. Engineer-ing Applications of Artificial Intelligence, 25, 130-146.
https://doi.org/10.1016/j.engappai.2011.07.004
[3] Aydın, D. and Uğur, A. (2011) Extraction of Flower Regions in Color Images Using Ant Colony Optimization. Procedia Computer Science, 3, 530-536.
https://doi.org/10.1016/j.procs.2010.12.088
[4] Chen, J. and Bao, Q.F. (2012) Digital Image Processing Based Fire Flame Color and Oscillation Frequency Analysis. Procedia Engineering, 45, 595-601.
https://doi.org/10.1016/j.proeng.2012.08.209
[5] Lissner, I. and Urban, P. (2012) Toward a Unified Color Space for Perception-Based Image Processing. IEEE Transactions on Image Processing, 21, 1153-1168.
https://doi.org/10.1109/TIP.2011.2163522
[6] Korytkowski, M., Rutkowski, L. and Scherer, R. (2016) Fast Image Classification by Boosting Fuzzy Classifiers. Information Sciences, 327, 175-182.
https://doi.org/10.1016/j.ins.2015.08.030
[7] Smith, S.M. (1997) Susan—A New Approach to Low Level Image Processing. In-ternational Journal of computer Vision, 23, 45-78.
https://doi.org/10.1023/A:1007963824710
[8] Jukić, A., Kopriva, I. and Cichocki, A. (2013) Noninvasive Diagnosis of Melanoma with Tensor Decomposition-Based Feature Extraction from Clinical Color Image. Biomedical Signal Processing and Control, 8, 755-763.
https://doi.org/10.1016/j.bspc.2013.07.001
DOI: 10.4236/jcc.2017.511002 26 Journal of Computer and Communications Letters, 34, 1230-1239. https://doi.org/10.1016/j.patrec.2013.04.016
[10] Dimitriou, N. and Delopoulos, A. (2015) Incorporating Higher Order Models for Occlusion Resilient Motion Segmentation in Streaming Videos. Image and Vision Computing, 36, 70-82. https://doi.org/10.1016/j.imavis.2015.01.005
Submit or recommend next manuscript to SCIRP and we will provide best service for you:
Accepting pre-submission inquiries through Email, Facebook, LinkedIn, Twitter, etc. A wide selection of journals (inclusive of 9 subjects, more than 200 journals)
Providing 24-hour high-quality service User-friendly online submission system Fair and swift peer-review system
Efficient typesetting and proofreading procedure
Display of the result of downloads and visits, as well as the number of cited articles Maximum dissemination of your research work