Challenges of studying and processing dialects in social media
Anna Katrine Jørgensen, Dirk Hovy, and Anders Søgaard University of Copenhagen
Njalsgade 140 DK-2300 Copenhagen S
Abstract
Dialect features typically do not make it into formal writing, but flourish in social media. This enables large-scale variational studies. We fo-cus on three phonological features of African American Vernacular English and their manifestation as spelling variations on Twitter. We discuss to what extent our data can be used to falsify eight sociolinguistic hypothe-ses. To go beyond the spelling level, we require automatic analysis such as POS tagging, but social me-dia language still challenges language technologies. We show how both newswire- and Twitter-adapted state-of-the-art POS taggers perform signif-icantly worse on AAVE tweets, sug-gesting that large-scale dialect studies of language variation beyond the sur-face level are not feasible with out-of-the-box NLP tools.
1 Introduction
Dialectal and sociolinguistic studies are tradi-tionally based on interviews of small sets of speakers of each variety. TheAtlas of North American English (Labov et al., 2005) has been the reference point for American dialec-tology since its completion, but is based on only 762 speakers. Dallas is represented by
four subjects, the New York City dialect by six, etc. Data is costly to collect, and, as a consequence, scarce.
Written language was traditionally used for formal purposes, and therefore differed in style from colloquial, spoken language. How-ever, with the rise of social media platforms and the vast production of user generated con-tent, differences between written and spoken language diminish. A number of recent papers have explored social media with respect to sociolinguistic and dialectological questions (Rao et al., 2010; Eisenstein, 2013; Volkova et al., 2013; Doyle, 2014; Hovy et al., 2015; Volkova et al., 2015; Johannsen et al., 2015; Hovy and Søgaard, 2015; Eisenstein, to ap-pear). Emails, chats and social media posts serve purposes similar to those of spoken lan-guage, and consequently, features of spoken language, such as interjections, ellipses, and phonological variation, have found their way into this type of written language. Our work differs from most previous approaches by in-vestigating several phonological spelling cor-relates of a specific language variety.
on Twitter. Both authors note various method-ological problems using Twitter as a source of evidence for dialectal and sociolinguistic stud-ies, including what we refer to as USERPOP -ULATIONBIASand TOPIC BIASbelow.
In this paper, we collect Twitter data to test eight (8) research hypotheses originating in sociolinguistic studies of African-American Vernacular English (AAVE). The hypotheses relate to three phonological features of AAVE, namely derhotacization, interdental fricative mutation, and backing in /str/. Some of our findings shed an interesting light on existing hypotheses, but our main focus in this paper is to identify the methodological challenges in using social media for testing sociolinguistic hypotheses.
Almost all previous large-scale variational studies using social media have focused on spelling variation andlexical markers of alect. Ours is no exception. However, di-alectal variation also manifests itself at the morpho-syntactic level. To investigate this variation, we also annotate some data with part-of-speech (POS) tags, using two NLP systems. This approach reveals a severe methodological challenge: sentences contain-ing AAVE features are associated with signif-icant drops in tagger performance.
This result challenges large-scale varia-tional studies on social media that require au-tomated analyses. The observed drops in per-formance are prohibitive for studying syntac-tic and semansyntac-tic variation, and we believe the NLP community should make an effort to pro-vide better and more robust dialect-adapted models to researchers and industry interested in processing social media. The findings also raise the question of whether NLP technology systematically disadvantages groups of non-standard language users.
1.1 Contributions
• We identify eight (8) research hypotheses from the sociolinguistic literature. We test them in a study of the distribution of three phonological features typically as-sociated with AAVE in Twitter data. We test the features’ correlations with vari-ous demographic variables. Our results falsify the hypothesis that AAVE is male-dominated (but see§3.1).
• We identify five (5) methodological problems common to variational studies in social media and discuss to what ex-tent they compromise the validity of re-sults.
• Further, we show that state-of-the-art newswire and Twitter POS taggers per-form much worse on tweets containing AAVE features. This suggests an addi-tional limitation to large-scale sociolin-guistic research using social media data, namely that it is hard to analyze varia-tion beyond the lexical level with current tools.
1.2 Sociolinguistic hypotheses
AAVE is, in contrast to other North American dialects, not geographically restricted. Al-though variation in AAVE does exist, AAVE in urban settings has been established as a uniform system with suprasegmental norms (Ash and Myhill, 1986; Labov et al., 2005; Labov, 2006; Wolfram, 2004). This paper considers the following eight (8) hypotheses from the sociolinguistic literature about AAVE as a ethnolect:
H1: AAVE is an urban ethnolect (Rickford, 1999; Wolfram, 2004).
H3: The likelihood of speaking AAVE correlates negatively with income and educational level, and AAVE is more frequently appropriated by men (Rickford, 1999; Rickford, 2010).
H4: Derhotacization is more frequent in African Americans than in European Americans (Labov et al., 2005; Rickford, 1999).
H5: Derhotacization is negatively correlated with in-come and educational level (Rickford, 1999). H6: Interdental fricative mutation is more frequent in
AAVE than in European American speech (Pol-lock et al., 1998; Thomas, 2007).
H7: Interdental fricative mutation is predominantly found in the Gulf states (Rastogi et al., 2011). H8: Backing in /str/ (to /skr/) is unique to AAVE
(Rickford, 1999; Thomas, 2007; Labov, 2006).
Hypotheses 1–8 are investigated by corre-lating the distribution of phonological variants in geo-located tweets with demographic infor-mation.
Our method is similar to those proposed by Eisenstein (2013) and Doyle (2014), lend-ing statistical power to sociollend-inguistic analy-ses, and circumventing traditional issues with data collection such as the Observer’s Para-dox (Labov, 1972b; Meyerhof, 2006). Our work differs from previous work by studying phonologicalrulesassociated with specific di-alects, as well as considering a wide range of actual sociolinguistic research hypotheses, but our main focus is the methodological prob-lems doing this kind of work, as well as as-sessing the limitations of such work.
1.3 Methodological problems
One obvious challenge relating social media data to sociolinguistic studies is that there is generally not a one-to-one relationship between phonological variation and spelling variation. People, in other words, do not spell the way they pronounce. Eisenstein (2013) discusses this challenge ((1) WRITINGBIAS),
but shows that effects of the phonological en-vironment carry over to social media, which he interprets as evidence that there is at least
some causal link between pronunciation and spelling variation.
A related problem is that non-speakers of AAVE may cite known features of AAVE with specific purposes in mind. They may use it in citations, for example:
(1) My 5 year old sister texted me on my mums phone saying “why did you take a picher in da bafroom” lool okay b (Twitter, Feb 21 2015)
or in meta-linguistic discussions:
(2) Whenever I hear a black person inquire about the location of the ”bafroom”... (Twitter, Jan 20 2015)
We refer to these phenomena as (2) META -USE BIAS. This bias is important with rare
phenomena. With ”bafroom”, it seems that about 1 in 20 occurrences on Twitter are meta-uses. Meta-uses may also serve social func-tions. AAVE features are used as cultural markers by Latinos in North Carolina (Carter, 2013), for example.
Some of the research hypotheses consid-ered (H3andH5) relate to demographic vari-ables such as income and educational levels. While we do not have socio-economic infor-mation about the individual Twitter user, we can use the geo-located tweets to study the correlation between socio-economic variables and linguistic features at the level of cities or ZIP codes.1
Eisenstein et al. (2011) note that this level of abstraction introduces some noise. Since Twitter users do not form representative sam-ples of the population, the mean income for a city or ZIP code is not necessarily the mean income for the Twitter users in that area. We refer to this problem as the (3) USER POPU -LATIONBIAS.
Another serious methodological problem known as (4) GALTON’S PROBLEM (Naroll,
1961; Roberts and Winters, 2013), is the ob-servation that cross-cultural associations are
1Unlike many others, we rely on physical locations
often explained by geographical diffusion. In other words, it is the problem of discrimi-nating historical from functional associations in cross-cultural surveys. Briefly put, when we sample tweets and income-levels from US cities, there is little independence between the city data points. Linguistic features dif-fuse geographically and do not change at ran-dom, and we can therefore expect to see more spurious correlations than usual. Like with the famous example of chocolate and Nobel Prize winners, our positive findings may be explained by hidden background variables. A positive correlation between income-level and a phonological pattern may also have cultural, religious or geographical explanations.
Reasons to be less worried about GAL -TON’S PROBLEMin our case, include that a)
we only consider standard hypotheses from the sociolinguistics literature and not a huge set of previously unexplored, automatically generated hypotheses, b) we sample data points at random from all across the US, giv-ing us a very sparse distribution compared to country-level data, but more notably, c) location is an important, explicit variable in our study. GALTON’S PROBLEMis typically
identified by clustering tests based on loca-tion (Naroll, 1961). Obviously, the phono-logical features considered here cluster geo-graphically, as evidenced by our geographic correlations in Table 2, but since our studies explicitly test the influence of location, it is not the case for most of the hypotheses con-sidered here that geographic diffusion is the underlying explanation for something else.
In §3, we discuss whether these four methodological problems compromise the va-lidity of our findings. One other methodolog-ical problems that may be relevant for other studies of dialect in social media, is almost completely irrelevant for our study: It is often important to control for topic in dialectal and
sociolinguistic studies (Bamman et al., 2014), e.g., when studying the lexical preferences of speakers of urban ethnolects. We call this problem (5) TOPIC BIAS. Using word pairs
with equivalent meanings for our studies, we implicitly control for topic (but see§3.1).
Feature Positive Negative Total count
/r/→/Ø/ or /@/
brotha brother 9528
foreva forever 3673
hea here 4352
lova lover 1273
motha mother 4668
ova over 3441
sista sister 5325
wateva whatever 2974
wea where 5153
total 40,387
/str/→/skr/
skreet street 1226
skrong strong 1629
skrip strip 1101
total 3956
/D/→/d/ or /v/
brova brother 3715
dat that 2610
deez these 4477
dem them 3645
dey they 2434
dis this 2135
mova mother 2462
total 21,478
/T/→/t/ or /f/
mouf mouth 3861
nuffin nothing 2861
souf south 1102
teef teeth 1857
trough through 2804
trow throw 1090
total 13,575
[image:4.595.329.483.193.418.2]All tweets 79,396
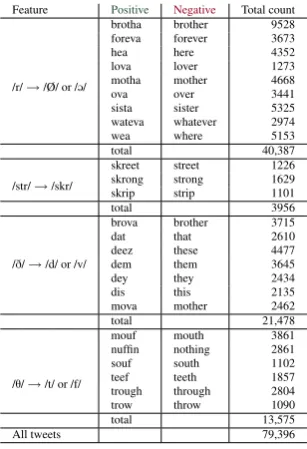
Table 1: Word pairs and counts
2 Data and Method
We focus on derhotacization, backing in /str/, and interdental fricative mutation. Specifi-cally, we collect data to study the following four phonological variations (the latter two are both instances of interdental fricative muta-tion): a) derhotacization: /r/ → /Ø/ or /@/,
b) /str/→/skr/, c) /D/→ /d/ or /v/ and,d) /T/
→/t/ or /f/.
In non-rhotic dialects, /r/ is either not pro-nounced or is approximated as a vocalization in the surface form, when /r/ is in a pre-vocalic position. This can result in an elongation of the preceding vowel or in an off-glide schwa /@/, e.g.,guard→/gA:d/,car→/ka:/,fear→
/fi@/ (Thomas, 2007).
of /str/ for /skr/ in word-initial positions re-sulting in pronunciations such as /skrit/ for street, /skrAN/ forstrongand /skrIp/ forstrip.
Backing in /str/ has been reported to be a unique feature in AAVE, as it is unheard in other North American dialects (Rickford, 1999; Labov, 1972a; Thomas, 2007).
The two interdental fricative mutations re-late to substitutions of /D/ and /T/ by /d/, /v/
and /t/, /f/ in words such as that andmother or nothing and with. It has been reported that mutations of /D/ and /T/ are more
com-mon acom-mong African Americans than acom-mong European Americans and that the frequency of the mutations is inversely correlated with socio-economic levels and formality of speak-ing (Rickford, 1999).
We follow Eisenstein (2013) and Doyle (2014) in assuming that spelling variation may be a result of phonological differences and select 25 word pairs for our study (Tabel 1). For each word pair, we collect positive (e.g., ”skreet”) and negative occurrences (e.g., ”street”), resulting in a total number of 79,396 tweets. The word pairs were chosen based on the unambiguity, frequency and representabil-ity of the phonological variations. Uniquely, backing in /str/ is represented by three word pairs of high similarity, which is due to phono-logical restrictions on the variation of /str/ to /skr/ and to the fact that backing in /str/ is a very rare phenomena.
The Twitter data used in the experiments was gathered from May to August 2014 us-ing TwitterSearch.2 We only collected tweets with geo-locations in the contiguous United States, from users reporting to tweet in En-glish, and which were also predicted to be in English using langid.py.3 The demo-graphic information was obtained from the 2012 American Community Survey from the
2https://pypi.python.org/pypi/TwitterSearch/ 3https://pypi.python.org/pypi/langid
[image:5.595.332.501.199.298.2]United States Census Bureau, as was informa-tion about populainforma-tion sizes in US cities. We linked each tweet in our data to demographic information using the geo-coordinates of the tweet and its nearest city in the following way.
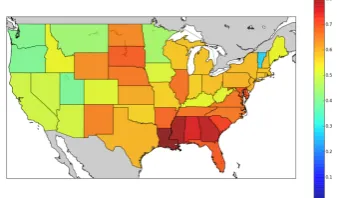
Figure 1: The ratio of AAVE examples over US states
For the 110 US cities of≥200,000 inhabi-tants, we gathered information about: a) per-centage high school graduates, b) percent-age below poverty level, c) population size, d) median household income,e) percentage of males,f) percentage between 15 and 24 years old, g) percentage of African Americans and h) unemployment rate.
The overall geographical distribution of our data is shown in Figure 1. The map shows that we see more tweets with AAVE features in the Gulf states, in particular Louisiana, Mis-sissippi and Georgia. This lends preliminary support toH2.
3 Results with phonological features
Feature word pairs male black 15-24 citysize highschool income poverty unemployment
/r/→/Ø/ or /@/
brotha/brother *** ** – – ** – – –
foreva/forever ** *** – – – – ** –
hea/here – *** ** *** *** *** *** *
lova/lover – – – – *** * ** –
motha/mother – ** – * – ** – –
ova/over *** *** – – – *** *** –
sista/sister * *** – – ** – – –
wateva/whatever *** *** – – – *** *** –
wea/where ** *** *** *** *** *** *** *
total *** *** *** *** *** *** *** –
/str/→/skr/
skreet/street – – – ** * ** * **
skrong/strong ** *** – * ** ** ** *
skrip/strip * – * *** *** – *** ***
total *** *** – *** *** *** –
-/D/→/d/ or /v/
brova/brother *** *** *** *** *** – *** ***
dat/that – *** – – – ** ** –
deez/these – – – ** *** – ** ***
dem/them * *** ** ** *** – – –
dey/they *** *** ** * ** ** *** –
dis/this – *** ** – – – * *
mova/mother *** *** *** – *** *** – ***
total *** *** *** – *** – *** ***
/T/→/t/ or /f/
mouf/mouth ** – – – – – – –
nuffin/nothing *** *** *** *** *** *** – ***
souf/south *** – ** – ** – *** ***
teef/teeth – – – – ** – – –
trough/through – – – – ** – * *
trow/throw * – – *** ** * ** **
total *** *** *** *** – ** – *
[image:6.595.122.473.98.322.2]– = p≥0.05, * = 0.05>p≥0.01, ** = p≤0.01, , *** = p≤0.0005 Shading corresponds to negative correlations
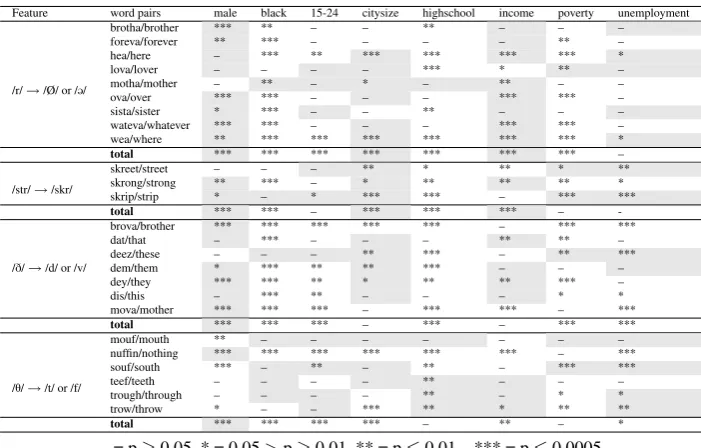
Table 3: Demographic correlations
of African Americans (with explained vari-ances in the range of 0.03-0.05).
Our data suggests that H2, namely that AAVE is more prevalent in the Gulf states, is probably true. HypothesisH1, that AAVE is an urban ethnolect, lends some support in our data, but the correlation with urbanicity is weaker (and negatively correlated or non-significant in half of the cases).
Our data only lends limited support to the first half of hypothesis H3. While derhota-cization and /str/ correlate (negatively) signif-icantly with income levels, we see no signifi-cant correlations within /D/ and a positive
cor-relation within /T/. However, our data does not
suggest thatH3is false, either. Our data does lend support to the more specific hypothesis
H5, namely that derhoticization is sensitive to income level, while the strong correlation with the distribution of African Americans lends support toH4.
More interestingly, our data suggests that women use AAVE features more often than
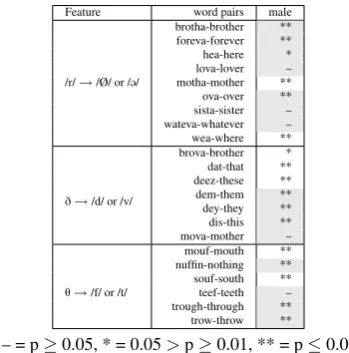
men, i.e., there is a negative correlation be-tween male gender and AAVE features, con-trary to the second half of H3, namely that AAVE is more frequently appropriated by men. Note, however, that our gender ratios are aggregated for city areas, and with the de-mographic bias of Twitter, these correlations should be taken with a grain of salt. Consider-ing the small gender ratio differences, we also compute correlations between our linguistic features and gender using the Rovereto Twit-ter N-gram Corpus (RTC) (Herdagdelen and Baroni, 2011).4 The RTC corpus contains in-formation about the gender of the tweeter as-sociated with n-grams. While there is too lit-tle data in the corpus to correlate gender and backing in /str/, derhotacization and both in-terdental fricative mutations (/D/→/d/ or /v/
and /T/→/t/ or /f/) correlate significantly with
women. Out of our words, 10 correlate
sig-4http://clic.cimec.unitn.it/amac/
Feature word pairs latitude longitude urban Gulf
/r/
brotha/brother *** *** *** ***
foreva/forever *** ** – ***
hea/here *** *** * ***
lova/lover *** *** ** ***
motha/mother – – *** –
ova/over *** – – ***
sista/sister – *** ** ***
wateva/whatever *** *** ** ***
wea/where *** *** – ***
total *** *** *** ***
/str/
skreet/street *** – *** ***
skrong/strong *** * *** ***
skrip/strip *** – *** ***
total *** ** – ***
/D/
brova/brother *** *** *** ***
dat/that *** * – ***
deez/these * *** – –
dem/them *** *** – ***
dey/they *** *** – ***
dis/this *** – – ***
mova/mother * *** *** ***
total *** *** *** ***
/T/
mouf/mouth *** – – ***
nuffin/nothing *** *** *** ***
souf/south *** *** *** ***
teef/teeth ** – ** ***
trough/through – *** – –
trow/throw *** ** – ***
total * *** *** ***
– = p≥0.05, * = 0.05>p≥0.01, ** = p≤0.01, *** = p≤0.0001
[image:7.595.92.288.97.331.2]Shading corresponds to negative correlations
Table 2: Geographic correlations
nificantly with female speakers; seven with male. The correlations are found in Table 4. For each feature, certain words correlate sig-nificantly with female speakers, while oth-ers correlate significantly with male speakoth-ers. Consequently, neither our Twitter data not the Twitter data in the RTC suggest that AAVE is more often appropriated by men. We discuss whether our data provides a basis for falsify-ing the second half ofH3in§3.1.
The high correlation between mutations of /D/ and longitude supports the presence of
these mutations of /D/ in non-standard
north-ern varieties (Rickford, 1999). The mutation of /T/ is also correlated with longitude, and
with latitude, suggesting an Eastern Ameri-can feature rather than a distinct Southern fea-ture (Rickford, 1999). The variation in muta-tions could possibly be explained by both ge-ography as well as the distribution og African Americans.
There is evidence in our data that backing
in /str/ (to /skr/) is appropriated more often by AAVE speakers than by speakers of other di-alects (H8). There is also a negative correla-tion between latitude and backing in /str/ as well as a strong positive correlation with the Gulf states, suggesting that backing in /str/ is a feature primarily seen in this region. The data thereby suggests that the feature is appropri-ated significantly more by African Americans than by speakers of the Southern dialect.
In sum, while our data lends support to sev-eral of the common hypotheses from the so-ciolinguistics literature, we found one unex-pected tendency, going against the second half ofH3, namely that AAVE features were found more often with females. We now discuss this finding in light of the methodological prob-lems discussed in§1.2.
Feature word pairs male
/r/→/Ø/ or /@/
brotha-brother ** foreva-forever **
hea-here *
lova-lover –
motha-mother **
ova-over **
sista-sister –
wateva-whatever –
wea-where **
D→/d/ or /v/
brova-brother *
dat-that **
deez-these **
dem-them **
dey-they **
dis-this **
mova-mother –
T→/f/ or /t/
mouf-mouth **
nuffin-nothing **
souf-south **
teef-teeth –
trough-through **
trow-throw **
– = p≥0.05, * = 0.05>p≥0.01, ** = p≤0.01 Shading corresponds to negative correlations
Table 4: Gender correlations in RTC
3.1 Is AAVEnotmale-dominated?
We now discuss whether our data falsifies the second half of H3, one methodological problem at a time (see §1.3). If WRITTEN
BIAS were to bias our conclusions, one
[image:7.595.316.491.354.531.2]well-established that women tend to be more lin-guistically creative and have larger vocabular-ies (Labov, 1990; Brizendine, 2006). Whether women are also more meta-linguistic (META -USE BIAS), has to the best of our
knowl-edge not been studied. Since genders are al-most equally geographically distributed, and since Twitter is generally considered gender-balanced, neither USER POPULATION BIAS
nor GALTON’SPROBLEMis likely to bias our
conclusions. TOPICBIAS, on the other hand,
may. While our semantically equivalent pairs control for topic, the pragmatics sometimes differ. Just like code-switching is a strategy for bilinguals, using the spelling motha in-stead of mother could mean something, say irony, which one gender is more prone for. In sum, while we do believe that our data should lead sociolinguists to question whether AAVE is male-dominated, our findings may be bi-ased by WRITTENBIAS.
4 POS tagging
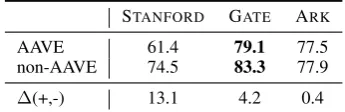
We need automated syntactic analysis to study morpho-syntactic dialectal variation. We ran a state-of-the-art POS tagger trained on newswire5(STANFORD), as well as two state-of-the-art POS taggers adapted to Twitter, namely GATE6 and ARK7, on our data. We
had one professional annotator manually an-notate 100 positive (AAVE) and 100 nega-tive (non-AAVE) sentences using the coarse-grained tags proposed by Petrov et al. (2011). We map the tagger outputs to those tags and report tagging accuracies. See Table 5 for re-sults, with ∆(+,−) being the absolute dif-ference in performance from non-AAVE to AAVE.
5http://nlp.stanford.edu/software/
tagger.shtml
6https://gate.ac.uk/wiki/
twitter-postagger.html
7http://www.ark.cs.cmu.edu/
TweetNLP/
STANFORD GATE ARK
AAVE 61.4 79.1 77.5
non-AAVE 74.5 83.3 77.9
[image:8.595.319.492.101.157.2]∆(+,-) 13.1 4.2 0.4
Table 5: POS tagging accuracies (%)
While GATEis certainly better than STAN -FORD on our data, performance is generally
poor and prohibitive of many downstream ap-plications and variational studies. We also note that both the best and worst tagger per-form significantly worse on AAVE tweets than on non-AAVE tweets. What are the sources of error in the AAVE data? One ex-ample is the word brotha, which is tagged as a both an adverb, a verb, and as X (foreign words, mark-up, etc.). Contractions likefinna (”fixing to” meaning ”going to”) and gimme (”give me”) are often tagged as particles, but annotated as verbs or, as in the case ofwitchu (”with you”), as a preposition. Another inter-esting mistake is tagging adverbial like as a verb.
5 Conclusion
Large-scale variational studies of social me-dia can be used to question received wisdom about dialects, lending support to some soci-olinguistic research hypotheses and question-ing others. However, we caution that our re-sults were biased by several factors, includ-ing the representativity of the social media user bases. We also show how state-of-the-art POS taggers are more likely to fail on dialects in social media. The performance drops may be considered prohibitive of study-ing morph-syntactic patterns across dialects and as a challenge to us as a community.
References
Sankoff, editor, Diversity and Diachronyc, pages 33–44, Amsterdam and Philadelphia. John Benjamins Publishing Co.
David Bamman, Jacob Eisenstein, and Tyler Sch-noebelen. 2014. Gender identity and lexical variation in social media. Journal of Sociolin-guistics, 18.
Louann Brizendine. 2006. The Female Brain. Morgan Road Books.
Phillip Carter. 2013. Shared spaces, shared structures: Latino social formation and African American English in the U.S. south. Journal of Sociolinguistics, 17:66–92.
Gabriel Doyle. 2014. Mapping dialectal varia-tion by querying social media. InEACL, pages 98–106, Gothenburg, Sweden. Association for Computational Linguistics.
Jacob Eisenstein, Noah A. Smith, and Eric Xing. 2011. Discovering sociolinguistic associations with structured sparsity. InACL.
Jacob Eisenstein. 2013. Phonological factors in social media writing. InNAACL Workshop on Language Analysis in Social Media, pages 11– 19, Atlanta, Georgia. Association for Computa-tional Linguistics.
Jacob Eisenstein. to appear. Systematic patterning in phonologically-motivated orthographic vari-ation.Journal of Sociolinguistics.
Mark Graham, Scott Hale, and Devin Gaffney. 2014. Where in the world are you? Geoloca-tion and language identificaGeoloca-tion on Twitter.The Professional Geographer, 66(4).
Amac Herdagdelen and Marco Baroni. 2011. Stereotypical gender actions can be extracted from web text. Journal of the American So-ciety for Information Science and Technology, 62:1741–1749.
Dirk Hovy and Anders Søgaard. 2015. Tag-ging performance correlates with author age. In
ACL.
Dirk Hovy, Anders Johannsen, and Anders Søgaard. 2015. User review-sites as a source for large-scale sociolinguistic studies. In
WWW.
Anders Johannsen, Dirk Hovy, and Anders Søgaard. 2015. Cross-lingual syntactic varia-tion over age and gender. InCoNLL.
William Labov, Sharon Ash, and Charles Boberg. 2005. The Atlas of North American En-glish Phonetics, Phonology and Sound Change. Mouton de Gruyter, New York, NY.
William Labov. 1972a. Language in the Inner City: Studies in the Black English Vernacular. University of Pennsylvania Press.
William Labov. 1972b. Sociolingustic Patterns. University of Pennsylvania Press, Philadelphia, PA.
William Labov. 1990. The intersection of sex and social class in the course of linguistic change.
Language Variation and Change, 2:205–254, 7. William Labov. 2006. Unendangered dialects, endangered people. In Natalie Schilling-Estes, editor,GURT’06.
Miriam Meyerhof. 2006. Introducing Sociolin-guistics. Routledge.
R Naroll. 1961. Two solutions to Galton’s prob-lem.Philosophy of Science, 28.
Slav Petrov, Dipanjan Das, and Ryan McDonald. 2011. A universal part-of-speech tagset. CoRR abs/1104.2086.
K.E. Pollock, G. Bailey, M. Berni, D. Fletcher, L. Hinton, I. Johnson, J. Roberts, and R. Weaver. 1998. Phonologi-cal features of african american english. http://www.rehabmed.ualberta.ca/spa/phono-logy/features.htm.
Delip Rao, David Yarowsky, Abhishek Shreevats, and Manaswi Gupta. 2010. Classifying la-tent user attributes in twitter. InProceedings of the 2nd International Workshop on Search and Mining User-generated Contents, pages 37–44. ACM.
Sonya Rastogi, Tallese D. Johnson, Elizabeth M. Hoeffel, and Malcolm P. Drewery Jr. 2011. The black population: 2010. Technical report, US Census, September.
John Rickford. 2010. Geographical diversity, res-idential segregation, and the vitality of african american vernacular english and its speakers.
Transforming Anthropology, 18(1):28–34. Sean Roberts and James Winters. 2013.
Linguis-tic diversity and traffic accidents: lessons from statistical studies of cultural traits. PLoS ONE, 8(8).
Eric Thomas. 2007. Phonological and phonetic characteristics of african american vernacular english. Language and Linguistic Compass, 1(5):450–475.
Svitlana Volkova, Theresa Wilson, and David Yarowsky. 2013. Exploring demographic lan-guage variations to improve multilingual senti-ment analysis in social media. InEMNLP. Svitlana Volkova, Yoram Bachrach, Michael
Arm-strong, and Vijay Sharma. 2015. Inferring la-tent user properties from texts published in so-cial media (demo). InAAAI.