Proceedings of the 2nd Workshop on Speech and Language Processing for Assistive Technologies, pages 128–136,
Experimental Identification of the Use of Hedges in the Simplification of
Numerical Expressions
Susana Bautista and Raquel Herv´as and Pablo Gerv´as
Universidad Complutense de Madrid, Spain
{raquelhb,subautis}@fdi.ucm.es, [email protected]
Richard Power and Sandra Williams
Department of Computing, The Open University, Milton Keynes MK76AA, UK
{r.power,s.h.williams}@open.ac.uk
Abstract
Numerical information is very common in all kinds of documents from newspapers and magazines to household bills and wage slips. However, many people find it difficult to un-derstand, particularly people with poor educa-tion and disabilities. Sometimes numerical in-formation is presented with hedges that mod-ify the meaning. A numerical hedge is a word or phrase employed to indicate explicitly that some loss of precision has taken place (e.g., “around”) and it may also indicate the di-rection of approximation (e.g., “more than”). This paper presents a study of the use of nu-merical hedges that is part of research inves-tigating the process of rewriting difficult nu-merical expressions in simpler ways. We car-ried out a survey in which experts in numer-acy were asked to simplify a range of pro-portion expressions and analysed the results to obtain guidelines for automating the simplifi-cation task.
1 Introduction
All public information services and documents should be accessible in such a way that makes them easily understood by everybody, according to the United Nations (1994). Nowadays, a large percent-age of information expressed in daily news comes in the form of numerical expressions (statistics of economy, demography data, etc). But many people have problems with understanding such expressions -e.g., people with limited education or some kind of mental disability.
Lack of ability to understand numerical informa-tion is an even greater problem than poor literacy. A U.K. Government Survey in 2003 estimated that 6.8 million adults had insufficient numeracy skills to perform simple everyday tasks such as paying house-hold bills and understanding wage slips, and 23.8 million adults would be unable to achieve grade C in the GCSE maths examination for 16 year-old school children (Williams et al., 2003).
A first possible approach to solve this impor-tant social problem is making numerical informa-tion accessible by rewriting difficult numerical ex-pressions using alternative wordings that are easier to understand. Some loss of precision could have positive advantages for numerate people as well as less numerate. Such an approach would require a set of rewriting strategies yielding expressions that are linguistically correct, easier to understand than the original, and as close as possible to the original meaning.
In rewriting, hedges play an important role. For example,“50.9%” could be rewritten as “just over half” using the hedge “just over”. In this kind of simplification, hedges indicate that the original num-ber has been approximated and, in some cases, also the direction of approximation.
are trying to simplify numerical expressions without losing substantial information. Our study does not have a particular kind of disability in mind. Rather, we aim to simplify according to levels of difficulty defined in the Mathematics Curriculum of the Quali-fications and Curriculum Authority (1999). Adapta-tion to particular types of users is beyond the scope of this paper.
2 Background
Text simplification, a relative new task in Natu-ral Language Processing, has been directed mainly at syntactic constructions and lexical choices that some readers find difficult, such as long sentences, passives, coordinate and subordinate clauses, ab-stract words, low frequency words, and abbrevia-tions. Chandrasekar et al. (1996) introduced a two-stage process, first transforming from sentence to syntactic tree, then from syntactic tree to new sen-tence; Siddharthan (2002) instead proposed a three-stage process comprising analysis, transformation and generation. In 1998, the project PSET (Car-roll et al., 1998) employed lexical as well as syn-tactic simplifications. Other researchers have fo-cused on the generation of readable texts for readers with low basic skills (Williams and Reiter, 2005), and for teaching foreign languages (Petersen and Ostendorf, 2007). There has been some previous work on numerical expressions but more for experts than for people who have difficulties with numer-acy (Ellen Peters and Dieckmann, 2007), (Nathan F. Dieckmann and Peters, 2009), (Ann M. Bisantz and Munch, 2005), (Mishra H, 2011). However, to our knowledge, there have been no previous at-tempts to automatically simplifynumerical informa-tion in texts.
A corpus of numerical expressions was collected for the NUMGEN project (Williams and Power, 2009). The corpus contains 10 sets of newspaper ar-ticles and scientific papers (110 texts in total). Each set is a collection of articles on the same topic — e.g., the increased risk of breast cancer in red meat eaters, and the decline in the puffin population on the Isle of May. Within each set, identical numeri-cal facts are presented in a variety of linguistic and mathematical forms.
3 Experiment
Our survey took the form of a questionnaire in which participants were shown a sentence contain-ing one or more numerical expressions which they were asked to simplify using hedges if necessary.
3.1 Materials
Our simplification strategies are focused at two lev-els: decimal percentages and whole-number per-centages. For the survey we chose three sets of can-didate sentences from the NUMGEN corpus: eight sentences containing only decimal percentages and two sets of eight sentences containing mixed whole-number and decimal percentages. The whole-number of numerical expressions are more than eight because some sentences contained more than one proportion expression.
A wide spread of proportion values was present in each set, including the two end points at nearly 0.0 and almost 1.0. We also included some numerical expressions with hedges and sentences from differ-ent topics in the corpus. In short, we included as many variations in context, precision and different wordings as possible.
3.2 Participants
We carried out the survey with primary or secondary school mathematics teachers or adult basic numer-acy tutors, all native English speakers. We found them through personal contacts and posts to Inter-net forums. The task of simplifying numerical ex-pressions is difficult, but it is a task that this group seemed well qualified to tackle since they are highly numerate and accustomed to talking to people who do not understand mathematical concepts very well. Our experimental evaluation involved 34 partici-pants who answered at least one question in our sur-vey (some participants did not complete it).
3.3 Survey Design and Implementation
The survey was divided into three parts as follows:
1. Simplification of numerical expressions for a person who can not understand percentages
3. Free simplification of numerical expressions for a person with poor numeracy
Each part of the survey is considered as a differ-ent kind of simplification: (1) simplification with no percentages, (2) simplification with no decimals and (3) free simplification.
For part (2), the set of sentences containing only decimal percentages was used. One of the two mixed sets of sentences with whole-number and decimal percentages was used for part (1) and the other for part (3). The experiment was presented on SurveyMonkey1, a commonly-used provider of web surveys. The survey was configured so that partic-ipants could leave the questionnaire and later con-tinue with it.
We asked participants to provide simplifications for numerical expressions that were marked by square brackets in each sentence. Below the sen-tence, each bracketed number was shown beside a text box in which the participant was asked to type the simplified version. Our instructions said that nu-merical expressions could be simplified using any format: number words, digits, fractions, ratios, etc. and that hedges such as ‘more than’, ‘almost’ and so on could be introduced if necessary. Participants were also told that the meaning of the simplified ex-pression should be as close to the original expres-sion as possible and that, if necessary, they could rewrite part of the original sentence. Figure 1 shows a screenshot of part of the questionnaire.
3.4 Underlying assumptions
A numerical expression (NE) is considered to be a phrase that represents a quantity, sometimes modi-fied by a numerical hedge as in “less than a quarter” or “about 20%”. We have restricted coverage to pro-portions -i.e., fractions, ratios and percentages. We had five hypotheses:
• H1: The use of hedges to accompany the sim-plified numerical expression is influenced by the simplification strategy selected. We con-sider the use of fractions, ratios and percent-ages like simplification strategies.
• H2: The use of hedges to simplify the numeri-cal expression is influenced by the value of the
1
www.surveymonkey.com
proportion, with values in the central range (say 0.2 to 0.8) and values at the extreme ranges (say 0.0-0.2 and 0.8-1.0) having a different use of hedges.
• H3: The loss of precision allowed for the sim-plified numerical expression is influenced by the simplification strategy selected.
• H4:There is some kind of correlation between the loss of precision and the use of hedges, in such a way that the increase or decrease in the former influences changes in the latter.
• H5: As an specific case of H4, when writers choose numerical expressions for readers with low numeracy, they do not tend to use hedges if they are not losing precision.
4 Results
The results of the survey were carefully analyzed as follows. First, within each block of questions, a set of simplification strategies was identified for each specific numerical expression. These strategies were then grouped together according to the mathematical forms and/or linguistic expressions employed (frac-tions, ratios, percentages).
With a view to using these data to design an au-tomated simplification system, these data have to be analyzed in terms of pairs of a given input numeri-cal expression and the simplified expression result-ing from applyresult-ing a specific simplification strategy. For such pairings, three important features must be considered as relevant to choosing a realization:
• Whether any numbers in the expression are re-alized as one of the different types of available expressions (fractions, ratios, percentages).
• The loss of precision involved in the simplifi-cation.
• The possible use of a hedge to cover this loss of precision explicitly in the simplified expres-sion.
To calculate the loss of precision, we defined Equation 1.
Figure 1: Screenshot of part of the questionnaire.
The set of pairings of input expression and ob-served simplification strategies, loss of precision and use of hedges as found in the results of the survey is given in Tables 1, 2 and 3. For each input numer-ical expression, the set of available simplification strategies is represented as three lines in the table. For each pairing, three columns are shown in the table. Empty cells represent that the strategy was not used. The first column presents the relative fre-quency of usage with respect to the total set of possi-ble simplification strategies used for that expression. The second column captures the loss of precision in-volved, represented in terms of the ratio between the value of the difference between the original numer-ical value in the input expression and the numernumer-ical value that is conveyed by the corresponding simpli-fied expression (using Equation 1). This ratio is also expressed as a percentage. The third column indi-cates the percentage of simplified numerical expres-sions that contained a hedge. All of them are mean values.
Each line represents one kind of simplification strategy used to simplify the original numerical ex-pression. Another point to explain is that frequen-cies that belong to the same expression do not al-ways add up to 100%. This is because a small num-ber of others kinds of simplification strategies, like deletions or rewriting of the whole sentence, are not shown in the table. Moreover, we must keep in mind that not all participants answered each question of the survey.
Table 1 presents the relationships identified be-tween the original numerical expressions and the simplification strategies (presented as lines) for the
results of the first part of the survey (simplification of numerical expressions for a person who can not understand percentages). All the values are repre-sented in percentages. Table 2 represents the same data for the second part of the survey (simplification of numerical expressions for a person who can not understand decimals) and Table 3 for the third part (free simplification of numerical expressions for a person with poor numeracy).
In the three parts of the survey, the percentage of simplifications that use hedges is slightly higher than that of those not using hedges especially in the sec-ond and third part of the survey. Adapting original numerical expressions by inserting hedges accounts for more than the 50% of cases. This reinforces our assumption that simplifications involving loss of precision may be better understood if an appropriate hedge is used.
4.1 Analysis of the Use of Hedges in the Simplified Numerical Expressions
Num. Exp. Frequency (%) Error (%) Hedge (%)
Fractions 18 0 67
more than 1% Ratios 6 0 100
Percentages 18 17 50
Fractions 6 0 50
2% Ratios 18 -1 17
Percentages 12 0 0
Fractions 26 1 67
16.8% Ratios 65 5 45
Percentages 9 -3 0
Fractions 82 -4 86
27% Ratios 12 8 75
Percentages 6 6 50
Fractions 41 0 93
at least 30% Ratios 35 13 67
Percentages 3 0 100
Fractions 53 12 50
40% Ratios 29 0 10
Percentages 6 0 0
Fractions 82 -13 82
56% Ratios
Percentages 6 -5 50
Fractions 74 -3 84
63% Ratios 24 0 75
Percentages 3 0 0
Fractions 32 0 0
75% Ratios 29 0 0
Percentages
Fractions 3 0 0
97.2% Ratios 38 -8 23
Percentages 18 1 50
Fractions 6 0 0
98% Ratios 12 0 0
Percentages 3 0 0
Fractions 39 -1 53
Average Ratios 24 2 41
[image:5.612.82.291.69.336.2]Percentages 7 1 30
Table 1: Analysis of the data for 34 participants from the first part of the survey (simplifications intended for peo-ple who do not understand percentages). All values are percentages. The first column represents the frequencies of use for each simplification strategy. The second col-umn shows the error as the loss of precision involved in the simplification. And the last column displays the use of hedges in the simplifications.
the survey, but in the first part (no percentages) we find significant difference between fractions and ra-tios (p<0.0006). These results do not support the hypothesis, as there is not a direct relation between the use of hedges and the selected strategy.
We performed anothert-testadjusted by using the
Bonferroni correction on the simplification strate-gies and central and peripheral values to test hypoth-esis H2 (the use of hedges to simplify the numerical expression is influenced by the value of the propor-tion, with values in the central range (say 0.2 to 0.8) and values at the extreme ranges (say 0.0-0.2 and 0.8-1.0) having a different use of hedges). In this case there is also no significant difference. The re-sults show that the use of hedges is not influenced by central and peripheral values, rejecting our hypoth-esis H2 with a p-value p=0.77 in the worst case for the percentages strategy.
A newt-testadjusted by using theBonferroni
cor-Num. Exp. Frequency (%) Error (%) Hedge (%)
Fractions 6 25 50
0.6% Ratios 9 22 33
Percentages 47 21 100
Fractions 3 -29 0
2.8% Ratios 24 6 63
Percentages 47 7 63
Fractions
6.1% Ratios 18 -4 50
Percentages 50 -3 82
Fractions 12 9 75
7.5% Ratios 12 -10 0
Percentages 50 7 41
Fractions 15 -1 80
15.5% Ratios 12 6 50
Percentages 44 2 33
Fractions 15 -3 100
25.9% Ratios 12 -3 75
Percentages 38 5 62
Fractions 3 0 0
29.1% Ratios 15 3 60
Percentages 50 2 71
Fractions 12 -5 100
35.4% Ratios 15 -4 60
Percentages 41 -1 71
Fractions 44 -2 93
50.8% Ratios 3 0 0
Percentages 21 0 43
Fractions 44 1 93
73.9% Ratios 6 1 50
Percentages 18 0 50
Fractions 3 0 0
87.8% Ratios 15 -1 60
Percentages 47 1 88
Fractions 3 0 0
96.9% Ratios 12 -2 75
Percentages 29 0 80
Fractions 6 0 50
96.9% Ratios 18 -1 67
Percentages 21 0 86
Fractions 3 0 0
97.2% Ratios 18 -1 67
Percentages 41 0 93
Fractions 3 0 0
97.2% Ratios 18 -1 83
Percentages 32 0 91
Fractions 3 0 0
98.2% Ratios 15 -2 40
Percentages 44 0 67
Fractions 11 0 43
Average Ratios 14 1 52
[image:5.612.324.527.69.444.2]Percentages 39 2 70
Table 2: Analysis of the data for 34 participants from the second part of the survey (simplifications intended for people who do not understand decimals). All values are percentages. The first column represents the frequencies of use for each simplification strategy. The second col-umn shows the error as the loss of precision involved in the simplification. And the last column displays the use of hedges in the simplifications.
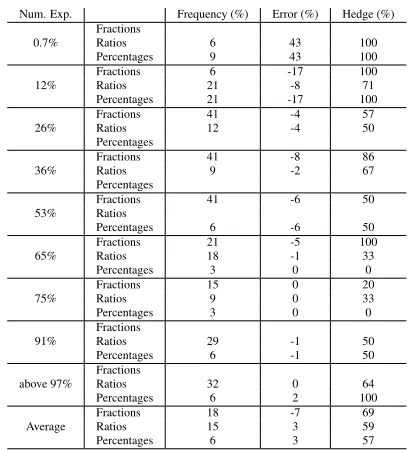
Num. Exp. Frequency (%) Error (%) Hedge (%) Fractions
0.7% Ratios 6 43 100
Percentages 9 43 100
Fractions 6 -17 100
12% Ratios 21 -8 71
Percentages 21 -17 100
Fractions 41 -4 57
26% Ratios 12 -4 50
Percentages
Fractions 41 -8 86
36% Ratios 9 -2 67
Percentages
Fractions 41 -6 50
53% Ratios
Percentages 6 -6 50
Fractions 21 -5 100
65% Ratios 18 -1 33
Percentages 3 0 0
Fractions 15 0 20
75% Ratios 9 0 33
Percentages 3 0 0
Fractions
91% Ratios 29 -1 50
Percentages 6 -1 50
Fractions
above 97% Ratios 32 0 64
Percentages 6 2 100
Fractions 18 -7 69
Average Ratios 15 3 59
[image:6.612.82.288.68.293.2]Percentages 6 3 57
Table 3: Analysis of the data for 34 participants from the third part of the survey (free simplification intended for people with poor literacy). All values are percentages. The first column represents the frequencies of use for each simplification strategy. The second column shows the error as the loss of precision involved in the simplifi-cation. And the last column displays the use of hedges in the simplifications.
no significant difference between any strategy. And in the last part (free simplification) there is only a significant difference between fractions and ratios. These results seem not to support the hypothesis, as there is not a direct relation between the use of hedges and the loss of precision in the simplified nu-merical expression.
For hypothesis H4 (there is some kind of corre-lation between the loss of precision and the use of hedges), we looked for correlations between each part of the survey and each kind of simplification strategy. We carried out a non-parametric measure of statistical dependence between the two variables (loss of precision and use of hedges) calculated by theSpearman’s rank correlation coefficient.
In general, the results show no correlation, so there is no linear dependence between the loss of precision in the strategy and use of hedges, rejecting our hypothesis. For example, there are cases with a weak correlation (e.g. in the second part of the survey for fractions with r=0.49, N=17 and p=0.03), and cases where there is a strong correlation (e.g.
in the third part of the survey, with r=1, N=18 and p<.0001).
Finally, when we analyzed hypothesis H5 (when writers choose numerical expressions for readers with low numeracy, they do not tend to use hedges if they are not losing precision), we worked with each part of the survey to study the cases where the loss of precision is zero and what is the tendency of use of hedges.
• In the first part of the survey (simplification of numerical expressions for a person who can not understand percentages), considering our 34 participants, in a 46% of responses the loss of precision is zero, and for these cases only 11% used hedges.
• For the second part (simplification of numeri-cal expressions for a person who can not un-derstand decimals), considering our 34 partici-pants, in a 16% of responses the loss of preci-sion is zero and for these cases only 7% used hedges.
• And finally, in the last part (simplification of numerical expressions for a person with poor numeracy), considering the same participants, in a 23% of cases the loss of precision is zero in the simplification and for these cases only 6% used hedges.
With this data, it seems that we can accept hypoth-esis H5, that is, we found evidence for our assump-tion that when writers choose numerical expressions for readers with poor numeracy, they tend to use hedges when they round the original numerical ex-pression, i.e when the loss of precision is not zero.
4.2 Original Numerical Expressions with Hedges
Strategy No Pct. No Dec. Free Simp. Whole
Fractions A A A A
Percentages A B A A A
[image:7.612.167.446.72.128.2]Ratios B A A B
Table 4: Results of t-test adjusted by Bonferroni correction for H1 (the use of hedges in simplified numerical ex-pressions is influenced by the simplification strategy selected). Strategies which do not share a letter are significantly different.
Strategy No Pct. No Dec. Free Simp. Whole
Fractions A A A A
Percentages A A A B B
[image:7.612.168.447.180.239.2]Ratios B A B B
Table 5: Results of t-test adjusted by Bonferroni correction for H3 (the loss of precision allowed for the simplified numerical expression is influenced by the simplification strategy selected). Strategies which do not share a letter are significantly different.
In the remaining cases, the same hedge is nearly al-way chosen to simplify the numerical expression.
4.3 Kinds of Hedges
With respect to the actual hedges used, we have identified two different possible roles of hedge in-gredients in a numerical expression. In some cases, hedges are used to indicate that the actual numeri-cal value given is an approximation to the intended value. Uses ofaboutoraroundare instances of this. This kind of hedge is employed to indicate explic-itly that some loss of precision has taken place dur-ing simplification. In other cases, hedges are used to indicate the direction in which the simplified value diverges from the original value. Uses of under or
overare instances of this. In some cases more than one hedge may be added to an expression to indi-cate both approximation and direction, or to some-how specify the precision involved in the simplifica-tion, as injust underora little less than.
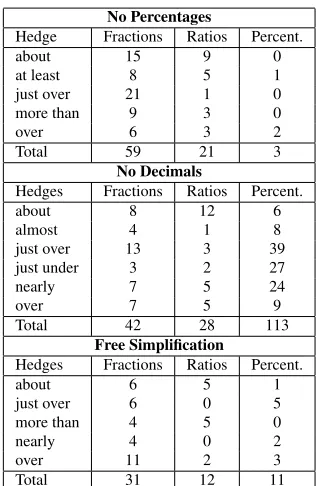
In our analysis we studied which hedges were the most frequent in each part of the survey. Only hedges with more than ten appearances in total (in-cluding simplification strategies not present in the table) have been considered in Table 6. We observed that the three parts of the survey have three hedges in common: about, just over and over. They are used in different strategies for each kind of simpli-fication. In the second part of the survey, where simplifications of numerical expressions for a per-son who can not understand decimals are done, is
where more hedges are used, in special for percent-ages strategy. In the last part of the survey, where there is more freedom to decide how simplify the original numerical expression, participants used less hedges compare to the others parts.
No Percentages
Hedge Fractions Ratios Percent. about 15 9 0 at least 8 5 1 just over 21 1 0 more than 9 3 0
over 6 3 2
Total 59 21 3 No Decimals
Hedges Fractions Ratios Percent. about 8 12 6 almost 4 1 8 just over 13 3 39 just under 3 2 27 nearly 7 5 24
over 7 5 9
Total 42 28 113 Free Simplification
Hedges Fractions Ratios Percent.
about 6 5 1
just over 6 0 5 more than 4 5 0 nearly 4 0 2
over 11 2 3
Total 31 12 11
[image:7.612.347.505.409.652.2]5 Discussion
As can be seen in the results, the use of hedges to simplify numerical expressions can be influenced by three parameters. The first is thekind of simplifica-tion. Our survey was divided in three parts depend-ing on the mathematical knowledge of the final user. The second is thesimplification strategyfor choos-ing mathematical form (fractions, ratios, or percent-ages). In our data we observed some differences in the usage of hedges with ratios and their usage with fractions and percentages (see Table 4). The last pa-rameter is theloss of precision that occurs when the numerical expression is rounded. We investigated the use of hedges vs. loss of precision with different tests hoping to define some dependencies, but there was no clear correlation between them, and it was only when we tried a deeper analysis of strategies and kind of simplifications that we found some cor-relations such as those we presented in Section 4.1.
When asked to simplify for people who do not understand percentages, or for people with poor nu-meracy, the participants use different simplification strategies and sometimes they use hedges to simplify the original numerical expression. As some partic-ipants commented, not only are percentages mathe-matically sophisticated forms, but they may be used in sophisticated ways in the text, often for example describing rising and falling values, for which in-creases or dein-creases can themselves be described in percentages terms. Such complex relationships are likely to pose problems for people with poor numer-acy even if a suitable strategy can be found for sim-plifying the individual percentages. In some of the examples with more than one numerical expression being compared, some of the evaluators reported a tendency to phrase them both according to a com-parable base. Thus we should consider the role of context (the set of numerical expressions in a given sentence as a whole, and the meaning of the text) in establishing what simplifications must be used.
6 Conclusions and Future Work
Through a survey administered to experts on nu-meracy, we have collected a wide range of exam-ples of appropriate simplifications of percentage ex-pressions. These examples of simplified expressions give us information about the use of hedges that our
participants carry out to adapt the original numer-ical expression to be understood by the final user. We investigated the loss of precision that occurs with each hedge and the relation between the simplifica-tion strategy and the use of hedges.
Our aim is to use this data to guide the develop-ment of a system for automatically simplifying per-centages in texts. With the knowledge acquired from our study we will improve our algorithm to simplify numerical expressions. We could determinate from the simplification strategy, kind of simplification and the loss of precision allowed, which will be the best option to adapt the original numerical expression to the final user and if that option uses hedges to under-stand better the original numerical expression. As a part of our algorithm, we will have to look at inter-rater agreements for identifying appropriate hedges.
As future work, we plan to carry out another study to determine a ranking of simplification strategies from collecting a repertoire of rewriting strategies used to simplify. This data should allow us to deter-mine whether common values are considered sim-pler and whether the value of the original expression influences the chosen simplification strategy. So, given a numerical expression, we could choose what simplification strategy to apply and whether to insert a hedge. We could investigate whether the value of the original proportion also influences choices, de-pending on its correspondence with central or pe-ripheral values.
We have also collected a parallel corpus of numer-ical expressions (original vs. simplified version). This corpus will be shared with other researches so it can be used in different applications to improve the readability of text. This could be a very use-ful resource because simplification of percentages remains an interesting and non-trivial problem.
Acknowledgments
References
Stephanie Schinzing Marsiglio Ann M. Bisantz and Jes-sica Munch. 2005. Displaying uncertainty: Inves-tigating the effects of display format and specificity. Human Factors: The Journal of the Human Factors and Ergonomics Society, 47(4):777.
J. Carroll, G. Minnen, Y. Canning, S. Devlin, and J. Tait. 1998. Practical simplification of English newspaper text to assist aphasic readers. InAAAI-98 Workshop on Integrating Artificial Intelligence and Assistive Tech-nology, Madison, Wisconsin.
Raman Chandrasekar, Christine Doran, and Bangalore Srinivas. 1996. Motivations and Methods for Text Simplification. InCOLING, pages 1041–1044. Paul Slovic Ellen Peters, Judith Hibbard and Nathan
Dieckmann. 2007. Numeracy skill and the commu-nication, comprehension, and use of risk-benefit infor-mation. Health Affairs, 26(3):741–748.
Shiv B. Mishra H, Mishra A. 2011. In praise of vague-ness: malleability of vague information as a perfor-mance booster. Psychological Science, 22(6):733–8, April.
Paul Slovic Nathan F. Dieckmann and Ellen M. Peters. 2009. The use of narrative evidence and explicit like-lihood by decisionmakers varying in numeracy. Risk Analysis, 29(10).
The United Nations. 1994. Normas uniformes sobre la igualdad de oportunidades para las personas con dis-capacidad. Technical report.
Sarah E. Petersen and Mari Ostendorf. 2007. Text Sim-plification for Language Learners: A Corpus Analy-sis. Speech and Language Technology for Education (SLaTE).
Qualification and Curriculum Authority. 1999. Mathe-matics: the national curriculum for england. Depart-ment for Education and EmployDepart-ment, London. Advaith Siddharthan. 2002. Resolving Attachment and
Clause Boundary Amgiguities for Simplifying Rela-tive Clause Constructs. InProceedings of the Student Research Workshop, 40th Meeting of the Association for Computacional Linguistics.
Sandra Williams and Richard Power. 2009. Precision and mathematical form in first and subsequent men-tions of numerical facts and their relation to document structure. InProceedings of the 12th European Work-shop on Natural Language Generation, Athens. Sandra Williams and Ehud Reiter. 2005. Generating
readable texts for readers with low basic skills. In Proceeding of the 10th European Workshop on Natu-ral Language Generation, pages 140–147, Aberdeen, Scotland.
Joel Williams, Sam Clemens, Karin Oleinikova, and Karen Tarvin. 2003. The Skills for Life survey: A