The First Surface Realisation Shared Task:
Overview and Evaluation Results
Anja Belz1 Michael White21Computing, Engineering and Maths
University of Brighton Brighton BN1 4GJ, UK
{asb,eykk10}@brighton.ac.uk
Dominic Espinosa2 Eric Kow1 2Department of Linguistics
Ohio State University Columbus, OH, 43210, US
{espinosa,mwhite}@ling.osu.edu
Deirdre Hogan School of Computing
Dublin City University, Dublin 9, Ireland [email protected]
Amanda Stent AT&T Labs Research Florham Park, NJ 07932, US [email protected]
Abstract
The Surface Realisation (SR) Task was a new task at Generation Challenges 2011, and had two tracks: (1) Shallow: mapping from shal-low input representations to realisations; and (2) Deep: mapping from deep input represen-tations to realisations. Five teams submitted six systems in total, and we additionally evalu-ated human toplines. Systems were evaluevalu-ated automatically using a range of intrinsic met-rics. In addition, systems were assessed by human judges in terms of Clarity, Readability and Meaning Similarity. This report presents the evaluation results, along with descriptions of the SR Task Tracks and evaluation methods. For descriptions of the participating systems, see the separate system reports in this volume, immediately following this results report.
1 Introduction and Overview
Many different surface realisers have been devel-oped over the past three decades or so. While symbolic realisers dominated for much of this pe-riod, the past decade has seen the development of many different types of statistical surface realisers. A significant subset of statistical realisation work (Langkilde, 2002; Callaway, 2003; Nakanishi et al., 2005; Zhong and Stent, 2005; Cahill and van Gen-abith, 2006; White and Rajkumar, 2009) has pro-duced results for regenerating the Penn Treebank (PTB) (Marcus et al., 1995). The basic approach in
all this work was to remove information from the Penn Treebank parses (the word strings themselves as well as some of the parse information), and then
convert and use these underspecified representations as inputs to the surface realiser whose task it is to reproduce the original treebank sentence.
While publications reporting this type of work referred to each other and (tentatively) compared
BLEU scores, the results were not in fact directly
comparable, because of the differences in the in-put representations automatically derived from Penn Treebank annotations. In particular, the extent to which they were underspecified varied from one sys-tem to the next. Our aim in developing the Surface Realisation (SR) Task was to make it possible, for the first time, to directly compare different, inde-pendently developed surface realisers by developing a ‘common-ground’ input representation that could be used by all participating systems to generate real-isations from. In fact, we created two different input representations, one shallow, one deep, in order to enable more teams to participate.
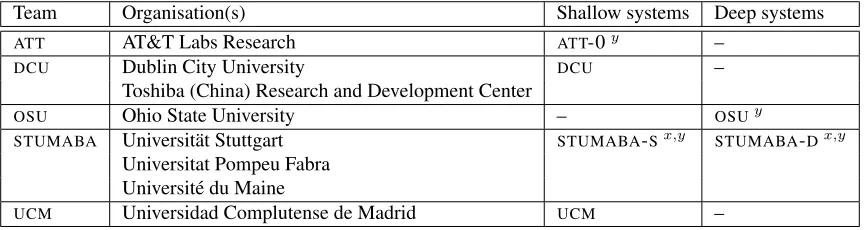
Five teams submitted systems to the SR Task (see Table 1), submitting six systems in total. We also used the corpus texts themselves as ‘system’ out-puts, to provide a human topline. We evaluated par-ticipating systems using a range of intrinsic eval-uation methods, both automatically computed and human-assessed (for an overview, see Table 2).
This report describes the data (Section 2), task definition, evaluation methods and results (Sec-tions 3 and 4) for the SR Task, and then presents a discussion of some problematic issues in develop-ing a shared surface realisation task for the first time (Section 5). The participating systems are described in the particpants’ reports in this volume, immedi-ately following this report.
Team Organisation(s) Shallow systems Deep systems
ATT AT&T Labs Research ATT-0y –
DCU Dublin City University DCU –
Toshiba (China) Research and Development Center
OSU Ohio State University – OSUy
STUMABA Universit¨at Stuttgart STUMABA-Sx,y STUMABA-Dx,y
Universitat Pompeu Fabra Universit´e du Maine
UCM Universidad Complutense de Madrid UCM –
Table 1: SR-Task teams and systems. TheSTUMABAsystems are the version called ‘System 2’ in the team’s report. x=resubmitted after fixing software bugs;y= late submission.
Quality criterion: Type of evaluation: Evaluation Method(s):
Humanlikeness Intrinsic/automaticIntrinsic/human Human assessment of Meaning SimilarityBLEU,NIST,TER,METEOR Readability Intrinsic/human Human Readability judgements
[image:2.612.91.523.60.175.2]Clarity Intrinsic/human Human Clarity judgements
Table 2: Overview of evaluation procedures used in the SR Shared Task.
2 Data
The SR Task data has two input representations— one for each track, shallow and deep. In both, sen-tences are represented as sets of unordered labeled dependencies (with the exception of named entities, see Section 2.4 below, which are ordered). The shal-low input representation is intended to be a more ‘surfacey’, syntactic represention of the sentence. The deep(er) input type is intended to be closer to a semantic, more abstract, representation of the mean-ing of the sentence.
The input representations were created by post-processing the CoNLL 2008 Shared Task data (Sur-deanu et al., 2008). For the preparation of the CoNLL-08 Shared task data, selected sections of the Penn WSJ Treebank were converted to syntactic de-pendencies via the LTH Constituent-to-Dependency Conversion Tool for Penn-style Treebanks (Pen-nconverter) (Johansson and Nugues, 2007). The resulting dependency bank was then merged with the Nombank (Meyers et al., 2004) and Propbank (Palmer et al., 2005) corpora. Named entity infor-mation from the BBN Entity Type corpus was also integrated into the CoNLL-08 data. Our shallow representation is based on the Pennconverter depen-dencies. The deep representation is derived from the merged Nombank, Propbank and syntactic depen-dencies in a process similar to the graph completion
algorithm outlined in (Bohnet et al., 2010) (see Sec-tion 2.2 for differences).
2.1 Shallow representation
The shallow data consists of unordered syntactic de-pendency trees. Each word and punctuation marker from the original sentence is represented as a node in a syntactic dependency tree.
Nodes: The node information consists of a word’s lemma, a coarse-grained POS-tag, and, where ap-propriate, number, tense and participle features and a sense tag id (as a suffix to the lemma). In addition, two punctuation features encode the quotation and bracketing information for the sentence.
The POS-tag set is slightly less fine-grained than the Penn POS-tag set. We removed the distinction between VBP and VBZ for example, so that deter-mining agreement is a task left to the realiser.
Edges: Edges between nodes are labeled with the syntactic labels produced by the Penncoverter. See the SR Task Documentation1for a summary
descrip-tion of the label set. In addidescrip-tion to theseatomic la-bels, edges can be labeled withnon-atomic labels, which consist of multiple atomic labels (see Sur-deanu et al. (2008) for details). See the SR Task
1Available here: http://www.itri.brighton.ac.uk/
Documentation for our current handling of long-distance dependencies and future plans for improve-ments.
2.2 Deep
The deep representation is in the form of depen-dency graphs and is not restricted to tree structures. Nodes: Information at each node consists of a word’s lemma, and where appropriate, number, tense and participle features and a sense tag id (as a suffix to the lemma). Two punctuation features encode the quotation and bracketing information for the sentence. Unlike in the shallow representation, there is no POS-tag information.
In a step towards removing punctuation, we re-moved commas from the deep representation.2 In
addition, some function words (specifically, that-complementizers and TO infinitives) were removed. For the future, we intend to remove further function words, such as relative pronouns and case-marking prepositions.
Edges: Semantic edges are labeled with semantic labels taken from the Propbank and Nombank se-mantic roles.
Where the PropBank/NomBank relations result in an unconnected structure, we connected the graph with edges from the corresponding syntactic tree, with the syntactic labels produced by the Pen-ncoverter.
Some of these Pennconverter labels have been modified slightly in order to make them more gen-eral. See Table 3 for details. In the case of NMOD and AMOD, the syntactic head is typically a seman-tic argument of its modifier; accordingly, these syn-tactic relations were replaced with an AINV (Argu-ment INVerse) semantic relation. The direction of Pennconverter edges remains unchanged.
2.3 Tokenisation
Tokenisation follows that of the CoNLL data, which differs from that of the Penn Treebank. Hyphen-ated words are split and dependencies between the split tokens are given. For example, prime-timeis represented as three tokens with the dependencies:
[time]HM OD →[prime]HY P H →[−].
2There remain 55 occurrences where the comma had
depen-dent nodes which we intend to remove in the future.
2.4 Named Entities
Named entity annotations from the BBN Entity Type corpus were used to derive NAME dependencies in the CoNLL corpus. For the SR Task data we have numbered all NAME dependencies with the order they appear in the original sentence because, ar-guably, the ordering of words in named entities is not a task that should be left to a surface realizer.
2.5 Coordination
Following the CoNLL format, the first conjunct is the head of coordinate structures in both shallow and deep representations. All other conjuncts, and the coordinating conjunction, are descendants of the leftmost conjunct. The order of the conjuncts is en-coded in the dependency structure. The treatment of coordination will be revisited in future years.
2.6 Data Format
The data format for the shallow and deep tracks has the following components:
1. A line with the graph number (e.g. sentId=11055). 2. The graph represented as lines where each line
rep-resents a single node and consists of at least 4 and a maximum of 10 fields:
RELATION ID PARENT ID LEMMA[.sensetagID] [CPOS=POStag] [num=sg|pl] [tense=past|pres] [partic=past|pres] [quoted=d*s*] [bracket=r*c*]
Each line contains at least the first 4 fields, except for nodes with multiple heads. In such cases, there is one line for eachhead→noderelation. The first
time this occurs the full information for the node is given. For subsequent occurrences only the rela-tion label, the node ID, and the parent node ID are given. Note that, as the syntactic representations are strictly trees, multiple heads will only occur in the deep representation.
The dependency structure of the graphs is reflected both through tabular indentation and the ID and PARENT ID fields.
3. A line containing the original sentence, followed by a blank line (the test set data did not include the sentence).
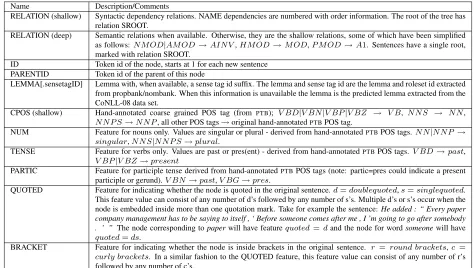
Name Description/Comments
RELATION (shallow) Syntactic dependency relations. NAME dependencies are numbered with order information. The root of the tree has relation SROOT.
RELATION (deep) Semantic relations when available. Otherwise, they are the shallow relations, some of which have been simplified as follows:N M OD|AM OD→AIN V,HM OD→M OD,P M OD→A1. Sentences have a single root,
marked with relation SROOT.
ID Token id of the node, starts at 1 for each new sentence PARENTID Token id of the parent of this node
LEMMA[.sensetagID] Lemma with, when available, a sense tag id suffix. The lemma and sense tag id are the lemma and roleset id extracted from propbank/nombank. When this information is unavailable the lemma is the predicted lemma extracted from the CoNLL-08 data set.
CPOS (shallow) Hand-annotated coarse grained POS tag (from PTB); V BD|V BN|V BP|V BZ → V B, N N S → N N,
N N P S→N N P, all other POS tags→original hand-annotatedPTBPOS tag.
NUM Feature for nouns only. Values are singular or plural - derived from hand-annotatedPTBPOS tags.N N|N N P → singular,N N S|N N P S→plural.
TENSE Feature for verbs only. Values are past or pres(ent) - derived from hand-annotatedPTBPOS tags.V BD→past,
V BP|V BZ→present
PARTIC Feature for participle tense derived from hand-annotatedPTBPOS tags (note: partic=pres could indicate a present participle or gerund).V BN→past,V BG→pres.
QUOTED Feature for indicating whether the node is quoted in the original sentence.d=doublequoted,s=singlequoted. This feature value can consist of any number of d’s followed by any number of s’s. Multiple d’s or s’s occur when the node is embedded inside more than one quotation mark. Take for example the sentence:He added : “ Every paper company management has to be saying to itself , ‘ Before someone comes after me , I ’m going to go after somebody . ’ ” The node corresponding topaperwill have featurequoted=dand the node for wordsomeonewill have
quoted=ds.
[image:4.612.68.542.59.327.2]BRACKET Feature for indicating whether the node is inside brackets in the original sentence. r =round brackets,c = curly brackets. In a similar fashion to the QUOTED feature, this feature value can consist of any number of r’s followed by any number of c’s.
Table 3: Field descriptions for Shallow and Deep Representations.
we used 100 as the test set for human evaluation this year and will use the remainder in future editions of the SR Shared Task.
1. Training set:PTBSections 02–21.
2. Development set: 1,034 sentences from PTB
Sec-tion 24 (less 300 sentences for use in human evalu-ations).
3. Test set for automatic evaluations:PTBSec. 23.
4. Test set for human evaluations: 100 sentences in chunks of 5 consecutive sentences, randomly se-lected (and removed) fromPTBSection 24.
Note that a small number of sentences from the selected WSJ sections were not included in the CoNLL-08 data (and are thus not included in the SR Task data) due to difficulties in merging the various data sets (e.g. Section 23 has 17 fewer sentences).
3 Automatic Evaluations
We computed scores using the following well-known automatic evaluation metrics:
1. BLEU (Papineni et al., 2002):3 geometric mean of
1- to 4-gram precision with a brevity penalty; recent
3http://www.itl.nist.gov/iad/mig/tests/mt/2009/
implementations use smoothing to allow sentence-level scores to be computed.
2. NIST:4,5 n-gram similarity weighted in favour of
less frequent n-grams which are taken to be more informative.
3. METEOR (Banerjee and Lavie, 2005; Denkowski and Lavie, 2011):6lexical similarity based on exact,
stem, synonym, and paraphrase matches between words and phrases.
4. TER(Snover et al., 2006):7a length-normalized edit
distance metric where phrasal shifts are counted as one edit.
For each metric, we calculated system-level scores, the mean of the sentence-level scores and weighted n-best scores (described below).
Text normalisation: Output texts were nor-malised by lower-casing all tokens, removing any extraneous white space characters and ensuring con-sistent treatment of ampersands.
4http://www.itl.nist.gov/iad/mig/tests/mt/doc
/ngram-study.pdf
5http://www.itl.nist.gov/iad/mig/tests/mt/2009/ 6http://www.cs.cmu.edu/ alavie/METEOR/
N-best, ranked system outputs: Ranked 5-best outputs were scored using a weighted average of the sentence-level scores for each metric, with these sentence-level weighted sums averaged across all outputs. The weight wi assigned to the ith sys-tem output was in inverse proportion to its rank ri (K = 5):wi = PKK−ri+1
j=1K−rj+1
Missing outputs: Missing outputs were scored as zero (one forTER); in the n-best evaluation, missing
or duplicate outputs were scored as 0 (1 for TER).
Since coverage was high for all systems (97% for
OSU; 100% for all others), we only report results
for all sentences (with the missing output penalty), rather than separately reporting scores for just the covered items.
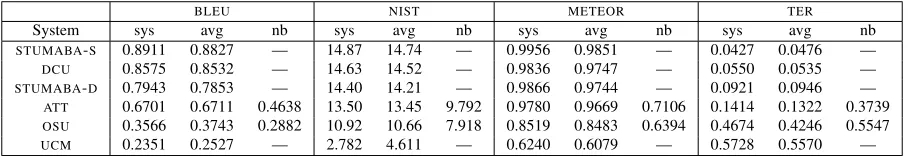
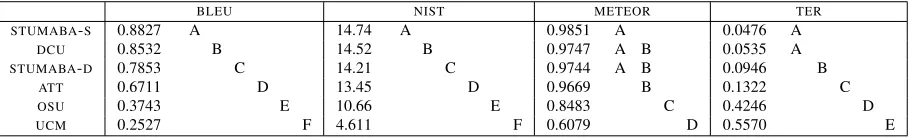
3.1 Metric Scores
The automatic metric scores for all systems appear in Tables 4 and 5 for the Automatic Test Set and Human Test Set, respectively. Tables 6 and 7 give the means of sentence-level scores; the columns containing single capital letters show the homoge-neous subsets of systems as determined by a post-hoc Tukey HSDanalysis; systems whose scores are
not significantly different (at the 0.05 level overall) share a letter.
In the tables, system scores are shown for all sys-tems, both in the shallow and deep track; thus, it should be noted that the scores forSTUMABA-Dand OSU, which are deep-task systems, are not directly
comparable to the scores for the remaining, shallow-task systems. Across the metrics and data sets,
STUMABA-Sis consistently the top-scoring system,
with DCU between STUMABA-S and STUMABA-D.
Since the automatic test set was much larger than the human test set, there were more significant dif-ferences between pairs of systems, as expected.TER
andMETEORwere less sensitive, withSTUMABA-S
andDCUfalling into a top group forTERon the test
section (i.e., there was no significant difference be-tweenSTUMABA-SandDCUon the meanTERscore
at the 0.05 level overall), andSTUMABA-S,DCUand STUMABA-Dforming a top group forMETEOR. On
the human test set, the pattern was similar but with larger homogeneous subsets.
With the n-best results, it is difficult to make any firm conclusions with only two systems supplying
n-best outputs. Nevertheless, it is evident that across the metrics, both theATTandOSUsystems have
con-sistently higher 1-best scores than weighted n-best scores, indicating that they are generally successful in choosing a single-best output that is more similar to the reference sentence than the others in the top 5. In the absence of multiple reference sentences or human evaluation results for the n-best list though, it is unclear to what extent the outputs in the n-best list might represent valid paraphrases versus clearly less acceptable outputs.
4 Human Evaluations 4.1 Experimental Set-up
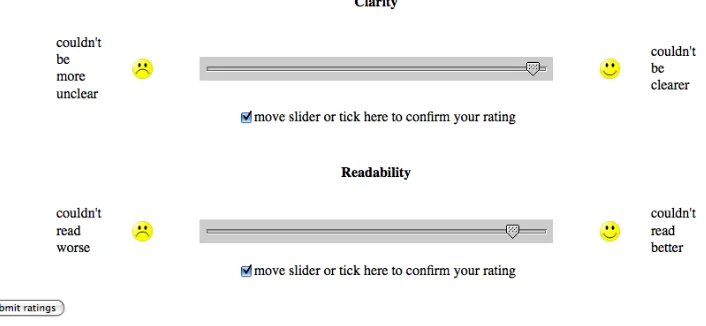
We assessed three criteria in the human evaluations: Clarity, Readability and Meaning Similarity. We used continuous sliders as rating tools (see Figures 1 and 2), because raters tend to prefer them (Belz and Kow, 2011). Slider positions were mapped to values from 0 to 100 (best).
The instructions relating to Clarity and Readabil-ity read as follows:8
The first criterion you need to assess isClarity. How clear (easy to understand) is the highlighted sentence within the context of the text extract? The second criterion to assess isReadability. This is sometimes called ’fluency’, and your task is to decide how well the highlighted sentence reads; is it good fluent English, or does it have grammatical errors, awkward constructions, etc.
Note that you should assess Clarity separately from Readability: it is possible for a text to be com-pletely clear, yet not read well; conversely, it is pos-sible for a text to read very well, and its meaning to be unclear.
Please rate the highlighted sentence by moving each slider to the position that corresponds to your rating.
The part of the instructions relating to Meaning Sim-ilarity was as follows:
This time you are being shown two extracts which are identical except for the highlighted sentences. You need to read both sentences within their con-text, and then decide how close in meaning the sec-ond sentence is to the first. [...] Once again use the slider to express your rating. The closer in meaning
8See http://www.nltg.brighton.ac.uk/research/
BLEU NIST METEOR TER
System sys avg nb sys avg nb sys avg nb sys avg nb
STUMABA-S 0.8911 0.8827 — 14.87 14.74 — 0.9956 0.9851 — 0.0427 0.0476 —
DCU 0.8575 0.8532 — 14.63 14.52 — 0.9836 0.9747 — 0.0550 0.0535 —
STUMABA-D 0.7943 0.7853 — 14.40 14.21 — 0.9866 0.9744 — 0.0921 0.0946 —
ATT 0.6701 0.6711 0.4638 13.50 13.45 9.792 0.9780 0.9669 0.7106 0.1414 0.1322 0.3739
OSU 0.3566 0.3743 0.2882 10.92 10.66 7.918 0.8519 0.8483 0.6394 0.4674 0.4246 0.5547
[image:6.612.80.535.60.138.2]UCM 0.2351 0.2527 — 2.782 4.611 — 0.6240 0.6079 — 0.5728 0.5570 —
Table 4: Automatic metric scores for automatic test data (PTBSection 23), including system-level scores (sys), mean
of sentence-level scores (avg) and mean of weighted n-best scores (nb).
BLEU NIST METEOR TER
System sys avg nb sys avg nb sys avg nb sys avg nb
STUMABA-S 0.8763 0.8621 — 10.81 10.70 — 0.9944 0.9842 — 0.0494 0.0537 —
DCU 0.8470 0.8319 — 10.73 10.65 — 0.9871 0.9791 — 0.0654 0.0650 —
STUMABA-D 0.7734 0.7510 — 10.59 10.43 — 0.9878 0.9754 — 0.1042 0.1096 —
ATT 0.6616 0.6262 0.4573 10.22 10.03 7.499 0.9788 0.9554 0.7135 0.1610 0.1664 0.3851
OSU 0.3975 0.4032 0.3164 9.056 8.850 6.736 0.8626 0.8546 0.6586 0.4226 0.3863 0.5189
UCM 0.2526 0.2652 — 2.466 3.620 — 0.6457 0.6268 — 0.5484 0.5416 —
Table 5: Automatic metric scores for human test data (PTBSection 24 100-sentence subset), including system-level
scores (sys), mean of sentence-level scores (avg) and mean of weighted n-best scores (nb).
the second sentence is to the first, the further to the right you need to place the slider.
For each test data item, raters were first shown the screen for the Readability and Clarity assess-ment (as shown in Figure 1), followed by the screen for Meaning Similarity assessment (see Figure 2). We displayed system outputs as they were. Raters were instructed to disregard spaces before punctu-ation and similar whitespace problems. Some sys-tems produced lower-cased outputs, others (like the
STUMABA-D one output of which is shown in
Fig-ures 1 and 2) produced outputs with capitalisations. All experiments use a Repeated Latin Squares de-sign which ensures that each subject sees the same number of outputs from each system and for each test set item. Following detailed instructions, raters first did three practice examples, followed by the texts to be rated, in an order randomised for each rater. Evaluations were carried out via a web inter-face. Raters were encouraged to take breaks, and in the case of the 2-hour long SR-Shallow evaluation they were required to take breaks.
In both experiments we used native-speaker raters from cohorts of 3rd-year undergraduate and post-graduate students (from Oxford, UCL, KCL and Sussex universities) currently doing, or having re-cently completed, a degree in linguistics. In the SR-Deep evaluation we used 6 raters evaluating half
the test set each (roughly 1 hour). In the SR-Shallow evaluation we used 5 raters each evaluat-ing the whole test set (2 hours). Their progress was logged at 10min intervals, and they received gift vouchers for their time.
In the following section, for each experiment we report the F-ratio as determined by a one-way
ANOVA with the evaluation criterion in question as
the dependent variable and System as the grouping factor. F is the ratio of between-groups variability over within-group (or residual) variability, i.e. the larger the value of F, the more of the variability ob-served in the data is accounted for by the grouping factor, here System, relative to what variability re-mains within the groups. We also report homoge-neous subsets (sets of systems among which there are no significant differences) of systems as deter-mined by a post-hoc Tukey’s HSD analysis (with a significance threshold of0.05).
4.2 Results
Table 8 shows three sets of means, for Clarity, Read-ability and Meaning Similarity,9 for the systems in
the Shallow Track. As mentioned above, we in-cluded the originalPTBsentences as a topline
(‘Cor-9Note that the Meaning Similarity results for the Corpus
BLEU NIST METEOR TER
STUMABA-S 0.8827 A 14.74 A 0.9851 A 0.0476 A
DCU 0.8532 B 14.52 B 0.9747 A B 0.0535 A
STUMABA-D 0.7853 C 14.21 C 0.9744 A B 0.0946 B
ATT 0.6711 D 13.45 D 0.9669 B 0.1322 C
OSU 0.3743 E 10.66 E 0.8483 C 0.4246 D
UCM 0.2527 F 4.611 F 0.6079 D 0.5570 E
Table 6: Tukey’sHSD(α=0.05) homogeneous subsets for mean of sentence-level scores on automatic test data.
BLEU NIST METEOR TER
STUMABA-S 0.8621 A 10.71 A 0.9842 A 0.0537 A
DCU 0.8319 A 10.65 A B 0.9791 A 0.0650 A
STUMABA-D 0.7510 B 10.43 A B 0.9754 A 0.1096 A
ATT 0.6262 C 10.03 B 0.9554 A 0.1664 B
OSU 0.4032 D 8.850 C 0.8546 B 0.3863 C
[image:7.612.80.536.60.129.2]UCM 0.2652 E 3.620 D 0.6268 C 0.5416 D
Table 7: Tukey’sHSD(α=0.05) homogeneous subsets for mean of sentence-level scores on human test data.
pus’ in the table). The results look similar across the three evaluation criteria: STUMABA-S has the
high-est mean, followed byDCU, but with no statistically
significant difference between them;ATTis third and UCMfourth for Readability and Meaning Similarity,
and the two systems are joint third for Clarity. Rank-ings are identical across the three criteria for the sys-tems in the Deep Track, withSTUMABA-Dfirst in all
three cases, andOSUsecond.
F-ratios were as follows. For the shallow systems and Clarity:F(4,495) = 49.402, p < .001; Readabil-ity:F(4,495)= 52.839, p < .001; and Meaning Sim-ilarity: F(4,495) = 82.565, p < .001. For the deep
systems and Clarity:F(2,294) = 120.020, p < .001;
Readability: F(2,294) = 162.22, p < .001; and Meaning Similarity:F(2,294)= 197.27, p < .001.
F-ratios are overall greater for the deep systems than for the shallow ones; and greater for Mean-ing Similarity than for Readability for which in turn is greater than for Clarity. The latter would indi-cate, perhaps surprisingly, that there was less vari-ation (more agreement) among the evaluators about Meaning Similarity than about the other two evalua-tion criteria.
5 Discussion
Input Conversion Issues: The principal goal of the surface realisation shared task challenge is to make it possible to directly compare different ap-proaches to surface realisation by encouraging the development of systems that start from a common ground input representation. In this year’s SR
shared task, the top-performing systems (StuMaBa-D, StuMaBa-S, DCU and ATT) were all statistical dependency realisers that do not make use of an ex-plicit, pre-existing grammar. By design, statistical dependency realisers are robust and relatively easy to adapt to new kinds of dependency inputs; as such, they are well suited to the SR task in its current form. In contrast, there were only two systems that em-ployed a traditional, hand-crafted generation mar (UCM) or a reversible, Treebank-derived gram-mar (OSU), neither of which produced competitive results. In each case, difficulties in converting the common ground inputs into the “native” or expected inputs were cited as an unexpectedly large obstacle. Indeed, the UCM system report concluded that
“[t]he reported results constitute a measure of the coverage achieved by the input conversion process more than a measure of the capabili-ties of the realizer employed.”
Mapping inputs to other intermediate representa-tions (such as logical forms or full LFG f-structures, for example) introduces additional complexity and noise into the pipeline, putting systems that require substantive input conversion at a disadvantage. Nev-ertheless, it could be that with more time, and greater use of machine learning in input conversion or gram-mars induced from the shared task data, it will be possible for participants to develop grammar-based systems that will produce more competitive realisers in future challenges.10
10Note that there are other conceivable shared tasks where the
Figure 1: Screen shot of evaluation of a realisation in context, using sliders, for the criteria ofClarityandReadability.
To encourage the development of a greater variety of shared task systems, for next year we are actively considering ways of making it easier to participate, and welcome discussion of this topic.
Resources for the Community: A byproduct of running this shared task has been the development or refinement of various tools and data sets which can serve as resources for the generation community. These include:
• The training and test data sets, available from the Linguistic Data Consortium by request.
• The automated testing script, available from: http://www.ling.ohio-state.edu/˜espinosa/genchal11/
• The test data from the six systems, with the human evaluation scores, available from: http://www.itri.brighton.ac.uk/research/sr-task/
As a result of the pilot SR Task, we have taken a first step forward in making results truly compara-ble in that researchers will be acompara-ble to compare
auto-to the kinds of internal representations systems employ. How-ever, in such text-to-text tasks, it would be difficult to isolate text generation issues from text interpretation ones.
matic results on this year’s common ground inputs to the numbers reported in the tables, when submit-ting papers to conferences on the value of a given technique for surface realization. Furthermore, the human evaluation data can be used for system de-velopment, and in meta-evaluation of metrics.
6 Conclusion
The first Surface Realisation Shared Task was the result of a prolonged period of discussion and devel-opment which originally started as a heated debate about the comparability of theBLEUscores of
differ-ent systems during the ACL-IJCNLP’09 reviewers’
discussion period. We subsequently got together a working group of researchers interested in develop-ing an SR input representation and presented an ini-tial proposal at INLG’10 (Belz et al., 2010). Over
Figure 2: Screen shot of evaluation of theMeaning Similarityof a realisation compared to the original corpus sentence.
Clarity Readability Meaning Similarity
System Mean Homogeneous System Mean Homogeneous System Mean Homogeneous
subsets subsets subsets
Corpus 88.55 A Corpus 88.97 A Corpus 96.68 A
STUMABA-S 74.80 B STUMABA-S 78.93 A B STUMABA-S 83.82 B
DCU 64.26 B DCU 77.32 B DCU 81.14 B
UCM 38.38 C ATT 50.72 C ATT 58.04 C
ATT 38.06 C UCM 38.43 D UCM 30.27 D
Table 8: SR-Task, Shallow Track: Results for Clarity, Readability and Meaning Similarity evaluations, in terms of means and homogeneous subsets determined by post-hoc Tukey’s HSD (sig.<0.05).
We hope that ultimately, this initiative will evolve some degree of standardisation of realiser inputs, at two, or possibly more, levels, facilitating the devel-opment and re-use of off-the-shelf realiser tools.
Acknowledgments
The work reported here was supported by the En-gineering and Physical Sciences Research Council (EPSRC), UK, under research grant EP/I032320/1. Work on the automatic evaluations and analysis was supported in part by NSF grant number IIS-0812297.
Many thanks to the other members of the work-ing group for their valuable contributions: Bernd Bohnet, Johan Bos, Aoife Cahill, Charles Callaway,
Josef van Genabith, Pablo Gervas, Stephan Oepen and Leo Wanner.
References
Satanjeev Banerjee and Alon Lavie. 2005. METEOR: An Automatic Metric for MT Evaluation with Im-proved Correlation with Human Judgments. InProc. of the ACL-05 Workshop on Intrinsic and Extrinsic Evaluation Measures for Machine Translation and/or Summarization.
Anja Belz and Eric Kow. 2011. Discrete vs. continuous rating scales for language evaluation in nlp. In Pro-ceedings of the 49th Annual Meeting of the Association for Computational Linguistics (ACL-HLT’11). A. Belz, M. White, J. van Genabith, D. Hogan, and
Clarity Readability Meaning Similarity
System Mean Homogeneous System Mean Homogeneous System Mean Homogeneous
subsets subsets subsets
Corpus 83.28 A Corpus 88.06 A Corpus 99.86 A
STUMABA-D 60.30 B STUMABA-D 64.91 B STUMABA-D 72.54 B
[image:10.612.89.526.59.121.2]OSU 22.71 C OSU 22.83 C OSU 32.44 C
Table 9: SR-Task, Deep Track: Results for Clarity, Readability and Meaning Similarity evaluations, in terms of means and homogeneous subsets determined by post-hoc Tukey’s HSD (sig.<0.05).
Surface Realisation shared task. InProc. of INLG’10, pages 267–271.
Bernd Bohnet, Leo Wanner, Simon Mille, and Alicia Burga. 2010. Broad coverage multilingual deep sen-tence generation with a stochastic multi-level realizer. In Proceedings of the 23rd International Conference on Computational Linguistics, Beijing, China. A. Cahill and J. van Genabith. 2006. Robust
PCFG-based generation using automatically acquired LFG approximations. InProc. ACL’06, pages 1033–44. Charles Callaway. 2003. Evaluating coverage for large
symbolic NLG grammars. InProceedings of the 18th International Joint Conference on Artificial Intelli-gence (IJCAI 2003), pages 811–817.
Michael Denkowski and Alon Lavie. 2011. Meteor 1.3: Automatic Metric for Reliable Optimization and Eval-uation of Machine Translation Systems. In Proceed-ings of the EMNLP 2011 Workshop on Statistical Ma-chine Translation.
Richard Johansson and Pierre Nugues. 2007. Extended constituent-to-dependency conversion for english. In Joakim Nivre, Heiki-Jaan Kaalep, Kadri Muischnek, and Mare Koit, editors, Proceedings of NODALIDA 2007, pages 105–112, Tartu, Estonia.
I. Langkilde. 2002. An empirical verification of cov-erage and correctness for a general-purpose sentence generator. In Proc. 2nd International Natural Lan-guage Generation Conference (INLG ’02).
Mitchell Marcus, Grace Kim, Mary Ann Marcinkiewicz, Robert MacIntyre, Ann Bies, Mark Ferguson, Karen Katz, and Britta Schasberger. 1995. The PENN tree-bank: Annotating predicate argument structure. Dis-tributed on the PENN Treebank Release 2 CD-ROM, Linguistic Data Consortium.
Adam Meyers, Ruth Reeves, Catherine Macleod, Rachel Szekely, Veronika Zielinska, Brian Young, and Ralph Grishman. 2004. The nombank project: An interim report. InNAACL/HLT Workshop Frontiers in Corpus Annotation.
Hiroko Nakanishi, Yusuke Miyao, and Jun’ichi Tsujii. 2005. Probabilistic models for disambiguation of an hpsg-based chart generator. InProceedings of the 9th International Workshop on Parsing Technology (Pars-ing’05), pages 93–102. Association for Computational Linguistics.
Martha Palmer, Daniel Gildea, and Paul Kingsbury. 2005. The proposition bank: A corpus annotated with semantic roles. InComputational Linguistics Journal, pages 71–105.
Kishore Papineni, Salim Roukos, Todd Ward, and Wei-Jing Zhu. 2002. Bleu: a method for automatic eval-uation of machine translation. InProceedings of 40th Annual Meeting of the Association for Computational Linguistics, pages 311–318, Philadelphia, Pennsylva-nia, USA, July. Association for Computational Lin-guistics.
Matthew Snover, Bonnie Dorr, Richard Schwartz, Lin-nea Micciulla, and John Makhoul. 2006. A study of translation edit rate with targeted human annotation. InProc. of the Association for Machine Translation in the Americas (AMTA-06).
Mihai Surdeanu, Richard Johansson, Adam Meyers, Llu´ıs M`arquez, and Joakim Nivre. 2008. The conll-2008 shared task on joint parsing of syntactic and semantic dependencies. In Proceedings of the Twelfth Conference on Computational Natural Lan-guage Learning, Manchester, UK.
Michael White and Rajakrishnan Rajkumar. 2009. Per-ceptron reranking for CCG realisation. InProceedings of the 2009 Conference on Empririal Methods in Nat-ural Language Processing (EMNLP’09), pages 410– 419.