Dynamic Wordclouds and Vennclouds for Exploratory Data Analysis
Glen Coppersmith
Human Language Technology Center of Excellence Johns Hopkins University
Erin Kelly Department of Defense
Abstract
The wordcloud is a ubiquitous
visualiza-tion of human language, though it falls short when used for exploratory data anal-ysis. To address some of these shortcom-ings, we give the viewer explicit control over the creation of the wordcloud, allow-ing them to interact with it in real time–
a dynamic wordcloud. This allows
itera-tive adaptation of the visualization to the data and inference task at hand. We next present a principled approach to visualiza-tion which highlights the similarities and differences between two sets of documents
– a Venncloud. We make all the
visual-ization code (primarily JavaScript) freely available.
1 Introduction
A cornerstone of exploratory data analysis is visu-alization. Tremendous academic effort and engi-neering expertise has created and refined a myriad of visualizations available to the data explorer, yet there still exists a paucity of options for visualizing
language data. Whilevisualizing human language
is a broad subject, we apply Polya’s dictum, and examine a pair of simpler questions for which we still lack an answer:
• (1) what is in this corpus of documents?
• (2) what is the relationship between these two corpora of documents?
We assert that addressing these two questions is a step towards creating visualizations of human language more suitable for exploratory data anal-ysis. In order to create a meaningful visualiza-tion, one must understand the inference question the visualization is meant to inform (i.e., the
rea-son for which (1) is being asked), so the
appro-priate aspects of the data can be highlighted with
the aesthetics of the visualization. Different infer-ence questions require different aspects to be high-lighted, so we aim to create a maximally-flexible, yet simple and intuitive method to enable a user to explore the relevant aspects of their data, and adapt the visualization to their task at hand.
The primary contributions of this paper are:
• A visualization of language data tailored for
exploratory data analysis, designed to
exam-ine a single corpus (thedynamic wordcloud)
and to compare two corpora (theVenncloud);
• The framing and analysis of the problem in
terms of the existing psychophysical litera-ture;
• Distributable JavaScript code, designed to be
simple to use, adapt, and extend.
We base our visualizations on the wordcloud,
which we deconstruct and analyze in §3 and §4.
We then discuss the literature on wordclouds and
relevant psychophysical findings in §5, taking
guidance from the practical and theoretical foun-dations explored there. We then draw heavily on similarities to more common and well understood visualizations to create a more useful version of
the wordcloud. Question (1) is addressed in §7,
and with only a small further expansion described
in§8, an approach to(2)becomes evident.
2 Motivating Inference Tasks
Exploratory data analysis on human language en-compasses a diverse set of language and infer-ence tasks, so we select the following subset for
their variety. One task in line with question (1)
is getting the general subject of a corpus, high-lighting content-bearing words. One might want to examine a collection of social media missives, too numerous to read individually, perhaps to de-tect emerging news (Petrovic et al., 2013). Sepa-rately, author identification (or idiolect analysis)
attempts attribution of documents (e.g., Shake-speare’s plays or the Federalist papers) by com-paring the author’s writing style, focusing on
stylistic and contentlesswords – for a review see
(Juola, 2006). Further, some linguistic psycho-metric analysis depends on the relative distribu-tion of pronouns and other seemingly contentless words (Coppersmith et al., 2014a; Chung and Pen-nebaker, 2007).
Each of these questions involves some sis of unigram statistics, but exactly what analy-sis differs significantly, thus no single wordcloud can display all of them. Any static wordcloud is a single point in a distribution of possible word-clouds – one way of calculating statistics from the underlying language and mapping those calcula-tions to the visual representation. Many such com-binations and mappings are available, and the opti-mal wordcloud, like the optiopti-mal plot, is a function of the data and the inference task at hand. Thus, we enable the wordcloud viewer to adjust the rela-tionship between the aspects of the data and the aesthetics of the display, which allows them to view different points in the distribution of possi-ble wordclouds. The dynamic wordcloud was im-plicitly called for in (Rayson and Garside, 2000) since human expertise (specifically knowledge of broader contexts and common sense) is needed to separate meaningful and non-meaningful differ-ences in wordclouds. We enable this dynamic in-teraction between human and visualization in real-time with a simple user interface, requiring only a modicum more engineering than the creation of a static wordcloud, though the depth of extra infor-mation conveyed is significant.
3 Wordcloud Aesthetics
We refer to each visual component of the
visual-ization as an aesthetic (ala (Wickham, 2009)) –
each aesthetic can convey some information to the viewer. For context, the aesthetics of a scatterplot
include the x and y position, color, and size of
each point. Some are best suited for ordinal data (e.g., font size), while others for categorical data (e.g., font color).
Ordinal data can be encoded by font size, the most prominent and noticeable to the viewer (Bateman et al., 2008). Likewise, the opacity (transparency) of the word is a prominent and or-dinal aesthetic. The order in which words are dis-played can convey a significant amount of
infor-mation as well, but using order in this fashion
gen-erally constrains the use ofxandyposition.
Categorical data can be encoded by the color of each word – both the foreground of the word itself and the background space that surrounds it (though that bandwidth is severely limited by hu-man perception). Likewise for font weight (bold-ness) and font decoration (italics and underlines). While font face itself could encode a categorical variable, making comparisons of all the other as-pects across font faces is likely to be at best unin-formative and at worst misleading.
4 Data Aspects
As the wordcloud has visualaestheticsthat we can
control (§3), the data we need to model hasaspects
that we want to represent with those aesthetics. This aspect-to-aesthetic mapping is what makes a useful and informative visualization, and needs to be flexible enough to allow it be used for a range of inference tasks.
For clarity, we define a word (w) as a unique
set of characters and a word token (w) as a
sin-gle usage of a word in a document. We can
ob-serve multiple word tokens (w) of the same word
(w) in a single document (d). For any documentd
we represent the term frequency ofw astfd(w).
Similarly, the inverse document frequency of w
asidf(w). A combination oftf andidf is often
used to determine important words in a document
or corpus. We focus ontf andidf here, but this is
just an example of an ordinal value associated with a word, there are many other such word-ordinal pairings that are worth exploring (e.g., weights in a classifier).
The dynamic range (“scaling” in (Wickham, 2009)) also needs to be considered, since the data has a natural dynamic range – where meaningful differences can be observed (unsurprisingly, the
definition ofmeaningfuldepends on the inference
5 Prior Art
Wordclouds have a mixed history, stemming from Jim Flanagan’s “Search Referral Zeitgeist”, used to display aggregate information about websites linking to his, to its adoption as a visual gim-mick, to the paradoxical claim that ‘wordclouds work in practice, but not in theory’ (see (Vi´egas and Wattenberg, 2008) for more). A number of wordcloud-generators exist on the web (e.g., (Feinberg, 2013; Davies, 2013)), though these tend towards creating art rather than informative visualizations. The two cited do allow the user limited interaction with some of the visual aesthet-ics, though not of sufficient scope or response time for general exploratory data analysis.
Enumerating all possible inference tasks involv-ing the visualization of natural language is impos-sible, but the prior art does provide empirical data for some relevant tasks. This further stresses the importance of allowing the user to interact with the visualization, since optimizing the
visualiza-tiona priorifor all inference tasks simultaneously
is not possible, much like creating a single plot for all numerical inference tasks is not possible.
5.1 Psychophysical Analyses
The quintessential studies on how a wordcloud is interpreted by humans can be found in (Ri-vadeneira et al., 2007) and (Bateman et al., 2008). They both investigated various measures of impression-forming and recall to determine which aesthetics conveyed information most effectively – font size chief among them.
Rivandeneira et al. (Rivadeneira et al., 2007) also found that word-order was important for im-pression forming (displaying words from most fre-quent to least frefre-quent was most effective here), while displaying words alphabetically was best when searching for a known word. They also found that users prefer a search box when search-ing for somethsearch-ing specific and known, and a word-cloud for exploratory tasks and things unknown.
Bateman et al. (Bateman et al., 2008) examined the relative utility of other aesthetics to convey in-formation, finding that font-weight (boldness) and intensity (opacity) are effective, but not as good as font-size. Aesthetics such as color, number of characters or the area covered by the word were less effective.
Significant research has gone in to the place-ment of words in the wordcloud (e.g., (Seifert et
al., 2008)), though seemingly little information can be conveyed by these layouts (Schrammel et al., 2009). Indeed, (Rivadeneira et al., 2007) in-dicates that words directly adjacent to the largest word in the wordcloud had slightly worse recall than those not-directly-adjacent – in essence, get-ting the most important words in the center may be counterproductive. Thus we eschew these algo-rithms in favor of more interpretable (but perhaps less aesthetically pleasing) linear ordered layouts.
5.2 Wordclouds as a tool
Illustrative investigations of the wordcloud as a tool for exploratory data analysis are few, but en-couraging.
In relation to question (1), even static
word-clouds can be useful for this task. Users per-forming an open-ended search task preferred us-ing a wordcloud to a search box (Sinclair and Cardew-Hall, 2008), possibly because the word-cloud prevented them from having to hypothesize what might be in the collection before searching for it. Similarly, wordclouds can be used as a follow-up display of search results from a query performed via a standard text search box (Knautz et al., 2010), providing the user a crude summary of the results. In both of these cases, a simple static wordcloud is able to provide some useful information to the user, though less research has been done to determine the optimal composition of the wordcloud. What’s more, the need for a dynamic interactive wordcloud was made explicit (Knautz et al., 2010), given the way the users iter-atively refined their queries and wordclouds.
Question(2) has also been examined. One
ap-proach is to make a set of wordclouds with soft constraints that the same word appears in roughly the same position across multiple clouds to fa-cilitate comparisons (Castella and Sutton, 2013).
Each of these clouds in a wordstormvisualizes a
different collection of documents (e.g., subdivi-sions via metadata of a larger corpus).
ex-plicit removal of words and outliers that the user does not wish to have displayed (an exclusion list), rather than adjusting calculations of the en-tire cloud to remove them in a principled and fair manner.
5.3 Wordclouds and Metadata
Wordclouds have previously been extended to convey additional information, though these adap-tations have been optimized generally for artistic purposes rather than exploratory data analysis.
Wordclouds can been used to display how lan-guage interacts with a temporal dimension in (Du-binko et al., 2007; Cui et al., 2010; Lee et al., 2010). Dubinko and colleagues created a tag cloud variant that displays trends in tag usage over time, coupled with images that have that tag (Dubinko et al., 2007). An information-theoretic approach to displaying information changing in time gives rise to a theoretically grounded approach for display-ing pointwise tag clouds, and highlightdisplay-ing those pieces that have changed significantly as com-pared to a previous time period (Cui et al., 2010). This can be viewed as measuring the change in overall language usage over time. In contrast, us-ing spark lines on each individual word or tag can convey temporal trends for individual words (Lee et al., 2010).
Meanwhile, combining tag clouds with geospa-tial data yields a visualization where words can be displayed on a map of the world in locations they are frequently tagged in, labeling famous land-marks, for example (Slingsby et al., 2007).
6 Desiderata
In light of the diverse inference tasks (§2) and
prior art (§5), the following desiderata emerge for
the visualization. These desiderata are explicit choices, not all of which are ideal for all infer-ence tasks. Thus, chief among them is the first: flexibility to allow maximum extensions and mod-ifications as needed.
Flexibleandadjustable in real time: Any sin-gle static wordcloud is guaranteed to be subopti-mal for at least some inference tasks, so allowing the user to adjust the aspect-to-aesthetic mapping of the wordcloud in real time enables adaptation of the visualization to the data and inference task
at hand. The statistics described in§4 are relevant
to every language collection (and most inference tasks), yet there are a number of other ordinal
val-ues to associate a word (e.g., the weight assigned
to it by a classifier). Thus, tf andidf are meant
to be illustrative examples though the visualization code should generalize well to others.
Though removal of the most frequent words (stopwords) is useful in many natural language processing tasks, there are many ways to define which words fall under this category. Unsurpris-ingly, the optimal selection of these words can also depend upon the task at hand (e.g., psychiatric v.
thematic analysis as in§2), so maximum flexibility
and minimum latency are desirable.
Interpretable: An explicit legend is needed to interpret the differences in visual aesthetics and what these differences mean with respect to the underlying data aspects.
Language-Agnostic: We need methods for ex-ploratory data analysis that work well regard-less of the language(s) being investigated. This is crucial for multilingual corpora, yet decidedly nontrivial. These techniques must be maximally language-agnostic, relying on only the most rudi-mentary understanding of the linguistic structure of the data (e.g., spaces separate words in English, but not in Chinese), so they can be extended to many languages easily.
This precludes the use of a fixed set of stop words for each language examined, since a new set of stopwords would be required for each language explored. Alternatively, the set of stopwords can be dealt with automatically, either by granting the user the ability to filter out words in the extremes
of the distributions (tf anddf alike) through the
use of a weight which penalizes these ubiquitous or too-rare words. Similarly precluded is the use of stemming to deal with the many surface forms of a given root word (e.g., type, typing, typed).
7 Dynamic Wordclouds
We address Question (1) and a number of our
desiderata with the addition of explicitly labeled controls to the static wordcloud display, which al-lows the user to control the mapping from data aspects to the visualization aesthetics. We sup-plement these controls with an explicit explana-tion of how each aesthetic is affected by each aspect, so the user can easily read the relevant mappings, rather than trying to interpret the loca-tion of the sliders. An example of which is that “Larger words are those that frequently occur in
[X]entitiescommoncloud filtertf filteridfcontrolssize controlsopacitysortbywordclouddescription do not redraw
highlight keywords
orioles at to for in
baltimore a game i
and yankees of go
on is this vs w/ o's
are it
win with
be i'm
my you
that
others newhave just 2 3 up 1 let's first so all tonight fans but out season we now get sox an time md series al baseball will about me not like as 5 playoff lets from over was they if what 4 good no great year day one love back amp fan magic can east playoffs beat gt red sports rt today do going how last more place team games night blue
file:///Users/gcoppersmith/Desktop/dwc_dev/orioles.html
1 of 2 2/24/14, 4:36 PM
[X]entitiescommoncloud filtertf filteridfcontrolssize controlsopacitysortbydescriptionwordcloud do not redraw
highlight keywords
13 espn fox leads md ny report star usa buck chris glove mark move press
14 gold hamilton jim third birds gonzalez j o september white homers rangers tigers 15 fall yankee sox yard al happen pick blue cc extra m old card closer hits tie tied face omg ravens says yahoo city saying second starting stay ass manager players real lt three bout football left sunday sweep goes hey gets wild yanks adam job news times won't magic place innings 2013 base gt hr pitching does fucking os rain 10 friday outs suck coming makes also check wearing haha show through god los losing may always being keep 9 hate gotta looks making posted away free im life we're weekend call give little bar bring didn't doing least look stop thing top where giants long photo record johnson league most thank tv ? please proud walk wish 2012 any end every hell post same because many pitch said its new runs everyone excited field finally bullpen let red yes believe fun made these boys hit into those against mlb race i'll teams amazing say w years another people 1st both postseason wait before 8 looking loss him lead man shit feel inning damn oh 7 baby i've again should bad then thanks two wins nice much that's winning yankees than gonna playing tickets yeah awesome beat why division lol wow congrats lost ready lose us big could never even fuck our want since ball ever happy start am better make run hope think only over he were getting has sports really his u work 6 next won checked chicago did them some after well best tomorrow watch take their when had too orioles there an games world need who 0 stadium clinch your been down love don't way by east or know off play would 4 more o's it's no can't rt playoffs right as still how can back here playoff 1 5 year 3 night watching team do last one amp got day series home see come great today from like 2 will fan going what pic they about time good lets first season if get was tonight we not fans let's all me baseball out now up just so but have be win you that with i'm it are my others this is washington on vs of w/ go i and
file:///Users/gcoppersmith/Desktop/dwc_dev/orioles.html
1 of 1 2/24/14, 4:35 PM
[X]entitiescommoncloud filtertf filteridfcontrolssize controlsopacitysortbywordclouddescription do not redraw
highlight keywords
0 1 1st 2 2012 3 4 5 6 7 ? a about after again against al all amp an and are as
at back
baltimore
baseball be beat been best better big birds blue buck but by can can't card checked chicago come could day did do don't down east espn even ever fan fans first for from fuck game games get go going gonna good got great gt had has have he here his hit home how i i'm if in inning is it it's johnson just keep know last lead let's lets like lol lose lovemagic make mark
md
me mlb more my need new news next night no not now o's of off on one only ororioles
others our out over photo pic place play playoff playoffs post postseason rangersravens really red report right rt run season see series should since so some
sox sports start still take team than that their them there they think this tied time times to today tomorrow tonight two up vs w/ was watch watching way we well were what when white who why wild will win with won world would yahoo
yankees yanks year years you your
file:///Users/gcoppersmith/Desktop/dwc_dev/orioles.html
[image:5.595.80.520.62.221.2]1 of 1 2/24/14, 4:37 PM
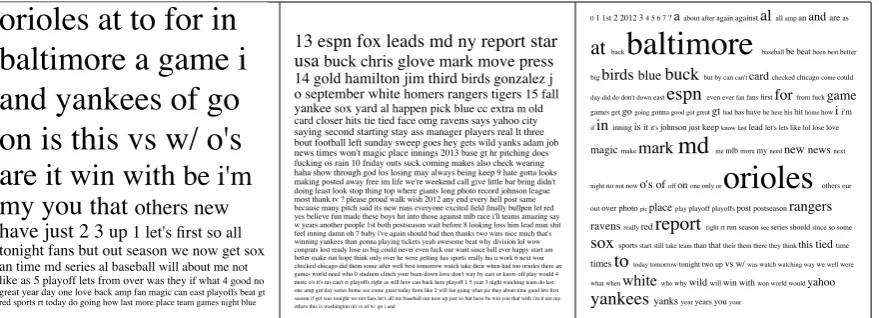
Figure 1: Three example settings of the dynamic wordcloud for the same set of tweets containing “Orioles”. Left: size
reflectstf, sorted bytf; Center: size reflectsidf, sorted byidf; Right: size reflectstf*idf, sorted alphabetically.
aesthetic font-size (and this description is tied to the appropriate sliders so it updates as the slid-ers are changed). The manipulation of the visu-alization in real time allows us to take advantage of the human’s adept visual change-detection to highlight and convey the differences between set-tings (or a range of setset-tings), even subtle ones.
The data aspects from§4 are precomputed and
mapped to the aesthetics from §3 in a JavaScript
visualization displayed in a standard web browser. This visualization enables the user to manipulate the aspect-to-aesthetic mapping via an intuitive set of sliders and buttons, responsive in real time. The sliders are roughly segmented into three cat-egories: those that control which words are dis-played, those that control how size is calculated, and those that control how opacity is calculated. The buttons control the order in which words ap-pear.
One set of sliders controls which words are displayed by examining the frequency and
rar-ity of the words. We define the range τF req =
[tmin
F req, tmaxF req]as the range oftfvalues for words to
be displayed (i.e.,tf(w) ∈ τF req). The viewer is
granted a range slider to manipulate bothtmin
F reqand
tmax
F req to eliminate words from the extremes of the
distribution. Similarly for df andτRarity. Those
words that fall outsideτF req orτRarityare not
dis-played. Importantly,tfis computed from the
cur-rent corpus displayed whiledf is computed over a
much larger collection (in our running examples, all the works of Shakespeare or all the tweets for
the last 6 months). Those with high df or high
tf are often stopwords, those with lowtf and low
df are often rare, sometimes too rare to get good
estimates oftforidf (e.g., names).
A second set of sliders controls the mapping be-tween aspects and aesthetics for each individual word. Each aesthetic has a weight for the
impor-tance of rarity (γRarity) and the importance of
fre-quency (γF req), corresponding to the current
val-ues of their respective slider (each in the range
[0,1]). For size, we compute a weight attributed
to each data aspect:
ωF req(w) = (1−γF req) +γF reqtf(w)
and similarly forRarity.
In both cases, the aesthetic’s value is computed via an equation similar to the following:
a(w) =ωF req(w)ωRarity(w)γRangeb
where a(w) is either font size or opacity, and b
is some base value of the aesthetic (scaled by a
dynamic range slider,γRange) and the weights for
frequency and rarity of the word. In this manner, the weights are multiplicative, so interactions
be-tween the variables (e.g.,tf*idf) are apparent.
Though unigram statistics are informative, see-ing the unigrams in context is also important for many inference tasks. To enable this, we use reser-voir sampling (Vitter, 1985) to maintain a repre-sentative sample of the observed occurrences of each word in context, which the user can view by clicking on the word in the wordcloud display.
Examples of the dynamic wordcloud in various settings can be found in Figure 1, using a set of tweets containing “Orioles”. The left wordcloud
hastf mapped to size, the center withidf mapped
to size, and the right with both hightf and high
idf mapped to size. We only manipulate the size
to the small format, various values for τF req and
τRarity are employed, and order is varied – the
left is ordered in descending order in terms of fre-quency, the center is ordered in descending order in terms of rarity, and the right is in alphabetical order.
8 Vennclouds
Question(2)– “how are these corpora related”
re-quires only a single change to the dynamic
sin-gle wordcloud described in §7. We refer to two
corpora, left and right, which we abbreviate L
and R (perhaps a set of tweets containing
“Ori-oles” forleftand those containing “Nationals” for
rightas in Figure 2). For therightdocuments, let
R ={d1, ..., dnR}so|R|=nRand letTRbe the
total number of tokens in all the documents inR
TR=X
d∈R
|Td|
We separate the wordcloud display into three re-gions, one devoted to words most closely
associ-ated with R, one devoted to words most closely
associated withL, and one for words that should
be associated with both. “Association” here can be defined in a number of ways, but for the nonce we define it as the probability of occurrence in that corpus – essentially term frequency, normalized by corpus length. Normalizing by length is re-quired to prevent bias incurred when the corpora
are different sizes (TL 6= TR). Specifically, we
define the number of timeswoccurs inleft(tf) as
tfL(w) =
X
di∈L
T(w, di)
and this quantity normalized by the number of
to-kens inL,
tfL(w) =tfL(w)/TL
and this quantity as it relates to the term frequency
of thiswin both corpora
tfL|R(w) = tf tfL(w)
L(w) +tfR(w)
Each word is only displayed once in the
Ven-ncloud (see Figure 2, so if a word (w) only occurs
inR, it is always present in the rightregion, and
likewise for Landleft. Ifw is in bothL andR,
we examine the proportion of documents in each
thatwis in and use this to determine in which
[image:6.595.306.525.58.348.2]re-gion it should be displayed. In order to deal with
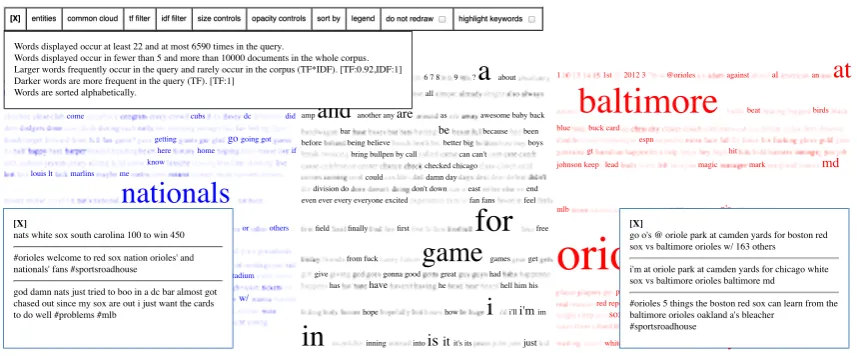
Figure 2:Three example Vennclouds, with tweets
contain-ing “Orioles” on the left, “Nationals” on the right, and com-mon words in the middle. From top to bottom we allow pro-gressively larger common clouds. The large common words make sense – both teams played aChicagoteam and made theplayoffs in the time covered by these corpora.
the cases wherewoccurs in approximately similar
proportions ofleft andrightdocuments, we have
a center region (in the center in Figure 2). We
define a threshold (τCommon) to concretely define
“approximately similar”. Specifically,
• iftfR(w) = 0,wis displayed inleft.
• iftfL(w) = 0,wis displayed inright.
• iftfR(w)>0andtfL(w)>0,
– iftfR|L(w)> tfL|R(w) +τCommon,w
is displayed inright.
– iftfL|R(w)> tfR|L(w) +τCommon,w
is displayed inleft.
– Otherwise,wis displayed incenter.
The user is given a slider to controlτCommon,
al-lowing them to determine what value of “approx-imately similar” best fits the data and their task at hand.
9 Anecdotal Evaluation
[X]
[X] entitiesentities common cloudcommon cloud tf filtertf filter idf filteridf filter size controlssize controls opacity controlsopacity controls sort bysort by legendlegend do not redraw do not redraw highlight keywords highlight keywords
@
@nationals am
baseball best bryce but cardinals cards clinch
come cubs dc did
getting go going got here home if know
louis lt marlins me
nationals
nats
nl not or otherspark philadelphia phillies pic see st stadium strasburg teddy
today too u w/
was washington watching well werth work
0 2 4 5 6 7 8 9 ?
a
about after again allamp and another any are as awesome baby back bar be because been before being believe better big boys
bring bullpen by call can can't checked chicago could damn day
division do don't down east end even ever every everyone excited fan fans feel field finally first
for
freefrom fuck
game
games get give gonna good great hadhas have he hell him his
hope how
i
i'll i'm imin
inning into is it it's its justlast league let let's lets life like little lol long look looking lose losing loss love made make man many
more most much my need next night no now of off oh on one only our out pitch play
playing playoff playoffs please postseason proud ready really right rt run runs said
say season series should since so some
start still take team than thank thanks that that's their them then there these they thing
think this those time
to
tomorrow tonight twoup vs wait want watch way we
were what when where who why will win winning wish with won world would yeah year yes you your
1 1st 2012 3 @orioles against al an
at
baltimore
beat birds blue buck cardespn
gt hit
johnson keep lead magic mark md
mlb new news o's
orioles
over photo placepost rangers ravens
red report sox sports
tied
white wild yahoo yankees yanks years
Words displayed occur at least 22 and at most 6590 times in the query.
Words displayed occur in fewer than 5 and more than 10000 documents in the whole corpus. Larger words frequently occur in the query and rarely occur in the corpus (TF*IDF). [TF:0.92,IDF:1] Darker words are more frequent in the query (TF). [TF:1]
Words are sorted alphabetically.
[X]
go o's @ oriole park at camden yards for boston red sox vs baltimore orioles w/ 163 others
i'm at oriole park at camden yards for chicago white sox vs baltimore orioles baltimore md
#orioles 5 things the boston red sox can learn from the baltimore orioles oakland a's bleacher #sportsroadhouse
[X]
nats white sox south carolina 100 to win 450
#orioles welcome to red sox nation orioles' and nationals' fans #sportsroadhouse
god damn nats just tried to boo in a dc bar almost got chased out since my sox are out i just want the cards to do well #problems #mlb
file:///Users/gcoppersmith/src/dwc_dev/nats_v_orioles.html
[image:7.595.86.515.61.239.2]1 of 1 4/24/14, 9:53 AM
Figure 3:Screenshot of a Venncloud, with controls. The sliders are accessible from the buttons across the top, displaying as
a floating window above the wordcloud itself (replacing the current display of the legend). Also note the examples in the lower left and right corners, accessed by clicking on a word of interest (in this case “Sox”).
and Vennclouds for various tasks as compared to their static counterparts (and other visualizations). In part, this is because such an evaluation requires selection of inference tasks to be examined, pre-cisely what we do not claim to be able to do. We leave for future work the creation and evaluation of a representative sample of such inference tasks. We strongly believe that the plural of anecdote is not data – so these anecdotes are intended as illustrations of use, rather than some data regard-ing utility. The dynamic wordclouds and Ven-nclouds were used on data from across the spec-trum, from tweets to Shakespeare and political speeches to health-related conversations in devel-oping nations. In Shakespeare, character and place names can easily be highlighted with one set of
slider settings (high tf*idf), while comparisons
of stopwords are made apparent with another (high
tf, noidf). Emerging from the debates between
Mitt Romney and Barack Obama are the common themes that they discuss using similar (economics) and dissimilar language (Obama talks about the “affordable care act” and Romney calls it “Oba-macare”). These wordclouds were also used to do some introspection on the output of classifiers in sentiment analysis (Mitchell et al., 2013) and men-tal health research (Coppersmith et al., 2014b) to expose the linguistic signals that give rise to suc-cessful (and unsucsuc-cessful) classification.
10 Conclusions and Future Directions Exploratory data analysis tools for human lan-guage data and inference tasks have long lagged behind their numerical counterparts, and here we
investigate another step towards filling that need. Rather than determining the optimal wordcloud, we enable the wordcloud viewer to adapt the visu-alization to the data and inference task at hand. We suspect that the pendulum of control has swung too far, and that there is a subset of the
possi-ble control configurations that produceusefuland
informative wordclouds. Work is underway to
collect feedback via instrumented dynamic word-clouds and Vennword-clouds as they are used for various inference tasks to address this.
Previous research, logic, and intuition were used to create this step, though it requires fur-ther improvement and validation. We provide anecdotes about the usefulness of these dynamic wordclouds, but those anecdotes do not provide sufficient evidence that this method is somehow more efficient (in terms of human time) than ex-isting methods. To make such claims, a controlled human-factors study is required, investigating (for a particular inference task) how this method af-fects the job of an exploratory data analyst. In the meantime, we hope making the code freely
available1will better enable our fellow researchers
to perform principled exploratory data analysis of human language content quickly and encourage a deeper understanding of data, within and across disciplines.
Acknowledgments
We would like to thank Carey Priebe for in-sightful discussions on exploratory data analysis,
Aleksander Yelskiy, Jacqueline Aguilar, Kristy Hollingshead for their analysis, comments, and improvements on early versions, and Ainsley R. Coppersmith for permitting this research to progress in her early months.
References
Scott Bateman, Carl Gutwin, and Miguel Nacenta. 2008. Seeing things in the clouds: the effect of vi-sual features on tag cloud selections. InProceedings of the nineteenth ACM conference on Hypertext and hypermedia, pages 193–202. ACM.
Quim Castella and Charles A. Sutton. 2013. Word storms: Multiples of word clouds for visual
compar-ison of documents. CoRR, abs/1301.0503.
Cindy Chung and James W Pennebaker. 2007. The
psychological functions of function words. Social
communication, pages 343–359.
Christopher Collins, Fernanda B Viegas, and Martin Wattenberg. 2009. Parallel tag clouds to explore and analyze faceted text corpora. InVisual Analyt-ics Science and Technology, 2009. VAST 2009. IEEE Symposium on, pages 91–98. IEEE.
Glen Coppersmith, Mark Dredze, and Craig Harman. 2014a. Quantifying mental health signals in twitter. InProceedings of ACL Workshop on Computational Linguistics and Clinical Psychology. Association for Computational Linguistics.
Glen Coppersmith, Craig Harman, and Mark Dredze. 2014b. Measuring post traumatic stress disorder in
Twitter. InProceedings of the International AAAI
Conference on Weblogs and Social Media (ICWSM). Weiwei Cui, Yingcai Wu, Shixia Liu, Furu Wei, Michelle X Zhou, and Huamin Qu. 2010. Context preserving dynamic word cloud visualization. In
Pacific Visualization Symposium (PacificVis), 2010
IEEE, pages 121–128. IEEE.
Jason Davies. 2013. Wordcloud generator using d3, April.
Micah Dubinko, Ravi Kumar, Joseph Magnani, Jas-mine Novak, Prabhakar Raghavan, and Andrew
Tomkins. 2007. Visualizing tags over time. ACM
Transactions on the Web (TWEB), 1(2):7. Jason Feinberg. 2013. Wordle, April.
Patrick Juola. 2006. Authorship attribution.
Founda-tions and Trends in information Retrieval, 1(3):233– 334.
Kathrin Knautz, Simone Soubusta, and Wolfgang G Stock. 2010. Tag clusters as information retrieval
interfaces. InSystem Sciences (HICSS), 2010 43rd
Hawaii International Conference on, pages 1–10. IEEE.
Bongshin Lee, Nathalie Henry Riche, Amy K
Karl-son, and Sheelagh Carpendale. 2010.
Spark-clouds: Visualizing trends in tag clouds. Visualiza-tion and Computer Graphics, IEEE TransacVisualiza-tions on, 16(6):1182–1189.
Margaret Mitchell, Jacqueline Aguilar, Theresa Wil-son, and Benjamin Van Durme. 2013. Open domain targeted sentiment. InProceedings of the 2013 Con-ference on Empirical Methods in Natural Language Processing, pages 1643–1654. Association for Com-putational Linguistics.
Saˇsa Petrovic, Miles Osborne, Richard McCreadie, Craig Macdonald, Iadh Ounis, and Luke Shrimpton. 2013. Can twitter replace newswire for breaking
news. InSeventh International AAAI Conference on
Weblogs and Social Media.
Paul Rayson and Roger Garside. 2000. Comparing
corpora using frequency profiling. InProceedings
of the workshop on Comparing Corpora, pages 1–6. Association for Computational Linguistics.
AW Rivadeneira, Daniel M Gruen, Michael J Muller, and David R Millen. 2007. Getting our head in the clouds: toward evaluation studies of tagclouds. In
Proceedings of the SIGCHI conference on Human factors in computing systems, pages 995–998. ACM. Johann Schrammel, Michael Leitner, and Manfred
Tscheligi. 2009. Semantically structured tag
clouds: an empirical evaluation of clustered presen-tation approaches. InProceedings of the 27th inter-national conference on Human factors in computing systems, pages 2037–2040. ACM.
Christin Seifert, Barbara Kump, Wolfgang Kienreich, Gisela Granitzer, and Michael Granitzer. 2008. On the beauty and usability of tag clouds. In Informa-tion VisualisaInforma-tion, 2008. IV’08. 12th InternaInforma-tional Conference, pages 17–25. IEEE.
James Sinclair and Michael Cardew-Hall. 2008. The folksonomy tag cloud: when is it useful? Journal of Information Science, 34(1):15–29.
Aidan Slingsby, Jason Dykes, Jo Wood, and Keith
Clarke. 2007. Interactive tag maps and tag
clouds for the multiscale exploration of large
spatio-temporal datasets. In Information Visualization,
2007. IV’07. 11th International Conference, pages 497–504. IEEE.
Fernanda B Vi´egas and Martin Wattenberg. 2008. Timelines tag clouds and the case for vernacular vi-sualization. interactions, 15(4):49–52.
Jeffrey S Vitter. 1985. Random sampling with a
reser-voir. ACM Transactions on Mathematical Software
(TOMS), 11(1):37–57.
Hadley Wickham. 2009.ggplot2: elegant graphics for