Measuring Similarity from Word Pair Matrices
with Syntagmatic and Paradigmatic Associations
Jin Matsuoka
IPS, Waseda University Fukuoka, Japan
jinmatsuoka@akane.waseda.jp
Yves Lepage
IPS, Waseda University Fukuoka, Japan
yves.lepage@waseda.jp
Abstract
Two types of semantic similarity are usually distinguished:attributionalandrelational similari-ties. These similarities measure the degree between words or word pairs. Attributional similar-ities are bidrectional, while relational similarsimilar-ities are one-directional. It is possible to compute such similarities based on the occurrences of words in actual sentences. Inside sentences, syn-tagmatic associations and paradigmatic associations can be used to characterize the relations between words or word pairs. In this paper, we propose a vector space model built from syn-tagmatic and paradigmatic associations to measure relational similarity between word pairs from the sentences contained in a small corpus. We conduct two experiments with different datasets: SemEval-2012 task 2, and 400 word analogy quizzes. The experimental results show that our proposed method is effective when using a small corpus.
1 Introduction
Semantic similarity is a complex concept which has been widely discussed in many research domains (e.g., linguistics, philosophy, information theory communication, or artificial intelligence). In natural language processing (NLP), two types of semantic similarity are identified: attributionalandrelational similarities. Until now, many researchers reported for measuring these similarities.
Attributional similarity consists in comparing semantic attributes contained in each word. For ex-ample, the two words carandautomobile share many attributes and, consequently, their attributional similarity is high , whereas the attributional similarity betweencaranddriveis low. If the attributional similarity is high, this means that the words are structurally similar. Indeed,carandautomobileare con-sidered as synonyms because they share almost all of their structural attributes. Attributional similarity is not confined to synonymy but is also related to such relations as hypernymy/hyponymy.
Relational similarity compares the semantic relations between pairs of words. For example, fish:fins :: bird:wings asserts that fish is to fins as bird is to wings: i.e., the semantic relations betweenfishandfinsare highly similar to the semantic relations betweenbirdandwings. To find the relational similarity between two words, knowledge resources such as WordNet (Miller, 1995) or On-tology (Suchanek et al., 2007) are generally used. Lexical syntactic patterns between two words also help in identifying relational similarity. For instance, the lexical syntactic patten ‘is a’ helps to identify hypernyms (Hearst, 1992; Snow et al., 2004).
To measure the attributional similarity between words or the relational similarity between word pairs, Vector Space Models (VSM) are mainly used (Turney, 2005; Turney and Littman, 2005; Turney, 2006). The expressiveness of a vector space model differs in the way it is built the matrices. The different way to build the matrices is based on two types of associations. In this paper, we use two types of associations which are well-known in linguistics: syntagmatic associations and paradigmatic associations.
Syntagmatic associations originate from word co-occurrences in texts. Latent Semantic Analysis (LSA) relies on such syntagmatic associations. It has been successful at simulating a wide range of psychological and psycholinguistic phenomena, from judgments of semantic similarity (Landauer and This work is licensed under a Creative Commons Attribution 4.0 International Licence. Page numbers and proceedings footer are added by the organisers. Licence details:http://creativecommons.org/licenses/by/4.0/
Dumais, 1997). Paradigmatic associations, however, reflect more the semantic attributes of words. Hy-perspace Analogue to Language (HAL) (Lund and Burgess, 1996) is related to LSA, but also makes use of paradigmatic associations by capitalizing on positional similarities between words across contexts. LSA and HAL consider simply different types of space built from texts, and the differences are reflected in the structural representations formed by each model (Jones and Mewhort, 2007).
In this paper, we propose a vector space model with both syntagmatic and paradigmatic associations to measure relational similarity between word pairs. The dimensions for each word pair in our proposed model show the distribution between words. To avoid data sparseness in the dimensions, we make use of a word clustering method in a preprocessing step. We then build our proposed model with syntag-matic and paradigsyntag-matic associations on the results of the clustering step. We conduct two experiments on SemEval-2012 task 2 and Scholastic Assessment Test (SAT) analogy quizzes to measure relational similarity to evaluate our model.
The rest of the paper is organized as follows. We describe similar research in Section 2. Our proposed vector space model to capture syntagmatic and paradigmatic associations is presented in Section 3. The experimental results and evaluations for relational similarity, and SAT analogy quizzes are shown in Section 4. We present our conclusions in Section 5.
2 Related work
A popular approach with vector space model for measuring similarities between words is to compute the similarities of their distribution in large text data. The underlying assumption is the distributional hypothesis(Harris, 1954): words with similar distribution in language should have similar meanings. The two main approaches, LSA and HAL, for producing word spaces differ in the way context vectors are produced. LSA with term-document matrices have a greater potential for measuring semantic similarity between words. LSA capitalizes on a word’s contextual co-occurrence, but not on how a word is used in that context. HAL’s co-occurrence matrix is a sparse word-word matrix. In HAL, words that appear in similar positions around the same words tend to develop similar vector representations. HAL is related to LSA, but HAL can be said to insist more on paradigmatic associations and LSA more on syntagmatic associations.
Bound Encoding of the AGgregate Language Environment (BEAGLE) (Jones and Mewhort, 2007) is a model that combines syntagmatic and paradigmatic associations. The BEAGLE model has two matrices for representing word meanings with syntagmatic and paradigmatic associations: one for order infor-mation and another one for contextual inforinfor-mation. By combining the order inforinfor-mation and contextual information, the BEAGLE model can express syntagmatic and paradigmatic associations. These mod-els are built from word to word co-occurrences and word to document (context) co-occurrences, which measure only attributional similarity between words. We claim, however, that attributional similarity be-tween words is of little value. For example, the attributional similarity bebe-tween “fish” and “fins” is weak, and it is also the case between “bird” and “wings”. However, in terms of relational similarity, there is a high similarity between “fish:fins” and “bird:wings”. This shows that there may be more potentiality in comparing word pairs rather than simply words.
3 Proposed model
In this section, we describe our proposed pair-feature matrices which capture syntagmatic and paradig-matic associations. To build the pair-feature matrices, we consider that syntagparadig-matic associations between words are co-occurrences and paradigmatic associations are substitutions between words in the same contexts. The direct use of such features leads to a large number of dimensions, which may result in data sparseness. Section 3.1 will be dedicated to the solution we propose to avoid this problem. We show how to build our pair-feature matrices with syntagmatic and paradigmatic associations in Section 3.2.
3.1 Data sparseness
A critical problem in statistical natural language processing is data sparseness. One way to reduce this problem is to group words into equivalence classes. Typically, word classes are used in language modeling to reduce the problem of data sparseness.
The practical goal of our proposal is to achieve reasonable performance in measuring relational simi-larity and semantic proportional analogy from a small corpus. We will show that even small corpora have a great potential to measure similarity in actual tasks. Building a pair-feature matrices in such a setting obviously leads to sparseness since word pairs do not easily co-occur in the sentences of small corpora. We use clustering methods to cluster words into equivalence classes to reduce the problem. Here, we make use of monolingual word clustering (Och, 1999)1. This method is based on maximum-likelihood
estimation with Markov model. We build our proposed pair-feature model described in Section 3.2 based on the results of word clustering.
3.2 Vector Space Model (VSM)
VSM (Salton et al., 1975) is an algebraic model for representing any object as a vector of identifiers. There are many ways to build a semantic space, like term-document, term-context, and pair-pattern ma-trices (Turney and Pantel, 2010). Turney (2006) showed that pair-pattern mama-trices are suited to measur-ing the similarity of semantic relations between pairs of words; that is, relational similarity. Conversely, word-context matrices are suited to measuring attributional similarity.
In this paper, we build a vector space of pair-feature after preprocessing the training corpus by a word clustering method. In a pair-feature matrix, row vectors correspond to pairs of words, such as “fish:fins” and “bird:wings”, and column vectors correspond to the features grouped by the word clustering method. We set 3×N column vector size, N features annotated by the word clustering method described in previous section. The reason for setting the vector size to three times the number of features is to represent syntagmatic and paradigmatic associations in our proposed model. Our main original idea is to build a column vector ofaffixes. A sentence containing a word pair is divided into three parts:
• a prefix part, which consists in the word classes found around the first word of the word pair in the sentence in a window of a given size called the context window;
• an infix part, which consists in the word classes of the words found the words of between the word pair in the sentence;
• a suffix part, which consists in the word classes found around the second word of the word pair in the sentence in a window of a given size (context window);
We show below an example of how to build our pair-feature matrix representation. Let us consider the three following sentences.
diurnal bird of prey typically having short rounded wings and a long tail, (i) tropical fish with huge fanlike pectoral fins for underwater gliding, (ii)
the occupation of catching fish for a living. (iii)
The words in the three sentences are clustered by the word clustering tool as indicated in Table 1. From
class word p(c) −logp(c)
c1 diurnal, tropical, huge, pectoral 0.17 1.79
c2 of, and, a, with, for 0.21 1.57
c3 bird, prey, wings, tail, fish, fins, underwater 0.29 1.23
c4 typically, rounded, fanlike 0.13 2.08
[image:4.595.138.460.177.264.2]c5 having, short, long, gliding, catching 0.21 1.57
Table 1: An example annotated by the word clustering method.
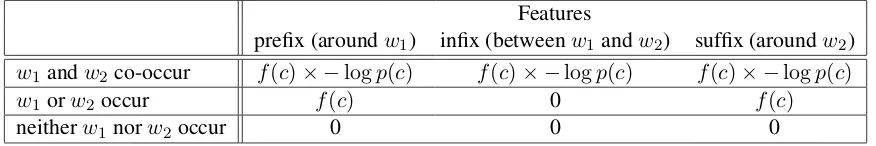
the sentences annotated with the word classes, we add up weights for each classcfor each feature part in the pair-feature matrix (see Table 5) according to the following formula.
weight(c) =
f(c)× −logp(c), ifw1andw2co-occur in the sentence
f(c), if only one ofw1 orw2occurs in the sentence
0, if neitherw1norw2occurs in the sentence
(1)
Here,cis the class of a word (e.g., c1, c2, or c3) andf is the frequency ofc, i.e., the number of times the classcappears in the sentence considered for each feature part (prefix, infix, suffix). The proportion p(c)of a class is the relative proportion of occurrences of this class computed over the entire corpus. We show how to compute each feature in Table 2. If the word pair co-occur in some sentences, theweight
Features
prefix (aroundw1) infix (betweenw1andw2) suffix (aroundw2)
w1andw2co-occur f(c)× −logp(c) f(c)× −logp(c) f(c)× −logp(c)
w1orw2occur f(c) 0 f(c)
neitherw1norw2occur 0 0 0
Table 2: Computation ofweightsfor a givencand a given word pair “w1:w2” for a given sentence.
is modified by the self-information. If one word in the word pair occurs alone in some sentences, we compute only paradigmatic feature part (syntagmatic feature part, infix, is 0). All the weights coming from all the sentences are added up for each class for each feature part in the final vector corresponding to one word pair. In VSM, the weighting scheme is poring-wise information or TF-IDF.
For example, given the word pair “fish:fins”, the feature parts are defined as follows: bird of prey typically having short rounded wings and a long tail, (i) tropicalfish with huge fanlike pectoral finsfor underwater gliding, (ii) the occupation of catchingfishfor a living. (iii)
[image:4.595.81.519.454.527.2]c1 c2 c3 c4 c5
prefix tropical, with, huge 2 1 0 0 0
[image:5.595.143.455.67.128.2]infix with, huge, fanlike, pectoral 2 1 0 1 0 suffix fanlike, pectoral, for, underwater 1 1 1 1 0
Table 3: Computation off for a given word pair “fish:fins” with Table 1.
c1 c2 c3 c4 c5 prefix of, catching, for, a 0 0 3 0 1
infix 0 0 0 0 0
[image:5.595.175.425.164.226.2]suffix 0 0 0 0 0
Table 4: Computation offfor a given word pair “fish:eat” with Table 1.
Let us consider a word pair which is not found in any sentence, e.g., the word pair “fish:eat”. The computation off in this case is shown in Table 4. The wordfishoccurs in the sentence (iii). The word eatdoes not appear in any sentence. Consequently, the frequency of each class is 0 in the suffix feature part.
Table 5 shows the pair-feature matrix computed from the three above sentences for three word pairs. Each cell in Table 5 is computed using the results given in Tables 1-4. For example, for “fish:fins” the
Features
prefix infix suffix
c1 c2 c3 c4 c5 c1 c2 c3 c4 c5 c1 c2 c3 c4 c5
bird:wings 1.79 1.57 1.23 0.0 0.0 0.0 1.57 2.46 2.08 1.57 0.0 3.14 0.0 2.08 1.57 fish:fins 3.58 1.57 0.0 0.0 0.0 3.58 1.57 0.0 2.08 0.0 1.79 1.57 1.23 2.08 0.0 fish:eat 0.0 4.71 0.0 0.0 1.57 0.0 0.0 0.0 0.0 0.0 0.0 0.0 0.0 0.0 0.0
Table 5: Pair-feature matrix computed using sentences (i)-(iii).
value for c1 in the prefix is 3.58 (computed according to Formula 1 using−logp(c1) = 1.79in Table 1 andf(c1) = 2in Table 3). The infix cells corresponding to “fish:eat” are all 0.0 because of the null values for each class in Table 4.
After building the pair-feature space, we make use of SVD to induce an approximation space. SVD is used to reduce the noise and compensate for the zero vectors in the model. We show that the formula is as follows:
M =UΣVT (2)
Here,M is the pair-feature matrix (dimensions: n×m),U is the pair matrix (dimensions: n×r),Σis a diagonal matrix of singular values (dimensions: r×r) andV is feature matrix (dimensions: m×r). nis the number of word pairs,mis the number of classes grouped by the word clustering method andr is rank ofM. IfM is of rankr, thenΣis also of rankr. We can redefine the valuekusing Formula 3 instead ofr.
M ∼Mˆ =UkΣkVkT (3)
3.3 Relational and attributional similarity
In our proposed framework, relational similarity can be measured by using the distributions over two word pairs. After building the new space Mˆ according to Formula 3, we measure relational similarity between word pairs such as “A:B” and “C:D” in a classical way by computing their cosine:
relsim( ˆMi,Mˆj) = ˆ Mi·Mˆj
||Mˆi|| × ||Mˆj||, ˆ
Mi =A:B, Mˆj =C:D. (4)
Here, i and j are word pairs indexes and ||Mˆi|| is the norm. It is usually thought that attributional similarity can be deduced from relational similarity (i.e., this means two-sideness).
For instance, Bollegala et al. (2012) showed how to measure the degree of synonymy between words using relational similarity. Their formula for measuring attributional similarity between words using relational similarity between word pairs is as follows:
attsim(A, B) = |T1|× ∑
(C,D)∈T
relsim(A:B, C :D) (5)
HereT is a set of synonymy word pair collected from WordNet and|T|is the cardinality of a set ofT. IfAandB are highly similar to that between synonymous words, this means thatAandB themselves must also be synonymous.
To test measures of attributional similarity between words, the Miller-Charles dataset (Miller and Charles, 1991) is commonly used. The data consist of 30 word pairs such as “gem:jewel”, all of them being nouns. The relatedness of each word pair has been rated by 38 human subjects, using a scale from 0 to 4. It should be said that the application of our proposed model to this task delivers results (0.28) which are far below the usually reported scores (around 0.87). This is explained by the fact that our model is not designed for attributional similarity, but aims directly at measuring relational similarity. The results indicate that the paradigmatic features are not useful to measure the attributional similarity between words in our proposed model. As a other method to measure the attributional similarity between words, point-wise mutual information is generally used.
4 Experiments and results
We perform two experiments on two datasets to prove the validity of our proposed model against the purpose it was designed for: the measure of relational similarity. In the two experiments, we make use of one corpus which contains about 150,000 sentences and about one million tokens. We set the latent size of Formula 3 to 40 to remove the noise in the matrices. The context window size is 2 for the paradigmatic features (prefixes and suffixes). The range of the syntagmatic feature (infixes) is from 1 to 5.
The first experiment shown in Section 4.1 directly outputs a measure of the relational similarity. The second experiment, on SAT analogy quizzes in Section 4.2 uses relational similarity to rank candidates. In both experiments, we do not preprocess with stemming and do not delete stop words.
4.1 Direct measure of relational similarity
To test our measure of relational similarity between word pairs, we make use of the SemEval-2012 task 2 (Jurgens et al., 2012). Jurgens et al. (2012) constructed a data set of prototypical ratings for 3,218 word pairs in 79 different relation categories with the help of Amazon Mechanical Turk2.
There are two phases for measuring the degree of relational similarity in this task. The first phase is to generate pairs of a given relation. We do not perform this phase here. Another phase is used to rate word pairs from given word pairs. This task selects least and most illustrative word pairs in four word pairs (“oak:tree”; “vegetable:carrot”; “tree:oak”; “currency:dollar”) based on several given word pairs (“flower:tulip”, “emotion:rage”, “poem:sonnet”). To rate word pairs, this task makes use of the MaxDiff technique (Louviere and Woodworth, 1991). The set with 79 word relations was randomly split into
training and testing sets. The training set contains 10 relations and the test set contains 69 relations. For each relation, about one hundred questions were created.
We present how to determine the least and most illustrative word pairs in the four word pairs. The formula for rating a word pairs is as follows:
score(A:B) =
∑
t∈T relsim(A:B, t)
|T| . (6)
Here, relsim is the same as shown in Section 3.3,T is a set of several given word pairs, and|T|is the number of given word pairs. The score indicates that the higher is the most illustrative and the lower is the least illustrative for the four word pairs. This formula rates a word pair from several given word pairs by using relational similarity since the relation between the given word pairs is proportional to a targeted word pair.
The results of our experiments are given in Table 6 along with the score of other models. The maxDiff
Algorithm Reference MaxDiff
SuperSim (Turney, 2013) 47.2
Com (Zhila et al., 2013) 45.2
RNN-1600 (Mikolov et al., 2013b) 41.8 UTD-NB (Rink and Harabagiu, 2012) 39.4
Ours 35.1
UTD-SVM (Rink and Harabagiu, 2012) 34.5
Table 6: The top five results with SemEval-2012 task 2, from the ACL wiki. MaxDiff is a measure which ranges from 0 to 100%, the higher the better.
score is 35.1 by using our proposed model. Comparing with other methods on the ACL wiki3in Table 6,
our method is lower, but is higher than UTD-SVM. We also detail the results for each category in Table 7. We obtained the highest maxDiff score for CLASS-INCLUSION category (the score is 43.8) and the
Category Random UTD-NB UTD-SVM Ours
CLASS-INCLUSION 31.0 37.6 31.6 43.8
PART-WHOLE 31.9 40.9 35.7 30.4
SIMILAR 31.5 39.8 34.7 34.6
CONTRAST 30.4 40.9 38.9 39.0
ATTRIBUTE 30.2 36.5 31.3 34.4
NON-ATTRIBUTE 28.9 36.8 34.5 34.0
CASE-RELATIONS 32.8 40.6 36.7 32.4
CAUSE-PURPOSE 30.8 36.3 33.3 30.5
SPACE-TIME 30.6 43.2 34.5 35.0
REFERENCE 35.1 41.2 34.2 35.1
[image:7.595.176.421.260.362.2]Average 31.2 39.4 34.5 35.1
Table 7: The MaxDiff scores for each category.
lowest score for PART-WHOLE category (the score is 30.4), but all the other scores are lower than UTD-NB. We consider that it is easy to capture the syntagmatic and paradigmatic associations in our proposed model for CLASS-INCLUSION category than for PART-WHOLE category. Our pair-feature matrices are influenced by paradigmatic features when word pairs do not co-occur in any similar context. For measuring relational similarity, we consider that syntagmatic and paradigmatic associations are sufficient in our model from this results.
4.2 SAT analogy quizzes
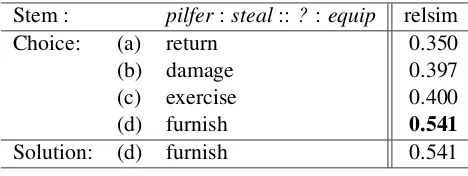
We use 400 SAT analogy quizzes from a set of 501 (Dermott, 2002). 101 SAT analogy quizzes were discarded as they concern named entities (e.g., Van Buren:8th :: Lincoln:16th ), symbolic or nota-tional variants (e.g., V:X ::L:C ), or the like, which are obviously out of the reach of our proposed model. The SAT analogy quizzes of Van Buren:8th::Lincoln:16th and V:X::L:C are domain-specific cases in that domain-domain-specific knowledge is needed to solve them. No domain-specific domain knowledge is needed to solve fish: fins:: bird: wings. We show an example of the resolution of a proportional analogy quiz in Table 8pilfer:steal::? :equiprandomly sampled from the 400 SAT analogy quizzes. Answering the quiz consists in selecting one solution among four candidates. To select one candidate
Stem : pilfer:steal::? :equip relsim
Choice: (a) return 0.350
(b) damage 0.397
(c) exercise 0.400
(d) furnish 0.541
Solution: (d) furnish 0.541
Table 8: An example of a SAT analogy quiz.
out of the four, we rank them using the relational similarity of the candidate with the fourth word in the quiz. The rank is computed using Formula 4. As an example, in Table 8, we give the degree of relational similarity for the previous quiz. The selected answer is furnish, and the semantic relation between the word pairs is synonymy.
The results on 400 SAT analogy quizzes are given in Table 9 along with the accuracy of other methods. We obtain the highest score with our proposed model against another model, Word2vec (Mikolov et al.,
Algorithm Reference Accuracy
Random 0.22
Word2vec (Mikolov et al., 2013a) 0.20
[image:8.595.181.415.205.293.2]Ours 0.27
Table 9: The evaluations comparing with other methods.
2013a)4, and a baseline model that draws a solution at random. It should be noticed that, here, word
pairs do not involve only noun to noun pairs but also involve noun to verb pairs. Our model is effective in answering the proportional analogy quizzes by using syntagmatic and paradigmatic associations from a small corpus. It achieves this by using a training corpus of about 10 megabytes in size to build a pair-feature vector space. By contrast, Word2vec requires 100 megabytes of training corpus and fails at building a word space which is precise enough, to beat random selection. This clearly shows that clustering of words can make up for size of corpus and we can acquire the better accuracy.
The SAT analogy quizzes and the SemEval-2012 task 2 are separate tasks. To assess the quality of proportional analogies two aspects are needed: vertical and horizontal dimensions. On the an example fish: fins:: bird: wings, the vertical dimension is between “fish:bird” and “fins:wings” and the hori-zontal dimension is between “fish:fins” and “bird:wings”. In all generality, we should examine the score function of proportional analogies on both vertical and horizontal dimensions but practically the vertical dimension is not so important in SAT analogies quizzes.
5 Conclusion
Attributional similarity and relational similarity are usually distinguished in the study of semantic simi-larity. Many researchers proposed to build a various of vector space models to measure the attributional
similarity between words or the relational similarity between word pairs. Such similarities are commonly used to solve semantic problems on words, phrase or sentences in the NLP literature.
In this paper, we presented a pair-feature matrix model with syntagmatic and paradigmatic associations for measuring relational similarity. By using a sentence containing a word pair is divided into three parts, we represented the syntagmatic and paradigmatic associations for each word pair. We made use of a word clustering method to cope with data sparseness in a preprocessing step. We performed two experiments with different datasets: SemEval-2012 task 2, and SAT analogy quizzes. These experiments show that the pair-feature matrix model with syntagmatic and paradigmatic associations is effective to measure relational similarity. In future work, we propose to make use of stemming and to delete stop words to reduce even more the noise that affects decrease the performance of the word clustering step we introduced to deal with data sparseness.
References
Danushka Bollegala, Yutaka Matsuo, and Mitsuru Ishizuka. 2012. Measuring the degree of synonymy between
words using relational similarity between word pairs as a proxy. IEICE Transactions on Information and
Sys-tems, 95(8):2116–2123.
Brigit Dermott. 2002. 501 Word Analogy Questions. Learning Express.
Dedre Gentner. 1983. Structure-mapping: A theoretical framework for analogy.Cognitive Science, 7(2):155–170.
Zellig S. Harris. 1954. Distributional structure. Word, 10:146–162.
Marti A. Hearst. 1992. Automatic acquisition of hyponyms from large text corpora. InProceedings of
COLING-92, volume 2, pages 539–545. Association for Computational Linguistics.
Michael N. Jones and Douglas J.K. Mewhort. 2007. Representing word meaning and order information in a
composite holographic lexicon.Psychological Review, 114(1):1–37.
David A. Jurgens, Peter D. Turney, Saif M. Mohammad, and Keith J. Holyoak. 2012. Semeval-2012 task 2: Mea-suring degrees of relational similarity. InProceedings of the First Joint Conference on Lexical and Computa-tional Semantics-Volume 1: Proceedings of the main conference and the shared task, and Volume 2: Proceedings of the Sixth International Workshop on Semantic Evaluation, pages 356–364. Association for Computational Linguistics.
Thomas K. Landauer and Susan T. Dumais. 1997. A solution to plato’s problem: The latent semantic analysis theory of acquisition, induction, and representation of knowledge.Psychological Review, 104(2):211–240. Jordan J. Louviere and G.G. Woodworth. 1991. Best-worst scaling: A model for the largest difference judgments.
Technical report, Technical Report, University of Alberta.
Kevin Lund and Curt Burgess. 1996. Producing high-dimensional semantic spaces from lexical co-occurrence.
Behavior Research Methods, Instruments, & Computers, 28(2):203–208.
Tomas Mikolov, Kai Chen, Greg Corrado, and Jeffrey Dean. 2013a. Efficient estimation of word representations in vector space. InProceedings of Workshop at International Conference on Learning Representations. Tomas Mikolov, Wen-tau Yih, and Geoffrey Zweig. 2013b. Linguistic regularities in continuous space word
representations. InProceedings of NAACL/HLT, pages 746–751. Citeseer.
George A. Miller and Walter G. Charles. 1991. Contextual correlates of semantic similarity. Language and
Cognitive Processes, 6(1):1–28.
George A. Miller. 1995. Wordnet: a lexical database for english. Communications of the Association for
Comput-ing Machinery, 38(11):39–41.
Franz Josef Och. 1999. An efficient method for determining bilingual word classes. InProceedings of EACL,
pages 71–76. Association for Computational Linguistics.
Gerard Salton, Anita Wong, and Chung-Shu Yang. 1975. A vector space model for automatic indexing. Commu-nications of the Association for Computing Machinery, 18(11):613–620.
Rion Snow, Daniel Jurafsky, and Andrew Y. Ng. 2004. Learning syntactic patterns for automatic hypernym discovery.Advances in Neural Information Processing Systems.
Fabian M. Suchanek, Gjergji Kasneci, and Gerhard Weikum. 2007. Yago: a core of semantic knowledge. In
Proceedings of WWW, pages 697–706. ACM.
Peter D. Turney and Michael L. Littman. 2005. Corpus-based learning of analogies and semantic relations.
Machine Learning, 60(1-3):251–278.
Peter D. Turney and Patrick Pantel. 2010. From frequency to meaning: Vector space models of semantics.Journal
of Artificial Intelligence Research, 37(1):141–188.
Peter D. Turney. 2005. Measuring semantic similarity by latent relational analysis. InProceedings of IJCAI, pages 1136–1141.
Peter D. Turney. 2006. Similarity of semantic relations.Computational Linguistics, 32(3):379–416.
Peter D. Turney. 2008. The latent relation mapping engine: Algorithm and experiments. Journal of Artificial
Intelligence Research, 33(1):615–655.
Peter D. Turney. 2013. Distributional semantics beyond words: Supervised learning of analogy and paraphrase. InTransactions of the Association for Computational Linguistics, volume 1, pages 353–366. Association for Computational Linguistics.
Alisa Zhila, Wen-tau Yih, Christopher Meek, Geoffrey Zweig, and Tomas Mikolov. 2013. Combining