On the Nominal Interest rate Yield
Response to Net Government Borrowing
in the U.S.: An Empirical Analysis with
Robustness Tests
Alexander, Gigi and Foley, Maggie
Jacksonville University, Jacksonville University
11 June 2014
Online at
https://mpra.ub.uni-muenchen.de/56968/
On the Nominal Interest Rate Yield Response to Net Government Borrowing in the U.S.: An Empirical Analysis with Robustness Tests
Gigi Alexander & Maggie Foley
Abstract.
This study provides current empirical evidence on the impact of net U.S. government borrowing (budget deficits) on the nominal interest rate yield on ten-year Treasury notes. The model includes an
ex ante real short-term real interest rate yield, an ex ante real long-term interest rate yield, the monetary base as a percent of GDP, expected future inflation, the percentage growth rate of real GDP, net financial capital inflows, and other variables. This study uses annual data and then uses quarterly data for the periods 1971-2008 and 1971-2012. Autoregressive two-stage least squares estimates imply that the federal budget deficit, expressed as a percent of GDP, exercises a positive and statistically significant impact on the nominal interest rate yield on ten-year Treasury notes. Robustness tests are provided in an Appendix.
Keywords nominal interest rate; ten-year U.S. Treasury note yield; budget deficits
JEL Classification codes E43, E52, E62
1 Introduction
The interest rate impact of central government budget deficits has been studied extensively.
Studies of this topic have assumed a wide variety of models, techniques, and study periods (Al-Saji,
1992, 1993; Barth, Iden and Russek, 1984, 1985, 1986; Barth, Iden, Russek, and Wohar, 1989;
Cebula, 1997B, 2005; Cebula and Cuellar, 2010; Cukierman and Meltzer, 1989; Feldstein and
Eckstein, 1970; Findlay, 1990; Gale and Orszag, 2003; Hoelscher, 1983, 1986; Holloway, 1988;
Johnson, 1992; Kiani, 2009; Ostrosky, 1990; Tanzi, 1985; Zahid, 1988). Many of these studies find
that budget deficits raise longer-term rates of interest while not significantly affecting short-term, i.e.,
under one year from issuance to date of maturity, rates of interest. Since capital formation is
presumably much more affected by longer-term than by short-term interest rates, the inference has
1975; Cebula, 1985).
This interest rate/deficit literature has focused typically upon the yields on U.S. Treasury bills,
U.S, Treasury notes, and U.S. Treasury bonds, as well as yields on Moody’s Aaa-rated and Baa-rated
corporate bonds. The yield on tax-free bonds has been examined, arguably in part because of its
potential impact on income tax evasion (Cebula, 1997A, 2004). In recent years, however, the impact
of budget deficits on interest rate yields has received very only limited attention in the scholarly
literature. Accordingly, this study provides current evidence as to the effect of the federal budget
deficit on the yield on intermediate-term debt issues of the U.S. Treasury, namely, the nominal
interest rate yield on ten-year Treasury notes.
In particular, first using annual and then using quarterly data, this study investigates two
periods, 1971 through 2008, and 1971 through 2012, in the pursuit of providing contemporary
insights into whether federal budget deficits have in fact elevated intermediate-term interest rate
yields in the U.S. We begin with 1971 because in August of 1971 the U.S. abandoned the Bretton
Woods agreement, i.e., abandoned the convertibility of the U.S. dollar for gold, thereby bringing the
Bretton Woods system to a de facto end (Cebula, 1997B). Ending the first study period with 2008
makes this study relatively current and hence pertinent. Moreover, ending the first study with the year
2008 can be regarded as appropriate if for no other reason because it was only in late November of
2008 that the Federal Reserve shifted from its traditional open market operations and initiated its
significant and unprecedented Federal Reserve purchases of mortgage-backed securities, which by
June, 2010 had totaled $2.1 trillion. In November of 2010, another stage of quantitative easing, QE
(2), began and resulted in $600 billion of such purchases. Finally, beginning in September of 2012,
stage QE (3) began, initially involving $40 billion per month of such purchases and escalating to $85
billion per month thereof as of December, 2012. Thus, the second study period includes not only the
entire initial study period but also four full years during which the U.S. economy experienced both
quantitative easing and huge (relative to GDP) federal budget deficits. By separately estimating the
model for (and examining the findings for) these two study periods, we can engage in at least some
degree of isolation of the quantitative easing policies and their possible effects (along with the large
federal budget deficits that accompanied these new monetary policies) to provide at least preliminary
insights into the following question: “What has been the impact of budget deficits on
intermediate-term interest rates in the U.S. over the last 40 years?”
Section 2 of this study provides the basic framework for the empirical analysis, an
open-economy loanable funds model reflecting dimensions of the works of Barth, Iden and Russek
(1984; 1985; 1986), Barth, Iden, Russek, and Wohar (1989), Hoelscher (1986), Koch (1994), Cebula
(2005), Cebula and Cuellar (2010), and others. Section 3 defines the specific variables in the
empirical model and describes the data initially used, which is annual. Section 4 provides the
empirical results of autoregressive, two stage least squares estimations using annual data for the
two stage least squares estimations of the basic model (using quarterly data and a different measure
of expected future inflation variable) for the periods 1971.1-2008.4 and 1971.1-2012.4. An overview
of the study findings can be found in Section 6. ARCH (Autoregressive Conditional
Heterskedasticity) estimates are provided in the Appendix as robustness tests.
2 The Model
In developing the underlying framework for the empirical analysis, we first consider the following
inter-temporal government budget constraint:
NDt+1 = NDt + Gt + Ft + ARtNDt - Tt (1)
where:
NDt+1 = the national debt in period t+1
NDt = the national debt in period t
Gt = government purchases in period t
Ft = government non-interest transfer payments in period t
ARt = average effective interest rate on the national debt in period t
Tt = government tax and other revenues in period t
The total government budget deficit in period t (TDt), which is the deficit measured considered in this
study, is simply the difference between NDt+1 and NDt:
TDt = NDt+1 - NDt = Gt + Ft + ARtNDt - Tt (2)
Wohar (1989), and Hoelscher (1986), as well as Koch (1994), Cebula (1997; 2005), and Cebula and
Cuellar (2010), this study seeks to identify determinants of the nominal interest rate yield on ten-year
U.S. Treasury notes, including the impact of the federal budget deficit on same. To do so, a loanable
funds model is adopted in which the nominal intermediate-term (in this study, ten-year) interest rate
yield is, assuming all other bond markets are in equilibrium, determined by an equilibrium of the
following form:
D + MY = TDY - NCIY (3)
where:
D = private domestic demand for ten-year U.S. Treasury notes
MY = the monetary base, expressed as a percent of real GDP, adopted as a measure of the
available potential domestic money supply
TDY = net government borrowing, measured by the federal budget deficit (as above),
expressed as a percent of real GDP
NCIY = net financial capital inflows, expressed as a percent of real GDP
In this framework, it is hypothesized that:
D = D (RTEN, Y, EARSTBR, EARLTBR, PE),
DRTEN > 0, DY > 0, DEARSTBR < 0, DEARLTBR < 0, DPE < 0 (4)
where:
Y = the percentage growth rate of real GDP
EARSTBR = the ex ante real interest rate yield on high quality (and hence close-substitute)
short-term bonds
EARLTBR = the ex ante real interest rate yield on high quality (and hence close-substitute) long-term
bonds
PE = the currently expected percentage future inflation rate, i.e., for the upcoming period
Following the conventional wisdom, it is expected that the demand for ten-year Treasury
notes is an increasing function of the yield on those notes, RTEN (Barth, Iden, and Russek, 1984;
1985; 1986; Hoelscher, 1986; Koch, 1994; Cebula and Cuellar, 2010). Next, it is hypothesized that
the greater the percent growth rate of real GDP (Y), the higher the demand for ten-year Treasury notes,
ceteris paribus, since such a circumstance more rapidly increases the potential pool of funds
available for purchasing those notes (Hoelscher, 1986; Cebula, 2005). It is further hypothesized that,
paralleling Barth, Iden, and Russek (1984; 1985), Cebula (1997B; 2005), Hoelscher (1986), and
Koch (1994), the real domestic demand for ten-year Treasury notes is a decreasing function of the ex
ante real short-term rate, which in this case is the ex ante real three-month Treasury bill rate. In other
words, as EARSTBR increases, ceteris paribus, bond demanders/buyers at the margin substitute
shorter-term issues for longer-term issues in their portfolios. Similarly, it is hypothesized that, in
principle paralleling Barth, Iden, and Russek (1984; 1985), Cebula (1997B; 2005), and Hoelscher
high quality long-term interest rate yields, in this case represented by the ex ante real interest rate
yield on Moody’s Aaa-rated corporate bonds (EARLTBR), ceteris paribus. Finally, according to the
conventional wisdom, the private demand for intermediate-term bonds, such as ten-year Treasury
notes, is a decreasing function of expected inflation (PE), ceteris paribus (Barth, Iden, and Russek,
1984; 1985; 1986; Hoelscher, 1983; 1986; Ostrosky, 1990; Koch (1994); Gissey (1999); Cebula,
2005; Kiani, 2009; Cebula and Cuellar, 2010).
Substituting equation (4) into equation (3) and solving for RTEN yields:
RTEN = f (TDY, MY, EARSTBR, EARLTBR, Y, PE, NCIY) (5)
where it is hypothesized that:
fTDY > 0, fMY < 0 fEARSTBR > 0, fEARLTBR > 0, fY > 0, fPE > 0, fNCIY < 0 (6)
The first of these expected signs is positive to reflect the conventional wisdom that when the
government attempts to finance a budget deficit, it forces interest rate yields upwards as it competes
with the private sector to attract funds from the financial markets, ceteris paribus. The expected sign
on the money supply variable (MY) is negative because the greater the available money supply
relative to GDP, the greater the offset to debt issues, i.e., greater money supply availability
presumably helps to offset interest rate effects of budget deficits, ceteris paribus. It is noteworthy that
the empirical results are effectively identical if the M2 measure of the money supply as a percentage
of GDP is adopted in place of MY; nevertheless, the MY variable is adopted because it more directly
because the greater the ratio of net capital inflows to GDP, the greater the extent to which these funds
absorb domestic debt (Koch, 1994; Cebula and Belton, 1993; Cebula and Cuellar, 2010). The
introduction of this variable into the model acknowledges the nature of the global economy and
global financial markets. Finally, the expected signs on fEARSTBR, fEARLTBR, fY, and fPE follow logically
from equation (4).
3 Specification of the Variables
Given the presence of the expected inflation rate and two ex ante real interest rates as explanatory
variables in the model, the first step in the analysis is to develop a useful empirical measurement of
expected inflation. Indeed, this first step is necessary to the measurement of the variables EARSTBR,
EARLTBR, and PE. The measurement of this variable is described by equation (7) below for the case
of annual data; estimates based thereupon are provided in section 4 of this study. Section 5 of this
study estimates the same basic model but it adopts a different measure of expected inflation (PE) and
hence differently measured values for EARSTBR and EARLTBR as well.
Proceeding, one possible way to measure expected inflation is to adopt the well-known
Livingston survey data. However, as observed by Swamy, Kolluri, and Singamsetti (1990, p. 1013),
there may be serious problems with the Livingston series:
Accordingly, rather than using the Livingston series, the study adopts, for the estimates using annual
data, a linear-weighted-average (LWA) specification involving actual current and past inflation (of
the overall consumer price index, CPI) to construct the values for the expected (future) inflation rate
in each period t, PEt+1t. In particular, to construct the values for the current year’s (year t’s) expected
future (i.e., for next year, year t+1) inflation, the following approach is adopted (Cebula, 1992;
Al-Saji, 1992; 1993; Koch, 1994):
PEt+1t = (3PAt + 2PAt-1 + PAt-2)/6 (7)
where:
PAt = the actual percentage inflation rate in the current year (t);
PAt-1 = the actual inflation rate in the previous year (t-1); and
PAt-2 = the actual inflation rate in year t-2.
Clearly, this construct weights current inflation more heavily that previous period inflation in
quantifying the inflationary expectation for the subsequent period. Given this measurement of
expected future inflation, in the annual data model, variable EARSTBRt = the nominal interest rate
yield on three-month Treasury bills in year t minus PEt+1t , while variable EARLTBRt = the nominal
interest rate yield on Moody’s Aaa-rated long-term corporate bonds in year t minus PEt+1t.
Interestingly, before proceeding, despite its technical limitations, it is observed that adoption of the
Livingston series in place of the formulation in equation (7) yields nearly identical results and the
In any case, based upon the framework expressed above, the autoregressive, two stage least
squares (2SLS) estimation initially involves the following linear model:
RTENt = α0 + α1 TDYt+ α2 MYt+ α3 EARSTBRt+ α4 EARLTBRt + α5 Yt-1 + α6 PEt+1t
+ α7 NCIYt-1 + α8 AR(1) + ut (8)
where:
RTENt = the nominal average interest rate yield on ten-year U.S. Treasury notes in year t, expressed
as a percent per annum;
α0 = the constant term;
TDYt = the ratio of the nominal federal budget deficit in year t to the nominal GDP in year t,
expressed as a percent;
MYt = the ratio of the monetary base in year t to the nominal GDP in year t, expressed as a percent;
EARSTBRt = the ex ante real average interest rate yield on three-month Treasury bills in year t,
expressed as a percent annum;
EARLTBR = the ex ante real average interest rate yield on Moody’s Aaa-rated long-term corporate
bonds in year t, expressed as a percent per annum;
Yt-1 = the percentage growth rate of real GDP in year t-1;
PEt+1t = the expected future inflation rate of the CPI, i.e., for year t+1, as formulated in year t,
expressed as a percent per annum;
the GDP in year t-1;
AR(1) = autoregressive term; and
ut = the stochastic error term.
The budget deficit is scaled by GDP, as are the monetary base and net capital inflows; this is
because the sizes of the budget deficit, the monetary base, and net capital flows should be judged
relative to the size of the economy (Hoelscher, 1986; Cebula, 1997B; 2005; Holloway, 1986;
Ostrosky, 1990). The dependent variable in this system, RTENt, is expressed as contemporaneous
with the budget deficit variable (TDYt), as well as with the monetary base variable (MYt), the
expected future inflation variable (PEt+1t), the ex ante real three-month Treasury bill interest rate yield
variable (EARSTBRt), and the ex ante real interest rate yield on Moody’s Aaa-rated long-term
corporate bonds variable (EARLTBRt). Given that the data are annual and given the fact that
financial markets are quick-acting markets, such contemporaneous specifications are not uncommon
in this literature (Hoelscher, 1986; Ostrosky, 1990; Koch, 1994; Cebula, 1997B; 2005; Cebula and
Cuellar, 2010).
Given the contemporaneous components of the specification in equation (8), the possibility
of simultaneity bias naturally arises, which in turn mandates the choosing of instrumental variables
for each of the five right-hand side variables in question. The five instruments chosen were, as
follows: the two-year lag of the annual civilian unemployment rate (URt-2) for TDYt; the three-year
Baa-rated corporate bond interest rate yield (Baat-2) for MYt; the two-year lag of the nominal
six-month Treasury bill interest rate yield (SIXt-2) for EARSTBRt; and the two-year lag of the
nominal average interest rate yield on new fixed-rate 30 year mortgages (MORTt-2) for variable
EARLTBRt. The choice of instruments for these variables was based on the fact that in each case, the
lagged instrument was highly correlated with the explanatory variable in question whereas the
instruments in question were uncorrelated with the error terms in the system.
The real GDP growth rate variable, Yt-1, and the net capital inflow variable, NCIYt-1, are both
lagged one period in order to avoid multicollinearity problems. The data for all of the variables in this
analysis were obtained from the Council of Economic Advisors (2013, Tables B-1, B-2, B-35, B-42,
B-64, B-71, B-73, B-79). For the interested reader, descriptive statistics for each of the variables
expressed in equation (8) are provided in Table 1 for the both the 1971-2008 and 1971-2012 study
periods. Finally, group unit-root testing reveals the variables in the model are stationary in levels.
4 Estimation Results with Annual Data: 1971-2008 and 1971-2012
In this section, empirical results are presented using annual data for two periods, 1971-2008 and
1971-2012. Estimations of the same model (using quarterly rather than annual data), except for a
re-specified inflationary expectations variable and hence for re-specified EARSTBR and EARLTBR
variables as well, are provided in section 5 of this study.
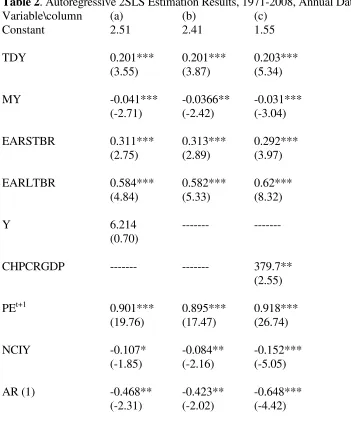
The 1971-2008 Period with Annual Data
in parentheses are t-values. In column (a) of Table 1, all seven of the estimated coefficients on the
explanatory variables exhibit the expected signs, with five of these seven coefficients being
statistically significant at the 1% level, one being statistically significant at the 5% level, and one
being statistically significant at the 10% level; only the coefficient on the Yt-1 variable fails to be
statistically significant at the 10% level. Furthermore, as shown in Table 3, there is no indication of
an autocorrelation problem.
In this estimate, the estimated coefficient on the monetary base (de facto available money
supply) variable, MYt, is negative, as expected, and statistically significant at the 1% level, implying
that a higher ratio of the monetary base relative to GDP acts to reduce the nominal interest rate yield
on ten-year U.S. Treasury notes. The estimated coefficient on the ex ante real short-term interest rate
variable, EARSTBRt, is positive, as hypothesized, and statistically significant at the 1% level,
implying that the higher the ex ante real interest rate yield on three-month Treasury bills, the higher
the nominal interest rate yield on ten-year notes. This finding presumably reflects competition
between the ten-year Treasury note and counterpart short-term financial instruments. Similarly, the
coefficient on the variable EARLTBRt is also positive, as hypothesized, and statistically significant
at the 1% level, implying that the higher the ex ante real interest rate on long-term Moody’s Aaa-rated
corporate bonds, the higher the level of the nominal interest rate yield on ten-year Treasury notes,
presumably because of competition between ten-year Treasury notes and long-term financial
expected (conventional wisdom), and statistically significant at the 1% level, implying that the higher
the expected future inflation rate, the greater the nominal interest rate yield on ten-year Treasury
bonds. Next, the estimated coefficient on the net capital inflows variable, NCIYt-1, is negative, as
expected and statistically significant at the 8% level, implying (albeit un-compellingly in this estimate)
that such capital flows may act to absorb domestic debt and reduce the interest rate on that debt, i.e.,
on ten-year Treasury notes, in this case.
Finally, the estimated coefficient on the budget deficit variable is positive and statistically
significant at the 1% level. Thus, it appears that after allowing for a variety of other factors, the higher
the federal budget deficit (as a percent of GDP) the higher the nominal interest rate yield on
intermediate-term, i.e., in this case, on ten-year U.S. Treasury notes. This finding is consistent with
a variety of empirical studies of earlier periods, including Al-Saji (1992, 1993), Barth, Iden and
Russek (1984, 1985, 1988), Barth, Iden, Russek, and Wohar (1989), Cebula (1997B), Cebula and
Belton (1993), Cebula and Cuellar (2010), Findlay (1990), Gale and Orszag (2003), Gissey (1999),
Hoelscher (1986), Johnson (1992), Kiani (2009), Tanzi (1985), and Zahid (1988).
To demonstrate the resiliency of these results showing that (among other things), in the U.S.,
federal budget deficits have exercised a positive impact on intermediate-term interest rates, we
initially undertake two modestly different additional autoregressive 2SLS estimates. The first of these
estimates is shown in column (b) of Table 2. In this estimate, the statistically insignificant variable
coefficients exhibit the expected signs, with four of the six statistically significant at the 1% level and
two statistically significant at the 5% level or beyond.
According to these results, the nominal interest rate yield on ten-year Treasury notes is a
decreasing function of the monetary base as a percent of GDP (at the 2.5% statistical significance
level) and the net capital inflows variable (at the 4% statistical significance level), while being an
increasing function of expected inflation (at the 1% statistical significance level), the ex ante real
three-month Treasury bill rate (at the 1% statistical significance level), and the ex ante real long-term
interest rate yield on Moody’s Aaa-rated corporate bonds (at the 1% statistical significance level).
Clearly, these results are entirely consistent with those for the ten-year U.S. Treasury note yield found
in column (a) of Table 2. Moreover, once again, the federal budget deficit, expressed as a percent of
GDP, exercises a positive and statistically significant (at the 1% statistical significance level) impact
on the nominal ten-year Treasury note yield.
In another demonstration of the resiliency of the basic model and its fundamental findings,
we replace the variable Yt-1 with the variable CHPCRGDP, defined here as the change in per capita
real GDP between the previous year (t-1) and the current year (t). This specification actually more
closely follows that in Hoelscher (1986) than does the adopted initial variable, Yt-1, the percentage
change in per capita real GDP in year t-1. In any case, in column (c) of Table 2, the autoregressive,
2SLS estimate of the basic model with this substitution is provided.
with six being statistically significant at the 1% level and one being statistically significant at the 2%
level. Thus, this estimation implies that the nominal interest rate yield on ten-year U.S. Treasury notes
is a decreasing function of the monetary base as a percent of GDP (at the 1% statistical significance
level) and the net capital inflows variable (at the 1% statistical significance level), while being an
increasing function of expected inflation (at the 1% statistical significance level), the ex ante real
three-month Treasury bill rate (at the 1% statistical significance level), the ex ante real long-term
interest rate yield on Moody’s Aaa-rated corporate bonds (at the 1% statistical significance level), the
change in per capita real GDP (at the 2% statistical significance level), and-finally-the federal budget
deficit as a percent of GDP (at the 1% statistical significance level). Clearly, these results are
consistent with those for the ten-year U.S. Treasury note yield found in column (a) of Table 2.
In closing this sub-section of the study, it is noted that the basic model yields consistent
results for variations of the basic model. Indeed, the specification shown in column (c) of Table 2 may
yield the most robust results of all. In any event, the evidence would seem to clearly indicate that,
among other things, the federal budget deficit in the U.S. exercised a positive and statistically
significant impact upon the nominal ten-year Treasury note interest rate yield over the 1971-2008
study period. The following sub-section of this study investigates empirically whether this conclusion
is reached for the longer period ending at the end of year 2012, during which quantitative easing as
well as huge federal budget deficits (relative to GDP) were experienced in the U.S.
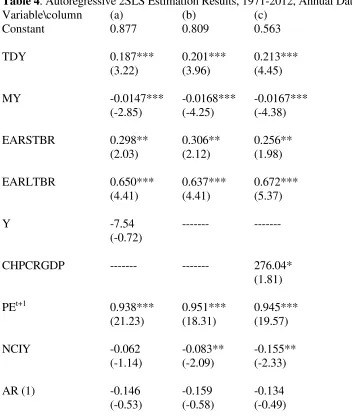
In this sub-section of the study, we empirically investigate the impact of federal budget deficits over
the 1971-2012 study period, a period in which (beginning in November, 2008) the Federal Reserve
pursued a new policy initiative, i.e., quantitative easing, as briefly described in the Introduction to this
study. In addition, the years 2009-2012 were periods of unusually high federal budget deficits relative
to GDP (10.1%, 9.0%, 8.7%, and 7.8% for FY 2009, FY2010, FY2011, and FY 2012, respectively).
In any case, the autoregressive 2SLS estimate of equation (8) for 1971-2012 is provided in column (a)
of Table 4. In column (a) of Table 4, all seven of the estimated coefficients on the explanatory
variables exhibit the expected signs, with four of these coefficients being statistically significant at
the 1% level and one being statistically significant at the 5% level; the coefficients on the Yt-1 and
NCIYt-1 variables fail to be statistically significant at the 10% level. Once again, group unit-root
testing reveals the variables in the model are stationary in levels. Finally, there is no indication of a
multicollinearity problem with the model for the study period.
In this estimate for the 1971-2012 study period, the estimated coefficient on the monetary
base (de facto available money supply) variable, MYt, is negative and statistically significant at the
1% level, implying that a higher ratio of the monetary base relative to GDP acts to reduce the nominal
interest rate yield on ten-year U.S. Treasury notes. The estimated coefficient on the ex ante real
short-term interest rate variable, EARSTBRt, is positive, as expected, and statistically significant at
the 5% level, implying that the higher the ex ante real interest rate yield on three-month Treasury bills,
hypothesized relationship proffered in this study and presumably reflects competition between the
ten-year Treasury note and shorter-term financial instruments. The coefficient on the variable
EARLTBRt is also positive and statistically significant at the 1% level, implying that the higher the
ex ante real interest rate on long-term Moody’s Aaa-rated corporate bonds, the higher the level of
nominal interest rate yield on ten-year Treasury notes, presumably also because of competition, in
this case, between ten-year Treasury notes and longer-term financial instruments. The estimated
coefficient on the expected inflation variable, PEt+1t, is also positive, as expected, and statistically
significant at the 1% level, implying that the higher the expected inflation rate, the greater the
nominal interest rate yield on ten-year Treasury notes.
Finally, the estimated coefficient on the budget deficit variable for the 1971-2012 study
period is positive and statistically significant at the 1% level, with effectively the same size
coefficient as was obtained for the 1971-2008 study period. Thus, it appears that after allowing for a
variety of other factors, the higher the federal budget deficit (as a percent of GDP) the higher the
nominal interest rate yield on intermediate-term, i.e., in this case, on ten-year U.S. Treasury notes.
This finding for the period ending with 2012 is consistent not only with the results in columns (a), (b),
and (c) of Table 2, but also with a host of empirical studies of earlier periods, including Al-Saji (1992,
1993), Barth, Iden and Russek (1984, 1985, 1988), Barth, Iden, Russek, and Wohar (1989), Cebula
(1997B), Cebula and Belton (1993), Cebula and Cuellar (2010), Findlay (1990), Gale and Orszag
and Zahid (1988).
Paralleling the procedure undertaken for Table 2 of this study for the 1971-2008 period, in
order to demonstrate the resilience of the findings in column (a) of Table 4 showing that (among other
things), in the U.S., federal budget deficits exercised a positive impact on intermediate-term interest
rates for the 1971-2012 period, we provide two additional autoregressive 2SLS estimates. The first
of these autoregressive 2SLS estimates is shown in column (b) of Table 4. In this estimate, the
variable Yt-1 has been deleted from the basic model. As shown in column (b), all six of the estimated
coefficients exhibit the expected signs, with four of the six statistically significant at the 1% level and
two statistically significant at the 5% level.
Thus, according to these particular results, the nominal interest rate yield on ten-year Treasury
notes is a decreasing function of the monetary base as a percent of GDP (at the 1% statistical
significance level) and the net capital inflows variable (at the 5% statistical significance level), while
being an increasing function of expected inflation (at the 1% statistical significance level), the ex ante
real three-month Treasury bill rate (at the 5% statistical significance level), the ex ante real long-term
interest rate yield on Moody’s Aaa-rated corporate bonds (at the 1% statistical significance level), and
the federal government budget deficit as a percent of GDP (at the 1% statistical significance level).
Overall, these results are consistent with those for the ten-year U.S. Treasury note yield found in all
three columns of Table 2 as well as column (a) of Table 4. Clearly, once again, the federal budget
ten-year Treasury note yield.
In the second investigation of the basic model and its fundamental findings for the period
1971-2012, we replace the variable Yt-1 with the variable CHPCRGDP, defined here as above,
namely, as the change in per capita real GDP between the previous year (t-1) and the current year (t).
As observed earlier in this study, this specification actually more closely follows that in Hoelscher
(1986) than does the adoption of our initial variable, Yt-1. In any case, in column (c) of Table 4, the
autoregressive, 2SLS estimate of the basic model with this substitution made is provided.
In column (c) of this Table, all seven of the estimated coefficients exhibit the hypothesized
signs, with four being statistically significant at the 1% level, two statistically significant at the 5%
level, and one statistically significant at the 8% level. Thus, this estimation implies that the nominal
interest rate yield on ten-year U.S. Treasury notes is a decreasing function of the monetary base as a
percent of GDP and the net capital inflows variable, while being an increasing function of expected
inflation, the ex ante real three-month Treasury bill rate, the ex ante real long-term interest rate yield
on Moody’s Aaa-rated corporate bonds, the change in per capita real GDP, and-finally-the federal
budget deficit as a percent of GDP. Clearly, overall, these results are consistent with those for the
nominal ten-year U.S. Treasury note yield found in columns (a), (b), and (c) of Table 2 and columns
(a) and (b) of Table 4. In other words, the federal budget deficit, expressed as a percent of GDP, is
once again found to exercise a positive impact on the nominal ten-year Treasury note yield.
statistical significance (1%) but also in terms of a relatively stable/uniform coefficient size. Thus, this
study finds consistent evidence of the impact of the budget deficit. Indeed, it appears that for every
1% increase in the size of the budget deficit (as a percent of GDP), the nominal interest rate yield rises
approximately 20 basis points.
5 Estimates Using Quarterly Data: 1971.3-2008.4 and 1971.3-2012.4
In this section of the study, we re-estimate the model using quarterly data. To do so, however, we
must first develop a reasonable measure of expected future inflation based on quarterly data.
Following Swamy, Kolluri, and Singamsetti (1990), this study adopts a distributed lag model on
actual inflation to construct values for expected future inflation in quarter t. In particular, to construct
values for PEt+1t, where subscript t is now quarter t, a four-quarter distributed lag of actual inflation
(measured by the annualized percent change of the CPI, 2000=100.00) was used. With PEt+1t thus
newly defined /measured for quarter t, the variable EARSTBRt = the nominal interest rate yield on
three-month Treasury bills in quarter t minus PEt+1t , while variable EARLTBRt = the nominal interest
rate yield on Moody’s Aaa-rated long-term corporate bonds in quarter t minus PEt+1t.
Given the contemporaneous components of the specification in equation (8), the possibility
of simultaneity naturally arises, which in turn mandates the choosing of instrumental variables for
each of the five right-hand side variables in question. Given the four-quarter distributed lag construct
of the expected inflation variable, the five instruments chosen were, as follows: the five-quarter lag
inflation rate of the CPI (PAt-5) for PEt+1t ; the five-quarter lag of the Moody’s Baa-rated corporate
bond interest rate yield (Baat-5) for MYt; the five-quarter lag of the nominal six-month Treasury bill
interest rate yield (SIXt-5) for EARSTBRt; and the five-quarter lag of the nominal average interest rate
yield on new fixed-rate 30 year mortgages (MORTt-5) for variable EARLTBRt. The choice of
instruments for these variables was based on the fact that in each case, the lagged instrument was
highly correlated with the explanatory variable in question whereas the instruments in question were
uncorrelated with the error terms in the system. Meanwhile, the real GDP growth rate variable, Yt-1,
and the net capital inflow variable, NCIYt-1, are once again both lagged one period in order to avoid
multicollinearity problems. The quarterly data were obtained from the Council of Economic Advisors
(2013, Tables B-1, B-2, B-35, B-42, B-64, B-71, B-73, B-79) and from earlier editions of this
publication (The Economic Report of the President) for the years 1975, 1978; 1981, 1984, 1987, 1990,
1993, 1996, 1999, 2001, 2004, 2007, and 2010, respectfully.
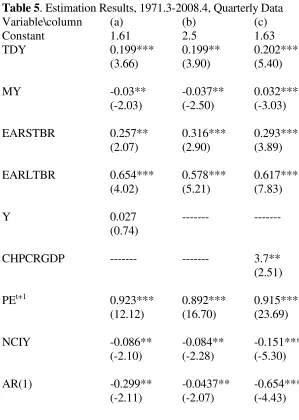
Estimates Using Quarterly Data: 1971.3-2008.4
With the variables PEt+1t, EARSTBRt and EARLTBRt recalibrated within the context of the
model in quarterly data terms, the autoregressive 2SLS estimate of equation (8) for the period
1971.3-2008.4 is provided in column (a) of Table 5, where terms in parentheses are t-values. In
column (a) of Table 5, all seven of the estimated coefficients on the explanatory variables exhibit the
expected signs, with three of these coefficients being statistically significant at the 1% level and three
statistically significant at the 10% level. There is no indication of an autocorrelation problem.
In this estimate, the estimated coefficient on the monetary base (de facto available money
supply) variable, MYt, is negative, as expected, and statistically significant at the 5% level, implying
that a higher ratio of the monetary base relative to GDP acts to reduce the nominal interest rate yield
on ten-year U.S. Treasury notes. Interestingly, we observe that these empirical results are essentially
identical if the M2 measure of the money supply, expressed as a percent of GDP, is adopted in lieu
of MYt. The estimated coefficient on the ex ante real short-term interest rate variable, EARSTBRt, is
positive, as hypothesized, and statistically significant at the 5% level, implying that the higher the ex
ante real interest rate yield on three-month Treasury bills, the higher the nominal interest rate yield on
ten-year notes. This finding presumably reflects competition between the ten-year Treasury note and
counterpart short-term financial instruments. Similarly, the coefficient on the variable EARLTBRt is
also positive, as hypothesized, and statistically significant, at the 1% level, implying that the higher
the ex ante real interest rate on long-term Moody’s Aaa-rated corporate bonds, the higher the level of
nominal interest rate yield on ten-year Treasury notes, presumably because of competition between
ten-year Treasury notes and long-term financial instruments. The estimated coefficient on the
expected inflation variable, PEt+1t, is also positive, as expected (conventional wisdom), and
statistically significant at the 1% level, implying that the higher the expected future inflation rate, the
greater the nominal interest rate yield on ten-year Treasury bonds. Next, the estimated coefficient on
5% level, implying that such capital flows act to absorb domestic debt and reduce the interest rate on
that debt, i.e., on ten-year Treasury notes, in this case. Finally, the estimated coefficient on the budget
deficit variable is positive and statistically significant at the 1% level. Thus, the higher the federal
budget deficit (as a percent of GDP), the higher the nominal interest rate yield on intermediate-term,
i.e., in this case, on ten-year U.S. Treasury notes.
In column (b) of Table 5, where the variable Yt-1 is deleted from the basic model (as in Tables
2 and 4), all of the estimated coefficients on the explanatory variables exhibit the expected signs, with
five of these six coefficients being statistically significant at the 1% level and one being statistically
significant at the 5% level. Thus, this version of the basic model yields results that imply, using
quarterly data, that the nominal interest rate yield on ten-year Treasury notes is an increasing function
of the ex ante real interest rate yield on three-month Treasury bills, the ex ante real interest rate yield
on Moody’s Aaa-rated corporate bonds, and expected future inflation, while being a decreasing
function of the monetary base (as a percent of GDP) and net capital inflows (as a percent of GDP).
Finally, these results once again find that the nominal interest rate yield on ten-year Treasury notes is
an increasing function of the federal budget deficit (expressed as a percent of GDP).
Lastly, there are the quarterly results in which the variable CHPCRGDP, defined here
(paralleling Tables 2 and 4) as the change in the annualized per capita real GDP between the previous
quarter (t-1) and the current quarter (t) is adopted in place of the percent growth rate of real GDP. The
estimate, six of the seven estimated coefficients are statistically significant at the 1% level, and one is
statistically significant at the 2% level. These findings imply that the nominal interest rate on ten-year
Treasury notes is an increasing function of the ex ante real interest rate yield on three-month Treasury
bills, the ex ante real interest rate yield on Moody’s Aaa-rated corporate bonds, expected future
inflation, and the change in per capita real GDP, while being a decreasing function of the monetary
base and net capital inflows. Finally, these results once again find that the nominal interest rate yield
on ten-year Treasury notes is an increasing function of the federal budget deficit.
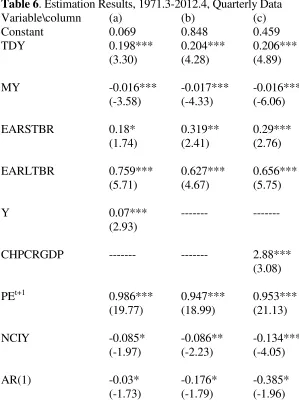
Estimates Using Quarterly Data: 1971.3-2012.4
The estimate of equation (8) for the period 1971.3-2012.4 is provided in column (a) of Table 6, where,
all seven of the estimated coefficients on the explanatory variables exhibit the expected signs, with
five of these seven coefficients being statistically significant at the 1% level, one being statistically
significant at the 5% level, and one, the coefficient on the NCIYt-1 variable, being statistically
significant at the 6% level.
These quarterly data-based findings for the period 1971.3-2012.4 imply that the nominal
interest rate yield on ten-year Treasury notes is an increasing function of the ex ante real interest rate
yield on three-month Treasury bills, the ex ante real interest rate yield on Moody’s Aaa-rated
corporate bonds, expected future inflation, and the percentage growth rate of real GDP, while being
a decreasing function of the monetary base (as a percent of GDP) and, at the six percent statistical
the nominal interest rate yield on ten-year Treasury notes is an increasing function of the federal
budget deficit (expressed as a percent of GDP).
In column (b) of Table 6, following the procedure in Tables 2, 4, and 6, the estimate omits the
Yt-1 variable. In this case, four of the six coefficients are statistically significant at the 1% level, while
the remaining two are statistically significant at the 5% level. These results imply that the nominal
interest rate yield on ten-year Treasury notes is an increasing function of the ex ante real interest rate
yield on three-month Treasury bills, the ex ante real interest rate yield on Moody’s Aaa-rated
corporate bonds, expected future inflation, and the federal budget deficit (as a percent of GDP), while
being a decreasing function of the monetary base (as a percent of GDP) and net capital inflows (as a
percent of GDP).
Finally, there are the results in column (c) of Table 6, where the coefficients on all seven
explanatory variables are statistically significant at the one percent level with the expected signs.
These findings imply that the nominal interest rate yield on ten-year Treasury notes is an increasing
function of the ex ante real interest rate yield on three-month Treasury bills, the ex ante real interest
rate yield on Moody’s Aaa-rated corporate bonds, expected future inflation, and the change in per
capita real GDP, while being a decreasing function of the monetary base and net capital inflows.
Finally, these results once again find that the nominal interest rate yield on ten-year Treasury notes is
an increasing function of the federal budget deficit (expressed as a percent of GDP).
1971.3-2008.4) and all three estimates in Table 6 (for 1971.3-2012.4), it appears that for every 1%
increase in the size of the budget deficit (as a percent of GDP), the nominal interest rate yield rises
approximately 20-21 basis points. This is comparable to the findings when the model was estimated
using annual data.
6 Overview and Perspective
The present study adopts a loanable funds model and, first using annual data and then quarterly data
for the periods 1971-2008 and 1971-2012, consistently finds that the nominal interest rate yield on
ten-year U.S. Treasury notes is an increasing function of the ex ante real three-month Treasury bill
interest rate yield, the ex ante real interest rate yield on long-term high grade corporate bonds
(Moody’s Aaa-rated), and expected inflation, while being a decreasing function of the ratio of the
monetary base to the GDP level (expressed as a percent) and net financial capital inflows expressed
as a percent of GDP. Furthermore, in contrast to the predictions found in Ricardian Equivalence, it
also is found consistently that the greater the federal budget deficit (relative to the GDP level), the
higher the nominal interest rate yield on ten-year U.S. Treasury notes. More specifically, for every 1%
increase in the size of the budget deficit (as a percent of GDP), the nominal interest rate yield rises
approximately 19-21 basis points. This finding is consistent with a variety of empirical studies of
earlier periods, as observed above.
Thus, it appears that factors elevating the U.S. budget deficit act raise the nominal
loanable funds. Thus, federal government policies that raise the budget deficit cannot be viewed in a
vacuum since they may well impact adversely upon the finances of corporations and households and,
accordingly, the real investment in new plant and equipment, consumption outlays, real GDP growth,
and both the level of employment and rate of employment growth of the U.S.
References
Al-Saji, A (1993) Government budget deficits, nominal and ex ante real long-term interest rates in the U.K., 1960.1-1990.2. Atlantic Economic Journal, 21: 71-77.
Al-Saji, A (1992) The Impact of government budget deficits on ex post real long-term interest rates in the U.K. Economia Internazionale, 45: 158-163.
Barth, JR, Iden, G, Russek, FS (1984) Do federal deficits really matter? Contemporary Policy Issues, 3: 79-95.
Barth, JR, Iden, G, Russek, FS (1985), Federal borrowing and short-term interest rates: Comment.
Southern Economic Journal, 52: 554-559.
Barth, JR, Iden, G, Russek, FS (1986), Government debt, government spending, and private sector behavior: Comment. American Economic Review, 76: 1115-1120.
Barth, JR, Iden, G, Russek, FS, Wohar, M (1989) Effects of federal budget deficits on interest rates and the composition of domestic output.The Urban Institute, Washington, D.C.
Carlson, KM, Spencer, RW (1975) Crowding out and its critics. Federal Reserve Bank of St. Louis Review, 57: 1-19.
Cebula, RJ (1997) An empirical analysis of the impact of government tax and auditing policies on the size of the underground economy. American Journal of Economics and Sociology, 56: 173-186.
Cebula, RJ (1985) The crowding out effect of fiscal policy. Kyklos, 38: 435-438.
Cebula, R.J. (1997A). “An empirical analysis of the impact of government tax and auditing policies on the size of the underground economy,” American Journal of Economics and Sociology, 56 (2): 173-186.
Cebula, RJ (1997B) An empirical note on the impact of the federal budget deficit on ex ante real long-term interest rates, 1973-1995. Southern Economic Journal, 63: 1094-1099.
Cebula, RJ (2005) Recent evidence on the impact of the primary deficit on nominal longer-term Treasury note interest rate yields. Global Business & Economics Review, 7: 47-58.
Cebula, RJ (2004) Income tax evasion revisited: The impact of interest rate yields on tax-free Municipal Bonds. Southern Economic Journal, 71 (2): 418-423.
Cebula, RJ, Belton, WJ (1993) Government budget deficits and interest rates in the United States: Evidence for closed and open economies put into perspective. Public Finance/Finances Publiques, 48: 188-209.
Cebula, RJ, Cuellar, P (2010) Recent evidence on the impact of government budget deficits on the
ex ante real interest rate yield on Moody’s Baa-rated corporate bonds. Journal of Economics and Finance, 34: 301-307.
Council of Economic Advisors. (2013). Economic report of the president, 2013. Washington, D.C: U.S. Government Printing Office.
Cukierman, A, Meltzer, A (1983) A political theory of government debt and deficits in a Neo-Ricardian framework. American Economic Review, 79: 713-732.
Feldstein, M, Eckstein, O (1970) The fundamental determinants of the interest rate. Review of Economics and Statistics,52: 362-375.
Findlay, DW (1990) Budget deficits, expected inflation, and short-term real interest rates.
International Economic Journal, 4: 41-53.
Gale, W.G, Orszag, PR (2003) Economic effects of sustained budget deficits. National Tax Journal, 49: 151-164.
Finance, 23: 211-219.
Hoelscher, G (1983) Federal borrowing and short-term interest rates. Southern Economic Journal, 50: 319-333.
Hoelscher, G (1986) New evidence on deficits and interest rates. Journal of Money, Credit, and Banking, 18: 1-17.
Holloway, TM (1986) The cyclically adjusted federal budget and federal debt: Revised and updated estimates. Survey of Current Business, 66: 11-17
.
Holloway, TM (1988) The relationship between federal deficit/debt and interest rates. The American Economist, 32: 29-38.
Johnson, CF (1992) An empirical note on interest rate equations. Quarterly Review of Economics and Finance, 32: 141-147.
Kiani, KM (2009) Federal budget deficits and long-term interest rates in the USA. Quarterly Review of Economics and Finance, 34 (3): 301-307.
Koch, JV (1994) Federal budget deficits, interest rates, and international capital flows: A further note, Quarterly Review of Economics and Finance, 32: 117-120.
Ostrosky, AL (1990) Federal budget deficits and interest rates: Comment. Southern Economic Journal, 56: 802-803.
Swamy, PAVB, Kolluri, BR, Singamsetti, RN (1990) What do regressions of interest rates on deficits imply? Southern Economic Journal, 56: 1010-1028.
Tanzi, V (1985) Fiscal deficits and interest rates in the United States. I.M.F. Staff Papers, 33: 551-576.
Table 1. Descriptive Statistics
1971-2008 (Annual Data) 1971-2012 (Annual Data)
Variable Mean Standard Deviation Mean Standard Deviation
RTEN 7.348 2.630 6.91 2.851
Table 2. Autoregressive 2SLS Estimation Results, 1971-2008, Annual Data Variable\column (a) (b) (c)
Constant 2.51 2.41 1.55
TDY 0.201*** 0.201*** 0.203*** (3.55) (3.87) (5.34)
MY -0.041*** -0.0366** -0.031*** (-2.71) (-2.42) (-3.04)
EARSTBR 0.311*** 0.313*** 0.292*** (2.75) (2.89) (3.97)
EARLTBR 0.584*** 0.582*** 0.62***
(4.84) (5.33) (8.32)
Y 6.214 --- --- (0.70)
CHPCRGDP --- --- 379.7** (2.55)
PEt+1 0.901*** 0.895*** 0.918*** (19.76) (17.47) (26.74)
NCIY -0.107* -0.084** -0.152***
(-1.85) (-2.16) (-5.05)
DW 2.10 2.11 2.28 Rho -0.05 -0.05 -0.14
Dependent Variable: RTENt Terms in parentheses are t-values.. ***statistically significant at 1%
[image:34.612.72.533.231.593.2]level; **statistically significant at 5% level; *statistically significant at 10% level.
Table 3. Correlation Matrix among Independent Variables, 1971-2008
TDY MY EARSTBR EARLTBR Y NCIY PEt+1
TDY 1.000
MY -0.199 1.000
EARSTBR -0.068 -0.449 1.000
EARLTBR 0.231 -0.248 0.379 1.000
Y -0.389 -0.111 0.366 0.121 1.000
NCIY -0.144 0.431 0.042 0.125 0.099 1.000
Table 4. Autoregressive 2SLS Estimation Results, 1971-2012, Annual Data Variable\column (a) (b) (c)
Constant 0.877 0.809 0.563
TDY 0.187*** 0.201*** 0.213*** (3.22) (3.96) (4.45)
MY -0.0147*** -0.0168*** -0.0167*** (-2.85) (-4.25) (-4.38)
EARSTBR 0.298** 0.306** 0.256** (2.03) (2.12) (1.98)
EARLTBR 0.650*** 0.637*** 0.672***
(4.41) (4.41) (5.37)
Y -7.54 --- --- (-0.72)
CHPCRGDP --- --- 276.04* (1.81)
PEt+1 0.938*** 0.951*** 0.945*** (21.23) (18.31) (19.57)
NCIY -0.062 -0.083** -0.155**
(-1.14) (-2.09) (-2.33)
DW 2.02 2.03 2.05 Rho -0.01 -0.02 -0.03
Dependent Variable: RTENt. Terms in parentheses are t-values. ***statistically significant at 1%
[image:36.612.70.369.207.627.2]level; **statistically significant at 5% level; *statistically significant at 10% level.
Table 5. Estimation Results, 1971.3-2008.4, Quarterly Data Variable\column (a) (b) (c) Constant 1.61 2.5 1.63 TDY 0.199*** 0.199** 0.202***
(3.66) (3.90) (5.40)
MY -0.03** -0.037** 0.032*** (-2.03) (-2.50) (-3.03)
EARSTBR 0.257** 0.316*** 0.293*** (2.07) (2.90) (3.89)
EARLTBR 0.654*** 0.578*** 0.617***
(4.02) (5.21) (7.83)
Y 0.027 --- --- (0.74)
CHPCRGDP --- --- 3.7** (2.51)
PEt+1 0.923*** 0.892*** 0.915*** (12.12) (16.70) (23.69)
NCIY -0.086** -0.084** -0.151***
(-2.10) (-2.28) (-5.30)
DW 2.05 2.10 2.18 Rho -0.03 -0.05 -0.09
Dependent Variable: RTENt. Terms in parentheses are t-values. ***statistically significant at 1%
[image:37.612.71.370.211.620.2]level; **statistically significant at 5% level; *statistically significant at 10% level.
Table 6. Estimation Results, 1971.3-2012.4, Quarterly Data Variable\column (a) (b) (c) Constant 0.069 0.848 0.459 TDY 0.198*** 0.204*** 0.206***
(3.30) (4.28) (4.89)
MY -0.016*** -0.017*** -0.016*** (-3.58) (-4.33) (-6.06)
EARSTBR 0.18* 0.319** 0.29*** (1.74) (2.41) (2.76)
EARLTBR 0.759*** 0.627*** 0.656***
(5.71) (4.67) (5.75)
Y 0.07*** --- --- (2.93)
CHPCRGDP --- --- 2.88*** (3.08)
PEt+1 0.986*** 0.947*** 0.953*** (19.77) (18.99) (21.13)
NCIY -0.085* -0.086** -0.134***
(-1.97) (-2.23) (-4.05)
DW 2.00 2.03 2.14 Rho 0.00 -0.02 -0.07
Dependent Variable: RTENt. Terms in parentheses are t-values. ***statistically significant at 1%
level; **statistically significant at 5% level; *statistically significant at 10% level.
APPENDIX: Robustness Testing
In this Appendix to the study, robustness tests of the basic model and its two variations are presented
for both study periods. For simplicity, these robustness tests adopt only annual data, although it is
noteworthy that the robustness tests using quarterly data yield very similar results, further affirming
the robustness of the model. Naturally, these results will be provided upon request.
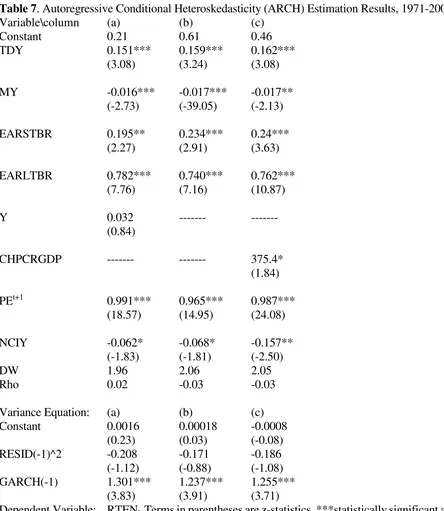
Table 7 provides a robustness test for the findings and models summarized in Table 2 for the
1971-2008 study period in the form of ARCH (Autoregressive Conditional Heterskedasticity)
estimates. These results parallel those found in Table 2, thereby confirming and lending strong
support for the basic model and its findings as presented in section 4 above. This robustness test is
particularly relevant, in terms of the objective of this study, for the case of the federal budget deficit,
whose z-statistic is positive and statistically significant at the 1% level in all three ARCH estimates;
furthermore, similarly strong statistical significance is obtained for the monetary base variable.
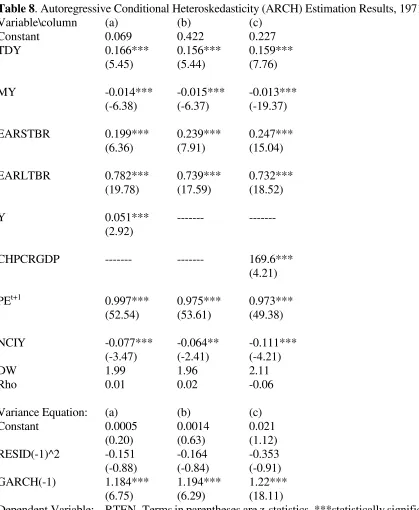
Table 8 provides robustness tests for the findings and models summarized in Table 4 for the
1971-2012 study period. As shown in Table 8, ARCH estimates paralleling the estimated models
found in Table 4 confirm and lend strong support for the basic model and its findings as presented in
z-statistic is positive and statistically significant at the 1% level in all three ARCH estimates; similar
statistical significance is obtained for the monetary base variable, which reflects quantitative easing
Table 7. Autoregressive Conditional Heteroskedasticity (ARCH) Estimation Results, 1971-2008 Variable\column (a) (b) (c)
Constant 0.21 0.61 0.46 TDY 0.151*** 0.159*** 0.162***
(3.08) (3.24) (3.08)
MY -0.016*** -0.017*** -0.017** (-2.73) (-39.05) (-2.13)
EARSTBR 0.195** 0.234*** 0.24*** (2.27) (2.91) (3.63)
EARLTBR 0.782*** 0.740*** 0.762***
(7.76) (7.16) (10.87)
Y 0.032 --- --- (0.84)
CHPCRGDP --- --- 375.4* (1.84)
PEt+1 0.991*** 0.965*** 0.987*** (18.57) (14.95) (24.08)
NCIY -0.062* -0.068* -0.157**
(-1.83) (-1.81) (-2.50)
DW 1.96 2.06 2.05
Rho 0.02 -0.03 -0.03
Variance Equation: (a) (b) (c) Constant 0.0016 0.00018 -0.0008
(0.23) (0.03) (-0.08) RESID(-1)^2 -0.208 -0.171 -0.186
(-1.12) (-0.88) (-1.08) GARCH(-1) 1.301*** 1.237*** 1.255***
(3.83) (3.91) (3.71)
Dependent Variable: RTENt. Terms in parentheses are z-statistics. ***statistically significant at 1%
Table 8. Autoregressive Conditional Heteroskedasticity (ARCH) Estimation Results, 1971-2012 Variable\column (a) (b) (c)
Constant 0.069 0.422 0.227 TDY 0.166*** 0.156*** 0.159***
(5.45) (5.44) (7.76)
MY -0.014*** -0.015*** -0.013*** (-6.38) (-6.37) (-19.37)
EARSTBR 0.199*** 0.239*** 0.247*** (6.36) (7.91) (15.04)
EARLTBR 0.782*** 0.739*** 0.732***
(19.78) (17.59) (18.52)
Y 0.051*** --- --- (2.92)
CHPCRGDP --- --- 169.6*** (4.21)
PEt+1 0.997*** 0.975*** 0.973*** (52.54) (53.61) (49.38)
NCIY -0.077*** -0.064** -0.111***
(-3.47) (-2.41) (-4.21)
DW 1.99 1.96 2.11
Rho 0.01 0.02 -0.06
Variance Equation: (a) (b) (c) Constant 0.0005 0.0014 0.021
(0.20) (0.63) (1.12) RESID(-1)^2 -0.151 -0.164 -0.353
(-0.88) (-0.84) (-0.91) GARCH(-1) 1.184*** 1.194*** 1.22***
(6.75) (6.29) (18.11)
Dependent Variable: RTENt. Terms in parentheses are z-statistics. ***statistically significant at 1%