Maximizing Classification Accuracy in Native Language Identification
Scott Jarvis
Yves Bestgen
Steve Pepper
Ohio University Université catholique de Louvain Department of Linguistic Department of Linguistics Centre for English Corpus Linguistics Aesthetic and Literary Studies
Athens, OH, USA Louvain-la-Neuve, Belgium University of Bergen, Norway
[email protected] [email protected] [email protected]
Abstract
This paper reports our contribution to the 2013 NLI Shared Task. The purpose of the task was to train a machine-learning system to identify the native-language affiliations of 1,100 texts written in English by nonnative speakers as part of a high-stakes test of gen-eral academic English proficiency. We trained our system on the new TOEFL11 corpus, which includes 11,000 essays written by nonnative speakers from 11 native-language backgrounds. Our final system used an SVM classifier with over 400,000 unique features consisting of lexical and POS n-grams occur-ring in at least two texts in the training set. Our system identified the correct native-language affiliations of 83.6% of the texts in the test set. This was the highest classification accuracy achieved in the 2013 NLI Shared Task.
1
Introduction
The problem of automatically identifying a writer’s or speaker’s first language on the basis of features found in that person’s language production is a relatively new but quickly expanding line of in-quiry. It seems to have begun in 2001, but most of the studies published in this area have appeared in just the past two years. Although the practical ap-plications of native-language identification (NLI) are numerous, most of the existing research seems to be motivated by one or the other of two types of questions: (1) questions about the nature and extent of native-language influence in nonnative speak-ers’ speech or writing, and (2) questions about the
maximum levels of NLI classification accuracy that are achievable, which includes questions about the technical details of the systems that achieve the best results. Our previous work in this area has been motivated primarily by the former (see the multiple studies in Jarvis and Crossley, 2012), but in the present study we conform to the goals of the 2013 NLI Shared Task (Tetreault et al., 2013) in a pursuit of the latter.
2
Related Work
The first published study to have performed an NLI analysis appears to have been Mayfield Tomokiyo and Jones (2001). The main goal of the study was to train a Naïve Bayes system to identify native versus nonnative speakers of English on the basis of the lexical and part-of-speech (POS) n-grams found in their speech. The nonnative speak-ers in the study included six Chinese speakspeak-ers and 31 Japanese speakers, and as a secondary goal, the researchers trained the system to identify the nonnative speakers by their native language (L1) backgrounds. The highest NLI accuracy they achieved was 100%. They achieved this result us-ing a model made up of a combination of lexical 1-grams and 2-1-grams in which nouns (and only nouns) were replaced with a POS identifier (=N).
As far as we are aware, an NLI accuracy of 100% has not been achieved since Mayfield Tomokiyo and Jones (2001), but the NLI tasks that researchers have engaged in since then have been a great deal more challenging than theirs. This is true primarily in the sense that no other NLI study we are aware of has had such a high baseline accuracy, which is the accuracy that would be achieved if all
cases were classified as belonging to the largest group. Because 31 of the 37 participants in the Mayfield Tomokiyo and Jones study were Japa-nese speakers, the baseline accuracy was already 83.8%. To avoid such a bias and to provide a greater challenge to their systems, researchers in recent years have engaged in NLI tasks that have involved more equally balanced groups with a far larger number of L1s. Most of these studies have focused on the identification of the L1s of nonnative writers who produced the texts included in the International Corpus of Learner English (ICLE) (Granger et al., 2009).
NLI studies that have focused on the ICLE in-clude but are not limited to, in chronological order, Koppel et al. (2005), Tsur and Rappoport (2007), Jarvis (2011), Bestgen et al. (2012), Jarvis and Paquot (2012), Bykh and Meuers (2012), and Tetreault et al. (2012). The highest NLI accuracy achieved in any of these studies was 90.1%, which was reported by Tetreault et al. (2012). The re-searchers in this study used a system involving the LIBLINEAR instantiation of Support Vector Ma-chines (SVM) with the L1-regularized logistic re-gression solver and default parameters. The features in their model included character n-grams, function words, parts of speech, spelling errors and features of writing quality, such as grammatical errors, style markers, and so forth. They used spe-cialized software to extract error counts, grammar fragments, and counts of basic dependencies. They also created language model perplexity scores that reflected the lexical 5-grams most representative of each L1 in the corpus. This combination of fea-tures is more comprehensive than that used in any other NLI study, but the authors reported that their success was not due simply to the combination of features, but also because of the ensemble classifi-cation method they used. The ensemble method involved the creation of separate classifier models for each category of features; the L1 affiliations of individual texts were later predicted by the com-bined probabilities produced by the different clas-sifier models. The authors pointed out that combining all features into a single classifier gave them an NLI accuracy of only 82.6%, which is far short of the 90.1% they achieved through the en-semble method.
The number of L1s represented in the study by Tetreault et al. (2012) was seven, and it is notewor-thy that they achieved a higher NLI accuracy than
any of the previous NLI studies that had examined the same number (Bykh and Meurers, 2012) or even a smaller number of L1s in the ICLE (e.g., Koppel et al., 2005, Tsur and Rappoport, 2007; Bestgen et al., 2012). The only NLI studies we know of that have examined more than seven L1s in the ICLE are Jarvis (2011) and Jarvis and Paquot (2012). Both studies examined 12 L1s in the ICLE, and both used a combination of features that included only lexical n-grams (1-grams, 2-grams, 3-2-grams, and 4-grams). Jarvis (2011) com-pared 20 different NLI systems to determine which would provide the highest classification accuracy for this particular task, and he found that LDA per-formed best with an NLI accuracy of 53.6%. This is the system that was then adopted for the Jarvis and Paquot (2012) study. It is important to note that the primary goal for Jarvis and Paquot was not to maximize NLI accuracy per se, but rather to use NLI as a means for assisting in the identification of specific instances and types of lexical influence from learners’ L1s in their English writing.
As noted by Bestgen et al. (2012), Jarvis and Paquot (2012), and Tetreault et al. (2012), there are certain disadvantages to using the ICLE for NLI research. One problem made especially clear by Bestgen et al. is that the language groups repre-sented in the ICLE are not evenly balanced in terms of their levels of English proficiency. This creates an artificial sampling bias that allows an NLI system to distinguish between L1 groups on the basis of proficiency-related features without creating a classification model that accurately re-flects the influences of the learners’ language backgrounds. Another problem mentioned by these and other authors is that writing topics are not evenly distributed across the L1 groups in the ICLE. That is, learners from some L1 groups tend-ed to write their essays in response to certain writ-ing prompts, whereas learners from other L1 groups tended to write in response to other writing prompts. Tetreault et al. took extensive measures to remove as much of the topic bias as possible before running their analyses, but they also intro-duced a new corpus of nonnative English writing that is much larger and better balanced than the ICLE in terms of the distribution of topics across L1 groups. The new corpus is the TOEFL11, which will be described in detail in Section 3.
corpus was Tetreault et al. (2012). As described earlier, they performed an NLI analysis on a sub-sample of the ICLE representing seven L1 back-grounds. They also used the same system (including an identical set of features) in an NLI analysis of the TOEFL11. The fact that the TOEFL11 is better balanced than the ICLE is ad-vantageous in terms of the strength of the NLI classification model that it promotes, but this also makes the classification task itself more challeng-ing because it gives the system fewer cues (i.e., fewer systematic differences across groups) to rely on. The fact that the TOEFL11 includes 11 L1s, as opposed to the seven L1s in the subsample of the ICLE the authors examined, also makes the NLI task more challenging. For these reasons, NLI ac-curacy is bound to be higher for the ICLE than for the TOEFL11. This is indeed what the authors found. The NLI accuracy they reported for the TOEFL11 was nearly 10% lower than for the ICLE (80.9% vs. 90.1%). Nevertheless, their result of 80.9% accuracy was still remarkable for a task in-volving 11 L1s. Tetreault et al. have thus set a very high benchmark for the 2013 NLI Shared Task.
3
Data
The present study tests the effectiveness of our own NLI system for identifying the L1s represent-ed in the TOEFL11 (Blanchard et al., 2013). The TOEFL11 is a corpus of texts consisting of 11,000 essays written by nonnative English speakers as part of a high-stakes test of general proficiency in academic English. The essays were written by learners from the following 11 L1 backgrounds: Arabic, Chinese, French, German, Hindi, Italian, Japanese, Korean, Spanish, Telugu, and Turkish. The corpus is perfectly balanced in terms of its number of essays per L1 group (i.e., 1,000 per L1), and it is also fairly well balanced in relation to the topics written about. The essays in the TOEFL11 were written in response to any of eight different writing prompts, and all eight prompts are reflected in all 11 L1 groups. Within four of the L1 groups, all prompts are almost equally represented with a proportion of approximately 12.5% per prompt (i.e., 100% ÷ 8 prompts = 12.5%). In other groups, there is more variability. The Italian group shows the largest discrepancies, with one prompt repre-senting only 1.2% of the essays, and another prompt representing 17.2% of the group’s essays.
English Proficiency
L1 Low Medium High
ARABIC Count 274 545 181
[image:3.612.314.539.52.467.2]% 27.4% 54.5% 18.1% CHINESE Count 90 662 248 % 9.0% 66.2% 24.8% FRENCH Count 60 526 414 % 6.0% 52.6% 41.4% GERMAN Count 14 371 615 % 1.4% 37.1% 61.5% HINDI Count 25 399 576 % 2.5% 39.9% 57.6% ITALIAN Count 145 569 286 % 14.5% 56.9% 28.6% JAPANESE Count 207 617 176 % 20.7% 61.7% 17.6% KOREAN Count 154 617 229 % 15.4% 61.7% 22.9% SPANISH Count 73 502 425 % 7.3% 50.2% 42.5% TELUGU Count 86 595 319 % 8.6% 59.5% 31.9% TURKISH Count 73 561 366 % 7.3% 56.1% 36.6%
Table 1: Distribution of English Proficiency Levels
is not a perfectly balanced corpus, but it is much larger than the ICLE and involves fewer prompts, which are more evenly distributed across L1 groups. Another advantage of the TOEFL11 is that each text is associated with a proficiency level that has been determined by assessment experts using a consistent rating procedure for the entire corpus. This fact may allow researchers to isolate the ef-fects of learners’ proficiency levels and to adjust their systems accordingly.
The TOEFL11 data were distributed to the 2013 NLI Shared Task participants in three stages. The initial distribution was a training set consisting of 9,900 of the 11,000 texts in the TOEFL11. The training set was made up of 900 texts from each L1 group. Later, a development set was made availa-ble. This included the remaining 1,100 texts in the TOEFL11, with 100 texts per L1. Finally, a test set was also provided to the teams participating in the 2013 NLI Shared Task. The test set consisted of 1,100 texts representing the same 11 L1s that are found in the TOEFL11. The test set included in-formation about the prompt that each text was writ-ten in response to, as well as information about the writer’s proficiency level, but did not include in-formation about the writer’s L1.
4
System
Although our previous work has used NLI as a means toward exploring and identifying the effects of crosslinguistic influence in language learners’ written production (see Jarvis and Crossley, 2012), in the present study we approached NLI exclusive-ly as a classification task, in keeping with the goals of the NLI Shared Task (Tetreault et al. 2013). In order to maximize classification accuracy for the present study, we chose a system that would allow for the inclusion of thousands of features without violating statistical assumptions. Due to the unre-stricted number of features it allows and the high levels of classification accuracy it has achieved in previous research, such as in the study by Tetreault et al. (2012), we chose to use linear Support Vector Machines (SVM) via the LIBLINEAR software package (Fan et al., 2008). The software allows the user to choose among the following types of solv-ers:
a: L2-regularized L1-loss SVM (dual) b: L2-regularized L2-loss SVM (dual) c: L2-regularized logistic regression (primal)
d: L1-regularized L2-loss SVM e: L1-regularized logistic regression f: L2-regularized L1-loss SVM (primal) g: L2-regularized L2-loss SVM (primal) h: Multi-class SVM by Crammer and Singer Although Tetreault et al. (2012) used the Type e solver, we found Type b to be the most efficient in terms of both speed and accuracy. LIBLINEAR implements SVM via a multi-class classification strategy that juxtaposes each class (i.e., each L1) against all others. It also optimizes a cost parame-ter (Parameparame-ter C) using a grid search that relies on a crossvalidation criterion. The software iterates over multiple values of C until it arrives at an op-timal value. Although LIBLINEAR has a built-in program for optimizing C, we used our own opti-mization program in order to have more flexibility in choosing values of C to test.
4.1 Features Used
The features we tried represented three broad cate-gories: words, characters, and complex features. The word category included lexemes, lemmas, and POS tags, as well as n-grams consisting of lex-emes, lemmas, and POS tags. Lexemes were de-fined as the observed forms of words, numbers, punctuation marks, and even symbols that were encountered in the TOEFL11. Lemmas were de-fined as the dictionary forms of lexemes, and we used the TreeTagger software package (Schmid, 1995) to automate the task of converting lexemes to lemmas. TreeTagger is unable to determine lemmas for rare words, misspelled words, and newly borrowed or coined words, and in such cas-es, it outputs “unknown” in place of a lemma. We also used TreeTagger to automate the identification of the parts of speech (POS) associated with indi-vidual words. TreeTagger can only estimate the POS for unknown words, and it is also not perfect-ly accurate in determining the correct POS for words that it does recognize. Nevertheless, Schmid (1995) found that its POS tagging accuracy tends to be between 96% and 98%, which we consider to be adequate for present purposes. We included in our system all 1-grams, 2-grams, 3-grams, and 4-grams of lexemes, lemmas, and POS tags that oc-curred in at least two texts in the training set.
training set. Finally, our complex features included nominalization suffixes (e.g., -tion, -ism), number of tokens per essay, number of types, number of sentences, number of characters, mean sentence length, mean length of lexemes, and a measure of lexical variety (i.e., type-token ratio).
5
Results
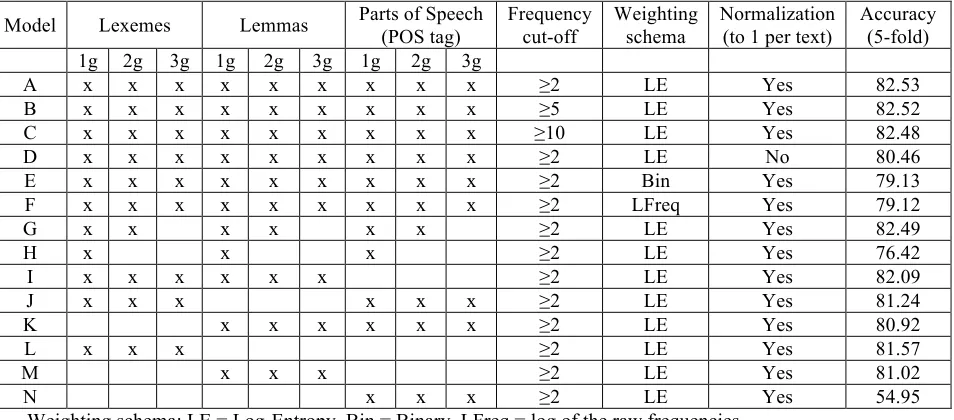
[image:5.612.68.547.450.664.2]We applied the system described in the previous section to the TOEFL11 corpus. We did this in multiple stages, first by training the system on the original training set of 9,900 texts while using LIBLINEAR’s built-in 5-fold crossvalidation. With the original training set, we tried multiple combinations of features in order to arrive at an optimal model. We found that our complex fea-tures contributed very little to any model we tested, and that we could achieve higher levels of NLI accuracy by excluding them altogether. We also found that models made up of optimal sets of lexi-cal features gave us roughly the same levels of NLI accuracy as models made up of optimal sets of character n-grams. However, models made up of a combination of lexical features and character fea-tures together performed worse than models made up of just one or the other. Our best performing model, by a small margin, was a model consisting of 1-grams, 2-grams, and 3-grams involving lex-emes, lemmas, and POS tags. The results of our comparison of multiple lexical models is shown in
Table 2, with the best performing model represent-ed as Model A.
Table 2 shows that Model A consists of all 1-gram, 2-1-gram, and 3-gram lexemes, lemmas, and POS tags that occur in at least two texts, using a log-entropy weighting schema and normalizing each text to unit length. It is noteworthy that nor-malizing each text vector, but also using a log-entropy weighting schema clearly improves the model accuracy. Normalizing each text vector as recommended by Fan et al. (2008), but also using a log-entropy weighting schema (Dumais, 1991; Bestgen, 2012) clearly improves the model accura-cy. The total number of unique features in Model A is over 400,000. Our initial run of this model on the training set gave us a 5-fold cross-validated NLI accuracy of 82.53%.
We then attempted to determine whether these results could be replicated using other test materials. We first applied the best performing models displayed in Table 2 to the development set—using the development set as a test set—and achieved an NLI accuracy of over 86% for Model A, which remained the most accurate one.
Then we applied these models to our own test set built to be evenly balanced in terms of the strat-ification of both L1s and prompts. We built this test set because we discovered large differences when we compared the distribution of prompts across L1 groups in the official test set for the 2013
Model Lexemes Lemmas Parts of Speech (POS tag)
Frequency cut-off
Weighting schema
Normalization (to 1 per text)
Accuracy (5-fold) 1g 2g 3g 1g 2g 3g 1g 2g 3g
A x x x x x x x x x ≥2 LE Yes 82.53
B x x x x x x x x x ≥5 LE Yes 82.52
C x x x x x x x x x ≥10 LE Yes 82.48
D x x x x x x x x x ≥2 LE No 80.46
E x x x x x x x x x ≥2 Bin Yes 79.13
F x x x x x x x x x ≥2 LFreq Yes 79.12
G x x x x x x ≥2 LE Yes 82.49
H x x x ≥2 LE Yes 76.42
I x x x x x x ≥2 LE Yes 82.09
J x x x x x x ≥2 LE Yes 81.24
K x x x x x x ≥2 LE Yes 80.92
L x x x ≥2 LE Yes 81.57
M x x x ≥2 LE Yes 81.02
N x x x ≥2 LE Yes 54.95
Weighting schema: LE = Log-Entropy, Bin = Binary, LFreq = log of the raw frequencies
[image:5.612.70.547.453.663.2]NLI Shared Task versus both the training set and development set. To build it, we combined the training set and development set into a single cor-pus (i.e., the full TOEFL11), and then divided the TOEFL11 into a double-stratified set of cells cross-tabulated by L1 and prompt. This resulted in 11 x 8 = 88 cells, and we randomly selected 10 texts per cell for the test set. This gave us a test set of 880 texts. We used the remaining 10,120 texts as a training set. However, the new division of training and test sets did not strongly modify our results, so we retained the previous Model A as our final model.
In preparation for the final task of identifying the L1 affiliations of the 1,100 texts included in the official test set for the 2013 NLI Shared Task, we used the entire TOEFL11 corpus of 11,000 texts as our training set—with the features in Model A—in order to select the final values for the cost parame-ter (C) of our SVM system. By means of a 10-fold
crossvalidation (CV) procedure on this dataset, the C parameter was set to 3200.
The results of a 10-fold CV (using the fold split-ting of Tetreault et al., 2012) of the system’s per-formance with the TOEFL11 are shown in Table 3. The total number of texts per L1 group is consist-ently 1000, which makes the raw frequencies in the table directly interpretable as percentages. The lowest rate of accurate identification for any L1 in the 10-fold CV was 78.6%, and this was for Telu-gu. For all other L1s, the NLI accuracy rate ex-ceeded 80%, and in the case of German, it reached 96.5%. The overall NLI accuracy for the 10-fold CV was 84.5%.
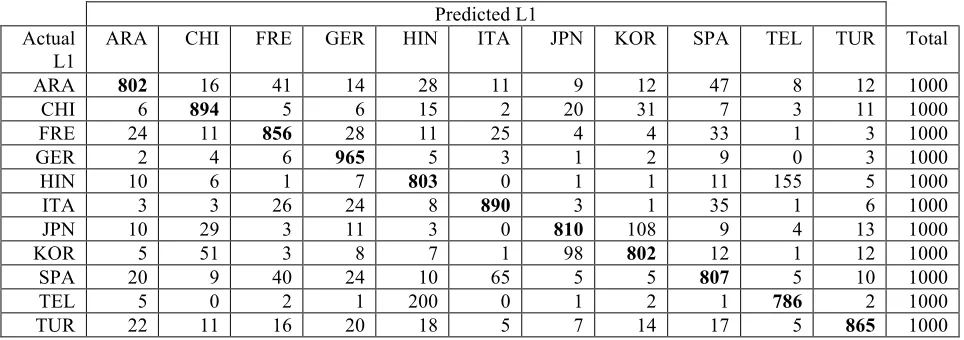
For the final stage of the analysis, we applied our system to the official test set in order to deter-mine how well it can identify writers’ L1s in texts it has not yet encountered. The results of the final analysis are shown in Table 4. The classification accuracy (or recall) for individual L1s in the final
Predicted L1 Actual
L1
ARA CHI FRE GER HIN ITA JPN KOR SPA TEL TUR Total
ARA 802 16 41 14 28 11 9 12 47 8 12 1000
CHI 6 894 5 6 15 2 20 31 7 3 11 1000
FRE 24 11 856 28 11 25 4 4 33 1 3 1000
GER 2 4 6 965 5 3 1 2 9 0 3 1000
HIN 10 6 1 7 803 0 1 1 11 155 5 1000
ITA 3 3 26 24 8 890 3 1 35 1 6 1000
JPN 10 29 3 11 3 0 810 108 9 4 13 1000
KOR 5 51 3 8 7 1 98 802 12 1 12 1000
SPA 20 9 40 24 10 65 5 5 807 5 10 1000
TEL 5 0 2 1 200 0 1 2 1 786 2 1000
TUR 22 11 16 20 18 5 7 14 17 5 865 1000
[image:6.612.66.548.320.490.2]Accuracy = 84.5%
Table 3: 10-Fold Crossvalidation Results
ARA CHI FRE GER HIN ITA JPN KOR SPA TEL TUR Prec. F
ARA 75 0 5 2 2 1 1 2 7 3 2 82.4 78.5
CHI 1 89 0 1 1 0 4 2 0 0 2 82.4 85.6
FRE 2 1 86 6 2 1 0 0 2 0 0 86.0 86.0
GER 0 0 1 96 0 0 0 0 2 0 1 83.5 89.3
HIN 1 0 0 0 81 0 0 0 4 13 1 74.3 77.5
ITA 0 1 3 4 0 90 0 0 2 0 0 90.9 90.5
JPN 2 3 0 1 1 2 85 3 2 0 1 85.9 85.4
KOR 0 10 1 0 1 0 8 76 1 2 1 87.4 81.3
SPA 4 0 4 2 3 3 0 1 81 0 2 78.6 79.8
TEL 1 1 0 1 18 0 0 0 0 79 0 81.4 80.2
TUR 5 3 0 2 0 2 1 3 2 0 82 89.1 85.4
Accuracy = 83.6%
analysis ranges from 75% (Arabic) to 96% (Ger-man), and precision ranges from 74.3% (Hindi) to 90.9% (Italian). Our overall accuracy in identifying the L1s in the test set was 83.6%.
6
Conclusion
Our system turned out to be the most successful system in the 2013 NLI Shared Task. Our 10-fold crossvalidated accuracy of 84.5% is also higher than the result of 80.9% previously achieved by Tetreault et al. (2012) in their earlier NLI analysis of the TOEFL11. We find this to be both interest-ing and unexpected given that Tetreault et al. used more complex measures than we did, such as 5-gram language models, and they also used an en-semble method of classification. Accordingly, we interpret the success of our model as an indication that the most reliable L1 specificity in the
TOEFL11 is to be found simply in the words, word forms, sequential word combinations, and sequen-tial POS combinations that the nonnative writers produced. Tetreault et al. emphasized the useful-ness of features that reflect L1-specific language models, but we believe that the multiple binary class comparisons that SVM makes might already take full advantage of L1 specificity as long as all of the relevant features are fed into the system.
As for the ensemble method of classification used by Tetreault et al., their results clearly indi-cate that this method enhanced their NLI accuracy not only for the TOEFL11, but also for three addi-tional learner corpora, including the ICLE. Our own study did not compare our single-model sys-tem with the use of an ensemble method, but we are naturally curious about whether our own results could have been enhanced through the use of an ensemble method. As mentioned earlier, our pre-liminary attempts to construct a model based on character n-grams produced nearly as high levels of NLI accuracy as our final model involving lexi-cal and POS n-grams. Although we found that combining lexical and character n-grams worsened our results, we believe that a fruitful avenue for future research would be to test whether an ensem-ble of separate models based on character versus lexical n-grams could improve classification accu-racy. Importantly, however, a useful ensemble method generally needs to include more than two models unless it is based on probabilities rather
than on the majority-vote method (cf. Jarvis, 2011; Tetreault et al., 2012).
Our original interest in NLI began with a curios-ity about the evidence it can provide for the pres-ence of crosslinguistic influpres-ence in nonnative speakers’ speech and writing. We believe that NLI strongly supports investigations of L1 influence, but in the case of the present results, we do not believe that L1 influence is solely responsible for the 83.6% NLI accuracy our system has achieved. Other factors are certainly also at play, such as the educational systems and cultures that the nonnative speakers come from. Apparent effects of cultural and/or educational background can be seen in the misclassification results in Table 4. Note, for ex-ample, that when Hindi speakers are miscatego-rized, they are overwhelmingly identified as Telugu speakers and vice versa. Importantly, Hindi and Telugu are both languages of India, but they belong to separate language families. Thus, L1 in-fluence appears to overlap with other background variables that, together, allow texts to be grouped reliably. To the extent that this is true, the term NLI might be somewhat misleading. Clearly, NLI research has the potential to contribute a great deal to the understanding of crosslinguistic influence, but it of course also needs to be combined with other types of evidence that demonstrate L1 influ-ence (see Jarvis, 2012).
Acknowledgments
The authors wish to thank the organizers of the 2013 NLI Shared Task for putting together this valuable event and for promptly responding to all questions and concerns raised throughout the pro-cess. We also wish to acknowledge the support of the Belgian Fund for Scientific Research (F.R.S-FNRS); Yves Bestgen is a Research Associate with the F.R.S-FNRS. Additionally, we acknowledge the support of the University of Bergen’s ASKeladden Project, which is funded by the Nor-wegian Research Council (NFR).
References
Yves Bestgen, Sylviane Granger, and Jennifer Thewis-sen. 2012. Error patterns and automatic L1 identifica-tion. In Scott Jarvis and Scott Crossley (Eds.), Approaching Language Transfer through Text Clas-sification: Explorations in the Detection-based Ap-proach (pp. 127–153). Multilingual Matters, Bristol, UK.
Daniel Blanchard, Joel Tetreault, Derrick Higgins, Aoife Cahill, and Martin Chodorow. 2013. TOEFL11: A Corpus of Non-Native English. Educa-tional Testing Service, Princeton, NJ.
Serhiy Bykh and Detmar Meurers. 2012. Native lan-guage identification using recurring n-grams— Investigating abstraction and domain dependence. Proceedings of COLING 2012: Technical Papers (pp. 425-440).
Susan Dumais 1991. Improving the retrieval of infor-mation from external sources. Journal Behavior Re-search Methods, Instruments, & Computers, 23:229– 236.
Rong-En Fan, Kai-Wei Chang, Cho-Jui Hsieh, Xiang-Rui Wang, and Chih-Jen Lin. 2008. LIBLINEAR: A library for large linear classification. Journal of Ma-chine Learning Research, 9:1871–1874. (LIBLINEAR available at http://www.csie.ntu.edu.tw/~cjlin/liblinear).
Sylviane Granger, Estelle Dagneaux, and Fanny Meunier. 2009. The International Corpus of Learner English: Handbook and CD-ROM, version 2. Presses Universitaires de Louvain, Louvain-la-Neuve, Bel-gium.
Scott Jarvis. 2011. Data mining with learner corpora: Choosing classifiers for L1 detection. In Fanny Meunier, Sylvie De Cock, Gaëtanelle Gilquin, and Magali Paquot (Eds.), A Taste for Corpora: In Honor of Sylviane Granger (pp. 127–154). Benjamins, Am-sterdam.
Scott Jarvis. 2012. The detection-based approach: An overview. In Scott Jarvis and Scott Crossley (Eds.), Approaching Language Transfer through Text Clas-sification: Explorations in the Detection-based Ap-proach (pp. 1–33). Multilingual Matters, Bristol, UK. Scott Jarvis and Scott Crossley. 2012. Approaching Language Transfer through Text Classification: Ex-plorations in the Detection-based Approach. Multi-lingual Matters, Bristol, UK.
Scott Jarvis and Magali Paquot. 2012. Exploring the role of n-grams in L1 identification. In Scott Jarvis and Scott Crossley (Eds.), Approaching Language Transfer through Text Classification: Explorations in the Detection-based Approach (pp. 71–105). Multi-lingual Matters, Bristol, UK.
Moshe Koppel, Jonathan Schler, and Kfir Zigdon. 2005. Automatically determining an anonymous au-thor’s native language. ISI (pp. 209–217).
Helmut Schmid. 1995. Improvements in part-of-speech tagging with an application to German. Proceedings of the ACL SIGDAT-Workshop. Dublin, Ireland. Laura Mayfield Tomokiyo and Rosie Jones. 2001.
You’re not from ‘round here, are you? Naïve Bayes detection of non-native utterance text. Proceedings of the Second Meeting of the North American Chapter of the Association for Computational Lingusitics (NAACL ’01). The Association for Computational Linguistics, Cambridge, MA.
Joel Tetreault, Daniel Blanchard, Aoife Cahill, and Mar-tin Chodorow. 2012. Native tongues, lost and found: Resources and empirical evaluations in native lan-guage identification. Proceedings of COLING 2012: Technical Papers (pp. 2585–2602).
Joel Tetreault, Daniel Blanchard, and Aoife Cahill. 2013. Summary report on the first shared task on na-tive language identification. Proceedings of the Eight Workshop on Building Educational Applications Us-ing NLP. Association for Computational Linguistics, Atlanta, GA.