DEVELOPING INDICATORS FOR
QUALITY IN SYRIAN UNIVERSITIES
1
Dr. Al-Ali, Ibrahim Mohammad and
1
Department of Statistics, Tishreen
2
Faculty of Economics, Tishreen
ARTICLE INFO ABSTRACT
Quality in higher education has become a target for all universities in the world.
outcomes are rapidly taking center stage as the principal gauge of higher education’s effectiveness.
Research has mainly focused
provide a sufficient attention to the outcomes (the level of graduates). In order to address this issue, we developed some possible indicators to evaluate the quality of education out
classes, faculty,
(SLO). We were able to adopt several indicators that rely on calculating the means and ratios of students' degrees in courses, classe
indicators to assess the quality of learning outcomes for graduates and distinguished students, and estimate the ratio of distinction using special calculations for graduates and distinguished s
Copyright © 2015 Dr. Al-Ali, Ibrahim Mohammad and Dr. Laila
License, which permits unrestricted use, distribution, and reproduction in any medium, provided the original work is properly cited.
INTRODUCTION
Outcomes assessment requirements and methodologies in higher education have evolved considerably. Colleges universities should be actively engaged in assessing learning at all levels of the institution, focusing on graduate as well as undergraduate education, on the classroom and course as well as the program and degree. There is a paradigm shift relates to the conception of higher education outcomes. Increasingly, the focus is moving away from input-based conceptions (number of classes taken, study time and student workload) towards outcome-based notions of higher education throughput (Tremplay, 2012), as described by Chung (2011) in the context of engineering education:
Under the impact of globalization and the coming of the Information Age, there is a paradigm shift occurring in the academic structure. The approach and orientation have been
shifted from objective-based/input-based education to
outcome-based education (Chung, 2011). This shift has been most evident in Europe where the Bologna Declaration of 29 European ministers of education in June 1999 stated as a key
*Corresponding author: Dr. Laila, M. Al-Taweel Faculty of Economics, Tishreen University, Syria.
ISSN: 0975-833X
Article History:
Received 19th February, 2015
Received in revised form
20th March, 2015
Accepted 27th April, 2015
Published online 31st May,2015
Key words:
Student learning outcomes, Outcomes quality, Quality indicators, Evaluation methods, Quality in universities.
Citation: Dr. Al-Ali, Ibrahim Mohammad and Dr. Laila
outcomes quality in Syrian universities”, International Journal of Current Research
RESEARCH ARTICLE
INDICATORS FOR ASSESSING STUDENT LEARNING OUTCOMES
QUALITY IN SYRIAN UNIVERSITIES
Ali, Ibrahim Mohammad and
*,2Dr. Laila M. Al-Taweel
Department of Statistics, Tishreen University and Private University of Andalus, Syria
Faculty of Economics, Tishreen University, Syria
ABSTRACT
Quality in higher education has become a target for all universities in the world.
outcomes are rapidly taking center stage as the principal gauge of higher education’s effectiveness.
Research has mainly focused on the quality of inputs and processes in higher education, but does not provide a sufficient attention to the outcomes (the level of graduates). In order to address this issue, we developed some possible indicators to evaluate the quality of education out
classes, faculty, and university) by analyzing students’ grades as proxies of student learning outcomes (SLO). We were able to adopt several indicators that rely on calculating the means and ratios of students' degrees in courses, classes, faculty, and university. In addition, we provided suitable indicators to assess the quality of learning outcomes for graduates and distinguished students, and estimate the ratio of distinction using special calculations for graduates and distinguished s
Ibrahim Mohammad and Dr. Laila M. Al-Taweel. This is an open access article distributed under the Creative Commons Att use, distribution, and reproduction in any medium, provided the original work is properly cited.
Outcomes assessment requirements and methodologies in higher education have evolved considerably. Colleges and universities should be actively engaged in assessing learning at all levels of the institution, focusing on graduate as well as undergraduate education, on the classroom and course as well There is a paradigm shift relates to the conception of higher education outcomes. Increasingly, the based conceptions (number and student workload) towards based notions of higher education throughput escribed by Chung (2011) in the context
Under the impact of globalization and the coming of the Information Age, there is a paradigm shift occurring in the academic structure. The approach and orientation have been
based education to
This shift has been most evident in Europe where the Bologna Declaration of 29 European ministers of education in June 1999 stated as a key
Taweel, .
objective for Europe to establish a European Higher Education Area (EHEA) by 2010 and committed to write all higher education modules and programmes in terms of learning outcomes by that date (Bologna Secretariat, 1999). The Bologna Declaration has now been endorsed by 47 countries around the world. In addition, many countries outside the Bologna Process are aligning their higher education systems to be Bologna-compatible so as to facilitate
qualifications, mutual recognition of degrees, and student mobility (Kennedy, 2008, cited by Tremplay
Reichert (2010) praises the visionary goals of using learning outcomes and competencies as the structuring principle of all curricula in Europe, but laments that only few countries and HEIs have embraced this approach.
Barr and Tagg, (1995) argued from an ”instruction paradigm” on delivering lectures and providi
learn – towards a ”learning paradigm” in which the emphasis is no longer on the means but on the end, i.e. supporting the learning process of students:
We are beginning to recognize that our dominant paradigm mistakes a means for an end. It takes the means or method called "instruction" or "teaching"
International Journal of Current Research Vol. 7, Issue, 05, pp.16039-16051, May, 2015
INTERNATIONAL
Ibrahim Mohammad and Dr. Laila M. Al-Taweel 2015. “Developing indicators for
International Journal of Current Research, 7, (5), 16039-16051.
ASSESSING STUDENT LEARNING OUTCOMES
Taweel
University and Private University of Andalus, Syria
Quality in higher education has become a target for all universities in the world. Student learning outcomes are rapidly taking center stage as the principal gauge of higher education’s effectiveness.
on the quality of inputs and processes in higher education, but does not provide a sufficient attention to the outcomes (the level of graduates). In order to address this issue, we developed some possible indicators to evaluate the quality of education outcomes (in courses, and university) by analyzing students’ grades as proxies of student learning outcomes (SLO). We were able to adopt several indicators that rely on calculating the means and ratios of s, faculty, and university. In addition, we provided suitable indicators to assess the quality of learning outcomes for graduates and distinguished students, and estimate the ratio of distinction using special calculations for graduates and distinguished students.
is an open access article distributed under the Creative Commons Attribution use, distribution, and reproduction in any medium, provided the original work is properly cited.
objective for Europe to establish a European Higher Education Area (EHEA) by 2010 and committed to write all higher education modules and programmes in terms of learning e (Bologna Secretariat, 1999). The Bologna Declaration has now been endorsed by 47 countries around the world. In addition, many countries outside the Bologna Process are aligning their higher education systems to compatible so as to facilitate description of qualifications, mutual recognition of degrees, and student mobility (Kennedy, 2008, cited by Tremplay et al., 2012). Reichert (2010) praises the visionary goals of using learning outcomes and competencies as the structuring principle of all curricula in Europe, but laments that only few countries and HEIs have embraced this approach.
that higher education is shifting from an ”instruction paradigm” – characterized by an emphasis on delivering lectures and providing students with the means to towards a ”learning paradigm” in which the emphasis is no longer on the means but on the end, i.e. supporting the
We are beginning to recognize that our dominant paradigm for an end. It takes the means or method-called "instruction" or "teaching" - and makes it the college's
INTERNATIONAL JOURNAL OF CURRENT RESEARCH
end or purpose. …. We now see that our mission is not instruction but rather that of producing learning with every student by whatever means work best (Barr and Tagg, 1995). Learning outcomes are key to a meaningful education, and focusing on learning outcomes is essential to inform diagnosis and improve teaching processes and student learning. While there is a long tradition of learning outcomes’ assessment within institutions’ courses and programmes, emphasis on learning outcomes has become more important in recent years (Tremplay et al., 2012).
Assessment of student learning outcomes (SLO) at the program level can either be direct, focusing on actual student work (essays, exams, nationally normed tests) where we look for evidence that learning has been achieved, or indirect, where we look for signs that learning has taken place through proxies or such “performance indicators” as surveys, focus groups, retention or transfer rates, etc. Both methods of assessment can be valuable, and in fact the assessment experts agree that no single assessment method should ever be relied on exclusively. The first step to any assessment plan is to define the student learning outcomes for the program (or course) under consideration: the things we want students to be able to do (or think or know) by the time they’ve finished a course of study.
In recent years, the usefulness of passing grades as indicative of the amount and quality of student learning has been questioned by various higher education stakeholders based on the national phenomena of grade inflation, the potentially great variability between instructors in terms of how grades are assigned, and the belief that grades are too global an indicator to provide the type of detailed feedback that is required for individual or program level improvement. Assigning grades in individual courses is still important, but no longer endorsed by accrediting agencies as sufficient independent evidence of learning quality. The availability of other, direct types of evidence is critical.
Judgments regarding educational quality and institutional effectiveness within higher education have been based heavily on informal perceptions of institutional characteristics, reputation, and resources. Students’ grades, as a direct assessment of actual student work, have also figured prominently, however, these grades need to be analyzed to insure that they are good indicators of students learning outcomes (SLO). This paper develops a range of formulas to analyze the grades of students in Syrian universities to evaluate their role as proxies of students' performance or learning. The following is classified into eight sections. Section II provides a literature review, Section III presents the research design, Section IV introduces the education system characteristics in Syria, Section V discusses measurement techniques of higher education quality, Section VI presents formulas for measuring SLO, Section VII discusses the results, and finally Section VIII provides a conclusion.
Literature Review
Education is a complex business with many interacting dimensions of quality in many varied contexts. To understand what is going on, it is necessary to have a way of conceiving of the variables involved and of organizing and interpreting studies of the relationships between these variables. Some
researchers adopt the commonly used ‘3P’ model (Biggs, 1993), which approaches education as a complex system with ‘Presage’, ‘Process’ and ‘Product’ variables interacting with each other. The ‘3P’ model is essentially the same as that used by large-scale studies in the US (e.g. Astin, 1977, 1993): the ‘input-environment-output’ model. Presage variables are those that exist within a university context before a student starts learning and being taught, and include resources, the degree of student selectivity, the quality of the students, the quality of the academic staff and the nature of the research enterprise. None of these presage variables determine directly how the educational process may be conducted, although they often frame, enable or constrain the form education takes.
Process variables are those that characterize what is going on in teaching and learning and include class size, the amount of class contact and the extent of feedback to students. Process variables also include the consequences of variables such as class size for the way students go about their learning, e.g. how those variables impact on the quantity and quality of their study effort and their overall level of engagement. Product variables concern the outcomes of the educational processes and include student performance, retention and employability. Products can also include psychometric measures of generic outcomes of higher education, such as students’ ability to solve problems. In some studies the key product measure is not student performance, but educational gain: the difference between performance on a particular measure before and after the student’s experience of higher education.
Quality is often described as the totality of features and characteristics of a service that bear on its ability to satisfy stated or implied needs. Quality in higher education, according to Article 11 of the World Declaration on Higher Education published by the United Nations, is a multi-dimensional concept, which should embrace all its functions and activities: teaching and academic programmes, research and scholarship, staffing, students, buildings, faculties, equipment, services the community and the academic environment. An educational definition of quality is that of an ongoing process ensuring the delivery of agreed standards. These agreed standards should ensure that every educational institution where quality is assured has the potential to achieve a high quality of content and results. Bergquist (1995) proposed that a comprehensive and useful definition of quality in higher education must include all four sets of criteria: input, output, value-added, and process-oriented. The four sets of criteria must be considered equally important in developing a modern definition of quality for education. The four sets of criteria are as follows (Maguad, 2010):
Input criterion
Focuses on the nature and level of resources available to the institution like the characteristics of incoming students, credentials of faculty, size of library, structure and availability of physical facilities, and the amount of financial reserves.
Output criterion
Stresses the nature and extent of institutional products, characteristics of graduating students, success of alumni, research and scholarly publications, and public service.
Value-added criterion
Zeroes on the differences that an institution has made in the growth of all of its members: intellectual, moral, social, vocational, physical, and spiritual.
Process-oriented criterion
Includes the level and manner of participation of all appropriate constituencies (or stakeholders) in the educational, administrative, and governance processes of the institution, including the defining and assessing of quality.
As the definition indicates, the “output criterion” is the accomplishment of the education institution mission, and the very important of its mission is the characteristics of graduating students (outcomes). “Quality is the extent to which an institution successfully directs adequate and appropriate resources (input) to the accomplishment of its mission-related outcomes (output) and that its programs make a significant and positive difference in the lives of people associated with it (value-added) and that these programs are created, conducted, and modified in line with the mission and values of the institution (process)” Bergquist (1995, p.43). In the UK the measure most commonly used to indicate the quality of the outcome of higher education is the proportion of students gaining upper second class or first class degrees. The proportion of students who gain ‘good degrees’ has increased very markedly over time, although unevenly across institutions and subjects (Yorke, 2009). Hesuggests a whole list of reasons why this counter-intuitive phenomenon has occurred. For example, the proportion of assessment marks derived from coursework has increased and coursework usually produces higher marks than examinations (Gibbs and Lucas, 1997).
The key problem appears to be that there has been little to stop grade inflation. The external examiner system has not proved capable of maintaining the standards that are applied by markers to whatever quality of student work is being assessed. As a consequence degree classifications cannot be trusted as indicators of the quality of outcomes (Gibbs, 2010). It has been argued that there is no longer any meaningful sense in which degree standards are comparable (Brown, 2010). There has been persistent criticism of the meaning and interpretability of degree classifications as indicators of educational outcomes (e.g. House of Commons, 2009) and these arguments have been largely accepted, e.g. by the QAA (2006), and so the arguments will not be rehearsed here. What is clear is that degree classifications do not currently provide a sound basis for indicating the quality of educational outcomes.
The evaluation of outcomes is one of the most important elements of higher education. This evaluation has a profound effect on students’ future careers. It is therefore important that evaluation is carried out using objective quantitative methods and that it takes into account the extensive knowledge which exists about testing and examination processes. Evaluation also provides valuable information for institutions about the
effectiveness of teaching and learners’ support. Most studies
that discussed quality issues in higher education focused on the importance of its requirements mainly in the inputs and processes. Those studies developed various questionnaires
instruments to evaluate higher education quality. However, they did not consider the outputs quality issues. Therefore, this research will develop some formulas to assess student learning outcomes. However, before we proceed it is important to discuss the definitions of education quality and learning outcomes quality.
Education quality
Asingular view of quality is not representative of the aried and sometimes conflicting views of stakeholder groups: “The key issue is the ability of the quality concept to facilitate the perspective of a range of stakeholders who have different conceptions of higher education” (Cullen, Joyce, Hassall & Broadbent, 2003, p. 6). For example, in determining whether or not their educational experience has met their expectations, students are most likely to judge qualityas fitness for purpose, while faculty members are apt to measure quality in terms of inputs and outputs, such as research and productivity, number of publications, number of courses taught, etc., or outcomes such as improved student learning. In contrast, external stakeholders such as government and the public would almost certainly agree that quality equals value for money and doing more with less. Moreover, because the two university mainstays of research and teaching differ in terms of purpose, process and outcomes, they require different approaches to quality assurance (Marshall, 1998). In light of this, it is not surprising that Harvey and Green (1993) suggest that the only practical solution to this “complex philosophical question” is to recognize and validate all of these diverse perspectives and reject the possibility of accepting a singular definition of quality. Following Nicholson (2011), quality is operatioalized in several ways including: (a) fitness for purpose (mission), (b) exceptional, and (c) value-added. For example, the criteria for the evaluation of new undergraduate and graduate programs, which include “consistency of the program with the institution’s mission and academic plans” and “clarity and appropriateness of the program’s requirements and associated learning outcomes in addressing the institution’s own undergraduate and graduate.
Learning Outcomes Qualit
Although outputs and performance are predominantly institution-level terms, outcomes are only visible by aggregating what happens to individual students. An outcome, therefore, can be most broadly defined as something that happens to an individual student (hopefully for the better) as a result of his or her attendance at a higher education institution and/or participation in a particular course of study (CHEA, 2001).
Indeed the learning quality of outcomes is a result of interactive dimensions by various parties: university and faculty administration, curriculum, faculty members, students, scientific sources, laboratories, examination system, and evaluation techniques. All these parties have a kind of responsibility to achieve outcomes quality. However, students have the final responsibility because all efforts pour on them. As much as their desire and eager in commitment attendance and caring about distinction and competitiveness, they achieve good learning and record good quality.
Research Design
Research Problem
The task of education has become to graduate the maximum number of students without paying much attention to learning gain. This method causes a regression in higher education in the entire world. This problem was raised because of the imbalance between the quality and the quantity of university outputs. That is why there is a call for achieving quality in higher education and improving the human cadre. In Syria, the percentage of successful students is calculated without mentioning the proportion of good degrees. At the same time presage and process indicators of quality (such as funding per student, the quality of universities, the outcomes quality is calculated by the percentage of successful student intake, class size, amount of close contact with teachers and amount of feedback on assignments) have underestimated. Previous studies did not provide reliable quantitative tools for measuring student learning outcomes in courses, classes, Facultyand University.
Research problem can be expressed in two questions
How student learning outcomes quality could be measured?
To what extent these measures are reliable for measuring student learning outcomes quality?
Research Importance
The importance of this paper comes from developing quantitative tools to measure student learning outcomes quality, since learning quality has become the key factor in evaluating, classifying, and ranking universities in the world, and gives universities high reputation and a good position in the world.
Research Objectives
This research aims to develop formulas to measure students learning outcomes quality in courses, classes , faculty and university, and analyzing students' grades using these formulas to assess their reliability as proxies of learning quality.
Research Methods
A deductive approach is used to study possible coefficients (indicators or formulas) and comparing them to find the most suitable indicators. Students’ grades were collected from their records in the examination department in the Faculty of Economics at Tishreen University, and from their records in the National Medical Examination. Based on data collected, formulas were provided and results were compared.
Educational System Characteristics in Syria
The Ministry of Higher Education in Syria was established in 1966 to supervise the scientific and educational institutions, such as, universities, academic councils, and educational hospitals. Most post-secondary education is state provided, but legislation passed in 2001 allows the establishment of some private universities and colleges. Resources for education have
risen in absolute terms over the past decade, but it is difficult to match the rate of population growth.
Domestic policies emphasize engineering and medicine in Syrian universities, with less emphasis on arts, law, and business. Most universities in Syria follow the French model of higher education. Universities in Syria award a Bachelor
degree, Master degree, and Ph.D degree. Students need to pass
6 years in medicine faculties, 5 years in engineering faculties, and 4 years in other faculties (e.g. science; economics, arts; education; and law). Semester system is followed; there are two semesters in each academic year. The period of each semester is 16 weeks. After each semester, there is an examination for 3 weeks. The requirement for doing exams is to attend courses (attendance percentage should be not less than 70%).The number of courses in each semester ranges from 6 to 7 courses. Courses total ranges from 70 to 80 in the faculty. Each course has 4 to 6 hours weekly (Universities Organization Law, 2006).
Each course has a 100 degree. The minimum degree for passing the courses is 60 for applied faculties. Thus, the degrees of students are distributed within the range [0,100]. But the degrees of passing student would be distributed within the range [60, 100]. Student would not move to the higher year if he failed in more than 4 courses. For graduation, students should pass all the courses in the faculty. The general rate of the students is calculated by dividing the total degrees of the student by the number of courses in the faculty (or the mean of yearly ratios).(Used) the following scale presented in Table 1 to evaluate the level of quality.
Table 1. A scale used for evaluating the level of quality
Value Less than 50 [50 – 60] [60-70] [70-80] [80-90] [90-100] Rank weak accepted Moderate Good very good excellent
Measurement Techniques of Higher Education Quality
For evaluating education or services quality, some research centers distribute questionnaires to lecturers, directors, students, society institutes, or beneficiary organizations. They were asked to give their opinion about the quality of courses, or of faculties, or of the university. Other researchers tried to measure education quality using one of the following techniques (Brennan et al., 1997):
Expectations technique (from the management perspective): this technique evaluates the education quality using the following formula:
Education or service quality = Actual performance level - Expectation level .…....……….. (1)
Although this formula appears to be elaborated, but it falls inan estimation gap between two levels (actual and expected) from the perspective of one of the various parties. Therefore, this process is uncontrolled and influenced by personal views, and by the knowledge and interest of those parties. Thus, it does not give correct results about education quality level.
Actual performance technique (from the perspective of beneficiaries): it is based on estimating the degree of education quality (without expectations), using the following formula:
Education or service quality = Actual performance level as estimated by dealers ……….. (2)
Although this technique is considered practical and simplified measurement, and supported by important parties in society and market, it suffers from being influenced by personal views, knowledge and interest of dealers in the market and university. Thus, evaluations are biased, or not objective. This is due to that most respondents do not pay their attention to the precise answer, further the questions themselves do not concentrate on the real specifications of the education outputs. Therefore, for measuring the student learning outcomes quality, the following section proposed some formulas to measure student learning outcomes.
A proposed Technique
To evaluate learning outcomes quality we will turn to another technique based on studying and analyzing the marks and ratios gained by students through theoretical and practical examinations. We will try to deduce a quantitative measurement expressed the learning quality in courses, classes, faculty and in the university.
Based on preliminary conceptions for students outcomes quality, we define learning outcomes quality as follows:
……… (3)
Accordingly, we will search for a suitable mathematical tool to measure this quality.
Frequency Distribution of Students’ Degrees
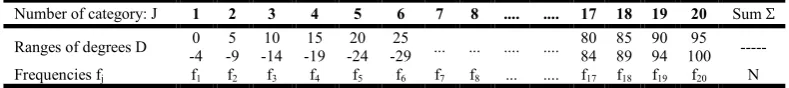
As mentioned above, the maximum degree of the student is 100. If we express the degree by D, then D is a random variable takes its possible values within the range [0,100], and its frequency would be within this range. But the shape of this frequency would be normal, or skewed to the right or to the left. It would also have one top, or two tops, or many tops. In general we can put the actual frequency for students’ degrees in the course after classifying it into fifth- categories within the total range [0,100] in Table 2 as follows:
However, since the minimum degree for passing is 60%, we propose and believe that the effort of all lecturers, students, and administration would focus on getting over that minimum level and having a good degree in the course. Thus, we propose that the general shape of the empirical frequency for students’ degrees would be skewed to the left and defined by
the range [0,100], and would take the shape presented in Figure 1.
Figure 1. Students’ degrees frequency distribution
VI-2 The Possible quantitative Indicators to Measure (assessment) Learning Outcomes Quality in the Courses and its properties
It is possible to evaluate the education outcomes quality in courses using many statistical indicators. Before presenting these indicators, some properties should be achieved to express the quality of learning outcomes. The most important properties are as follows:
The indicator should not depend only on the number or ratio of passing students.
The indicator should be based on the actual degrees of the
students in examinations.
The indicator should be easy calculated and expresses the real learning outcomes quality.
Its possible values should be within the range [0,100].
It should take into account the extreme positions of
frequency distribution.
The Indicators that could be used in measuring or evaluating the learning outcomes quality of courses, which is specified by 100 degree, is:
Actual success percentage: it is calculated by the formula:
……….(4)
Where n is the number of students doing the examination, and m is the number of passing students in the course.
We can observe that this percentage does not represent the learning outcomes quality in courses, because it is only based on the number of passing students and the number of students doing the examination.
[image:5.595.98.493.630.674.2]It does not consider the degrees gained by students, or the frequency shape for these degrees. Thus, we do not recommend using it in the evaluation process, because it takes a very high value when most of the students pass the exams with low degrees or near 60%. Median of degrees: it is the
Table 2. Students degrees classified into 20 fifth-categories
Sum Σ
20 19 18 17 .... .... 8 7 6 5 4 3 2 1 Number of category: J
--- 95 100 90 94 85 89 80 84 .... .... ... ... 25
29 -20
24 -15
19 -10
14 -5
9 - 0
4 - Ranges of degrees D
N f20
f19
f18
f17
.... ... f8
f7
f6
f5
f4
f3
f2
f1
Frequencies fj
value (Me) which divides the categorized students’ degrees into
two equal parts. It is calculated using the formula:
………(5)
Where:
Dm is the minimum boundary to the median range and dm its
long.
nm is the corresponding frequency to the median range and n is
the number of students doing examination.
Km-1 is the ascending aggregated frequencies of the ranges
coming before the median range.
Even though this indicator is better than success percentage, because it takes into account the frequency shape, however it does not take students’ degrees in the calculation. Rather it relies on the number of degrees located on its left and its right. Thus, it portrays (misrepresentation) of learning quality when most degrees centered in one category.
Median and Two Quartiles: they are defined by the following formula:
………..(6)
Where: Q1 is the value of the first quartile, Q3 is the value of
the third quartile ,andMeis the median..
Again, it does not take into account students’ degrees, and it relies on students number located on the left, the right, and the middle. It is better than median indicator and success percentage.
Mean of Students’ Degrees: it is expressed by , and it is calculated using the following formula:
Course Mean = ( )
If we refer to the degree of student in a course examination as Di , and to the number of students doing the exam as n, then
the course mean is calculated for single data or grouped data by the following formula
=∑ =∑
∑ … … … (7)
Where, Dj is the range center j for actual grouped degrees, fj is
the number of frequencies corresponding it, and Σfj= n.
This indicator takes into account all actual degrees gained by both succeed and failed students. It actually expresses the level of students learning gain and the education outcomes quality in the course, provided that all conditions of inputs and processes are convenient and exactly controlled.
Course Degrees Ratio
We will refer to it by R, and we will call it “course ratio”. It is calculated according relationship (3) by the following formula:
(Using the same symbols above), the course ratio R is calculated for single data or grouped data by the following formula:
……(8)
We observe here that this indicator totally matches the proposed definition of learning outcomes quality in the relationship (3). It actually expresses the learning quality for the students doing the examination through the process of teaching and learning in the course. Thus, we can rely on it for quality evaluation in various courses. On the other hand, this indicator differs in the form and the concept from the general mean defined by the formula (7), but it equals it in the value because:
% …..………(9)
Therefore, we found that we can use one of these two indicators (the mean or the ratio) in assessing the quality of courses that have 100 maximum degrees. However, if the maximum degree of the course is not 100, we can replace (100.n) by the relevant value. Hence, we can estimate the quality of outcomes in all cases and in all universities.
Outcomes Ratio of Successful Students
We refer to as r1, it is a special ratio for successful students
(who gained 60 and more). It is defined by the formula:
It is calculated for single data or grouped data as follows:
.…(10)
Where Di is the degree of a successful student i, n1is the
number of successful students in the course, Dj is the range
center j, fJ is the number of corresponding frequencies, and
Σfj= n..
As observed, this ratio expresses only the outcomes quality of successful students, but it does not represent the learning quality in courses because it does not cover the degrees of failed students.
Outcomes Ratio of Distinguished Students: we refer to as r2
which is a special ratio for distinguished students (who gained 75 or more). It is defined for single data or grouped data as follows:
……(11)
where Di is the distinguished student degree i, n2 is the number
of distinguished students in the course, Djis the range center j,
fJ is the number of corresponding frequencies, and Σfj= n.
As observed, this ratio expresses the distinction quality, but it does not represent the learning quality in the course because it does not include other students doing the examination.
Distinction Ratio
We refer to as p, it is a special ratio expressing the percentage of distinguished students outcomes to the graduated students outcomes. It is defined and calculated for single data or grouped data by the following formula:
Distinction Ratio = Total Distinguished Students Degrees ×*100 Total Graduated Students Degrees
………(12)
We observe that this ratio expresses the degree of distinguished students within the successful students in the course, but it does not represent the learning quality in the course, because it does not take into account all the students doing the examination. However, it would be useful in estimating the quality of distinguished students from the successful students or the graduated students, as we will see later.
First Application: the results of the unified medical examination for year 2013 (as typical course):
The Ministry of Higher Education administers a yearly unified examination for graduated students from medical faculties in the private and public Syrian universities. Graduated students from other countries participate also in it. The results of this examination are used to evaluate the learning quality in medical faculties. We will apply and test the indicators mentioned above on the results of the unified medical examination for 2013 to assess its validity as a measurement for learning quality in medical faculties (as typical course):
According to the published data on the web site of the Ministry of Higher Education for 2013 (after excluding the hidden results due to non complete documents), the results are as follows:
Number of students doing the examination: 560
Number of successful students: 506 (success degree is 60 or more)
Number of failed students: 54
Actual success ratio = 90.30%. It indicates an excellent quality!!!!!
Grouped data for the degrees gained by these students within categories of fifth-ranges is presented in Table 3, and The frequent histogram is shown in Figure 2.
VAR00002
97.00 92.00
87.00 82.00
77.00 72.00
67.00 62.00
57.00 52.00
47.00 42.00
37.00 32.00
27.00 22.00
17.00 12.00
7.00 2.00
Value
V
AR00
00
1
140
120
100
80
60
40
20
[image:7.595.317.561.230.344.2]0
Figure 2. Frequent histogram of the unified medical examination results for 2013
Based on data presented in Table 3, we calculated the perevised indicators values, and found the following:
Actual success percentage:
= ∗ 100 =506
560∗ 100 = 90.36 %
This indicates that the quality of education in medical faculties is excellent!!, but this ratio is not valid for measuring learning quality, because it is only based on the number of successful students, and it ignores their degrees in the examination.
Median: it is located in the third range, and it is calculated by the formula (5) as follows:
Table 3. Distribution of Students degrees in the unified medical examination for 2013
No. J
range Corresponding
Frequencies fj
Ranges Centers Dj
Multiplications fjDj
No. J
Range Corresponding
Frequencies fj
Ranges Centers Dj
Multiplications fi Di
1 0-4 0 2 0 11 50-54 15 52 780
2 5-9 0 7 0 12 55-59 27 57 1539
3 10-14 0 12 0 13 60-64 116 62 7192
4 15-19 0 17 0 14 65-69 123 67 8241
5 20-24 0 22 0 15 70-74 117 72 8424
6 25-29 0 27 0 16 75-79 106 77 8162
7 30-34 0 32 0 17 80-84 37 82 3116
8 35-39 0 37 0 18 85-89 6 87 522
9 40-44 3 42 126 19 90-94 0 92 0
10 45-49 9 47 423 20 95-100 0 97.5 0
General total 560 38525
Total of Successful Students (+ 60) 506 35657
Total ofdistinguished Students (+ 75) 149 11800
[image:7.595.40.558.622.768.2]This indicates that the learning quality is moderate in spite of the success ratio equals 90.30%. However, this indicator is limited by ignoring the actual degrees and considering only their distribution on the right and the left.
Median and Quartiles: we calculate it using the Formula (6):
It has a moderate value, but it does not consider students’ degrees.
Course Mean of students’ degrees: it is calculated using the data in Table (3) and the Formula (7) as follows find:
It indicates that the average outcomes of students equals 68.79 % . This means that the education quality is moderate. It seems that this value indeed expresses the learning quality, because it considers all the actual degrees of successful and failed students, and reflects the quality of learning outcomes of students in that examination, although it is very different from success ratio (90.36%).
Course Ratio: it is calculated using the formula (8), and from the data presented in Table (3) find:
It gives us the same value of the mean, and it reflects the (quality) of the overall out comes in that examination. It also expresses the learning quality in medical faculties.
Outcomes Ratio of Successful Students. It is calculated using the formula (10) and the data presented in Table (3):
= ∑
100 ∑ 100 =
35657
100 ∗ 506100 = 70.47 %
It means that successful students had a good ratio in this examination. However, using successful students ratio without including failed students for estimating the learning quality gives us a biased picture.
Outcomes Ratio of Distinguished Students: it is calculated using the formula (11) and the data presented in Table (3):
It is a good value.
Distinction Ratio: it is calculated using the formula (12) and the data presented in Table (3):
VI-3 Possible Indicators for Evaluating(assessment)learning Outcomes Quality in the classes and Faculty or University
Definition of learning Outcomes quality in the faculty
For defining this quality ratio, we must determine the time when we calculate the indicators, and determine also the courses that we rely on in the definition. Therefore, we need the following operational definitions:
The quality of education should be calculated at the end of
each semester, whether the first semester or the second semester.
The courses used in calculating the quality are the basic courses in that semester, without admitting other courses from other semesters.
If there is a third examination period, the quality is calculated based on the results of all courses.
For defining education quality ratio in the faculty, we will use courses ratios that we adopted in education quality evaluation for courses. Based on formula (3), we can conclude a definition for learning quality ratio in classes or in the faculty at the end of each semester as follows:
Learning quality ratio in classes or in the faculty (at the end of semester)
=
total students’ degrees in all basic courses in a semester
× 100 …(13)
total maximum possibility of
students making the
examination of basic courses
It is noticeable that quality ratio in the faculty differs from courses ratios average, because these courses (vary) according to the number of students making the exams. We will deal with this issue for classes, majors, and the faculty.
Notice: this ratio can be calculated using the formula (13) directly and taking the total of students’ degrees for all basic courses in the semester and in all classes and all majors, and then dividing it by the total maximum possibility for them (the total number of students doing the exam × 100). However, it is better to calculate this ratio using the classes and majors to make the assessment and evaluation process easier. Accordingly, we will follow the next procedure.
Calculating learning (outcomes) quality in classes
Let’s suppose that we need to calculate this ratio in one class (common branch or major), and let’s suppose that the number of basic course in that class during the semester is M courses.
The number of students doing the course examination k is nk:
(k: 1, 2, 3, 4…..M)
The degree of student i in the course examination k isDik: (i: 1,
2, 3, 4……, nk)
The total of students’ degrees (successful and failed students) in the course k is Sk: (Sk=∑ )
The general ratio of students’ degrees in the course k is Rk(for
successful and failed students).
From the formula (8) which focuses on courses ratios, we found that the ratio of course k equals Rk, and it is calculated
using the formula:
………(14)
Based on the formula above, we found that the total of students’ degrees in the course k equals:
Based on (14), we also found that the total of students’ degrees (successful and failed students) in all basic courses in a specific semester equals:
The total number of students doing the exam in that class during that semester equals:
The total maximum possibility for these students equals:
Based on that definition presented in formula (13), we can establish a quantitative indicator for learning (outcomes) quality in that class at the end of specific semester using the following formula:
…(15)
where: N is the total number of students doing the exams of basic courses in that class during that specific semester.
The formula (15) gives us a quantitative indicator for measuring learning (outcomes) quality in a specific class. This definition is in agreement with the general technique presented in formula (3). Applying this formula on all classes, we get a special ratio for each class, and accordingly for each major in the given faculty. These ratios present correct scientific base
for evaluating learning (outcomes)quality in the faculty, and help the administration evaluate the education operations.
Calculating learning outcomes quality ratio in the faculty:
For calculating this ratio, we suppose that the number of classes in the faculty (common classes and majors) is H
classes. We give the ratio of class ℓ the symbol Rℓ, where
(ℓ: 1,2,3 …H), and we will give the total degrees of students in all basic courses in class ℓ the symbol , then we will find:
We will give the total number of students doing the exams of the basic courses in the class ℓ the symbol . Then the formula (15) will take the following formula:
Based on the above formula, we find:
Let’s suppose that G is the total students’ degrees in the basic courses in all classes; it equals:
Let’s also suppose that T is the total number of students doing the exams of basic courses in all classes, it equals:
We found that the total maximum possibility for these students equals:
Therefore, we can define a quantitative indicator for evaluating (assessment) the learning outcomes quality in the faculty as a whole using the following formula:
=
100 ∗ 100 = ∑ℓ ℓ 100 ∑ ℓ
100 =∑ℓ ℓ∗ ℓ ∑ℓ ℓ
% … … … . (16)
Where: G is the total students’ degrees in all basic courses and majors in that semester and T is the total number of the students doing exams of that basic courses. We can apply the formula (16) by using the total of multiplications of classes
ratios multiplied by the number of students doing the exams
in the classes Nℓ, then dividing the product by the maximum
possibility for them (Σ Nℓ).
Calculating learning outcomes quality in the university: According to equation (16) we can calculate the learning outcomes quality of final grads in the university as a whole, by adding the ratios of qualities from all faculties in one relationship as follows:
Let’s assume that the number of faculties in the university is L, and the number of students doing exams in all courses in faculty h is Th, and the total students grades is Gh, and the ratio
of learning outcomes quality is Qh, Then the equation (16) can
be presented in the following form:
=
100 100 = … … (17)
The following formulas can be derived from the formula above:
= T ∗ Q
The total grades of these students in the university equals:
=
The total number of students doing the exams equals: ∑
Based on the formula above, we calculate the learning outcomes quality in university as a whole by following formula:
= ∑
100 ∑ 100 =
∑
100 ∑ 100 =
∑
∑ % . (18)
We can apply formula (18) by using the sum of Qh
multiplications that multiplied by the number of students doing the exams in the classes Th, then divide it on the total
student number doing exams in a specific semester.
Second Application: calculating the learning outcome squality ratio in the faculty of Economics at Tishreen University in Lattakia at the end of second semester for the academic year 2013-2014
The examination department in the Faculty of Economics provided us with students’ results during the second semester for the academic year 2013-2014, then we classified these results according to the courses and classes (years) and majors. It also includes the number of students nk, and the total of their
degrees Skin the exams of basic courses during the second
semester for the year 2013-2014. Reading and studying the courses ratios presented in the table enable us to evaluate the learning outcomes quality in each course. Then we calculate the classes ratios using formula (!5) and present them in the last column. By studying them, we can evaluate the learning outcomes quality in each class, and in each major.
[image:10.595.312.556.143.331.2]For calculating the learning outcomes quality in the Faculty of Economics as a whole, we transferred the last column data and ordered it based on the classes as shown in Table 4.
Table 4. Numbers of students, Totals of degrees and Classes Ratios in the Faculty of Economics Source: Examination Department in the Faculty of Economics at Tishreen University
No.
ℓ
Class Total number
of students
doing exams
Total students’ degrees in basic
courses
Classes ratios % by (15)
1 First year 5136 269905 52.55%
2 Second year 4674 228482 48.88%
--- Third year --- --- ---
3 Accounting 1289 78262 60.72%
4 Management 502 33891 67.51%
5 Banking 698 46553 66.69%
6 Economics 90 4293 47.70%
7 Statistics 33 1723 52.21%
--- Fourth year --- --- ---
8 Accounting 909 46429 51.09%
9 Management 344 24003 69.32%
10 Banking 614 23659 38.53%
11 Economics 60 4223 70.38%
12 Statistics 26 2105 80.96%
Total 14375 = T 763528 = G 53.15%
Source: Examination Department in the Faculty of Economics at Tishreen University
By studying the table, we observe that learning outcomes quality ratios differ between classes, and between majors. It ranges from 47.705 % to 80.96%. For calculating learning outcomes quality ratio in the faculty as a whole, we apply the formula (16), and find that:
=
100 100 =
∑ ℓ
100 ∑ ℓ
100 = 763528
100(14375)100 = 53.15 %
This means that learning outcomes quality in the Faculty of Economics during the second semester for year 2013-2014 was 53.15%. This means that it is only at an accepted level. It is due probably to the crisis in Syria in the present time.
Quality of Education Outputs
To define these ratios we follow the same procedure, and we abbreviate them as follows:
Graduation quality ratio: it is a special ratio expresses the graduated students’ learning quality from the faculty (or department) at the end of each year. It is calculated in a way similar to the quality of successful students in the course with some modifications in the names and meanings as follows:
Graduation Quality Ratio =
Total Rates of Graduated Students from the Faculty at the End of the Year
×100 ... (19) Total Maximum Possibility for them (their
total × 100)
The graduation rate for each student is calculated from the following relationship:
Graduation Rate of Student =
total degrees of student in all courses in the faculty
× 100 …. (20) number of courses
To formulate that ratio mathematically, we suppose that the number of graduated students is N, and the rate of graduated student i is ri, and the number of courses in the faculty (or
department) equals L courses. As mentioned above, we found that the student rateri equals:
….(21)
Based on it, we found that the graduated students quality ratio, referred as to Q1, is calculated when the rates are single or
grouped by the formula as follows:
…….(22)
where: ̀ is the range center of category j.We can observe that the ratio Q1really represents the graduated outcomes quality.
Distinguished students’ quality ratio: calculating this ratio gives us an idea about the distinguishing degree within the graduated students’ degrees. We define it using a relationship similar to the relationship presented by the formula (19) as follows:
Distinction quality ratio=
total rates of distinguished graduates at the end of the year
× 100 ...(23) total maximum possibility for
them (their number × 100)
We suppose that the number of distinguished graduates is H, and the rate of distinguished graduate x(who has 75 or more) is rx. As mentioned above, distinction quality ratio, referred to as
Q2, is calculated for single or grouped rates as follows:
……(24)
We observe that the ratio Q2 really represents the distinguished
graduates’ outcomes quality between the graduated students’.
Distinction Ratio
It is the percentage of distinguished students’ outcomes to the graduates’ outcomes, which we refer to as P, and it equals:
Distinction ratio = total rates of excellent students ×100 ….. (25)
total rates of graduated students
Calculating this ratio gives us an idea about the distinction degree between the graduates in the faculty.
Third Application: calculating the graduates quality in the Faculty of Economics at Tishreen University at the end of the academic year 2013-2014
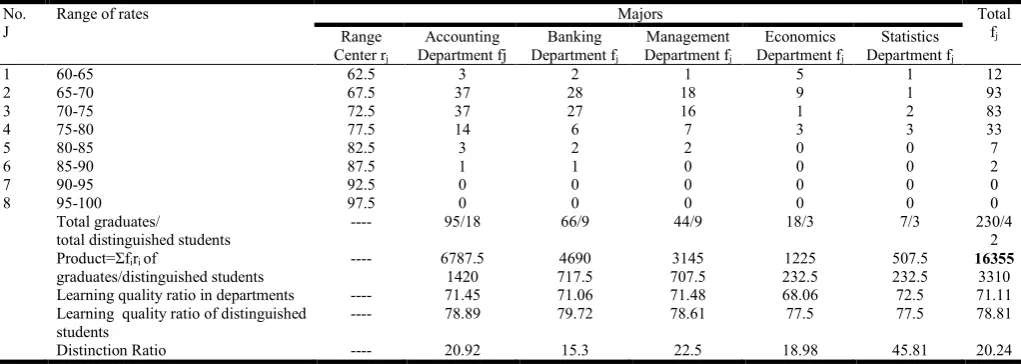
We were provided, by the examination department, by the number and the rates of the graduates according to the majors in the various departments. Grouped data within ranges was shown in Table 5.
As mentioned above, the total of graduates was 230 students, and they were distributed in five departments. Their learning quality ratios at each department are calculated using the formula (22). For calculating the overall learning quality for these graduates, we apply formula (22) using the data presented in the last column. We found that:
[image:11.595.45.556.575.757.2]For calculating learning quality of distinguished students, we apply formula (24), and found that:
Table 5. Frequency distribution of graduates’ ratios for the academic year 2013-2014 according to the department
No. J
Range of rates Majors Total
fj
Range
Center rj
Accounting Department fj
Banking
Department fj
Management
Department fj
Economics
Department fj
Statistics
Department fj
1 60-65 62.5 3 2 1 5 1 12
2 65-70 67.5 37 28 18 9 1 93
3 70-75 72.5 37 27 16 1 2 83
4 75-80 77.5 14 6 7 3 3 33
5 80-85 82.5 3 2 2 0 0 7
6 85-90 87.5 1 1 0 0 0 2
7 90-95 92.5 0 0 0 0 0 0
8 95-100 97.5 0 0 0 0 0 0
Total graduates/
total distinguished students
---- 95/18 66/9 44/9 18/3 7/3 230/4
2 Product=Σfiri of
graduates/distinguished students
---- 6787.5
1420
4690 717.5
3145 707.5
1225 232.5
507.5 232.5
16355 3310
Learning quality ratio in departments ---- 71.45 71.06 71.48 68.06 72.5 71.11
Learning quality ratio of distinguished students
---- 78.89 79.72 78.61 77.5 77.5 78.81
Distinction Ratio ---- 20.92 15.3 22.5 18.98 45.81 20.24
Source: examination department in the Faculty of Economics
For calculating the distinction ratio, we apply formula (25), and we found that:
RESULTS AND DISCUSSION
As mentioned previously, we were able to find specific quantitative indicators for measuring learning outcomes quality in courses, classes, faculties and universities. However, these measurements vary in content and value, and in the representation of quality. After excluding the measures that do not consider the students’ outcomes (such as success ratio, median, and composed median), we classified our accepted measures in this research into five levels as follows:
First Level: learning outcomes quality indicators for courses: we suggest using one of the following two indicators which are based on students’ grades in the courses:
Students’ grades mean (successful and failed students): It is calculated for single or grouped degrees using the following relationship:
where: Σfj=n …….(26)
It gives us an objective value about the learning outcomes quality of students in courses.
Ratio of students’ grades (successful and failed students):It is calculated for single or grouped grades using the following relationship:
where: Σfj=n ……..(27)
It gives us an objective value about the learning outcomes quality of students in that course. This ratio also represents learning outcomes quality level in courses, that’s why we recommend to use it as a quantitative measure of learning quality in courses.
Second Level: learning outcomes quality indicators for classes: we suggest using the measure defined by formula (15), which based on the general ratios of the courses taught during a specific semester (or year) as follows:
% ………..(28)
It is also possible to use the general average instead of the ratio Rk by and calculate it from the following formula:
% ……….(29)
Third Level: learning outcomes quality ratio in the faculty: we can define a quantitative indicator defined by formula (16), for evaluating the learning outcomes quality of(in) the faculty, which based on the general ratios of the classes taught during a specific semester, and using the following formula:
...(30)
Where: G is the total students’ degrees in all basic courses and majors in that semester, and T is the total number of the students doing exams of that basic courses.
Fourth Level: Learning outcomes quality ratio in university: for evaluating the learning outcomes quality in university we suggest using formula (18), which based on the general ratios of the faculties taught during a specific semester, and using the following formula.
= ∑
100 ∑ 100 = ∑
100 ∑ 100 = ∑
∑ % … … (31)
Fifth Level:learning quality measures for outputs: we suggest using the following measures:
Graduation Quality Ratio: it is calculated from formula (22) as follows:
……(32)
where N: number of graduates, Σfj= N, and riis the rate of a
graduated student i.
Distinguished students’ quality ratio (75 or more): it is calculated by formula (24) as follows:
=∑
∗ 100 =
∑ ́
∑ 100 ……...(33)
where H: number of distinguished students, and rxis the rate of
a distinguished student x.
Distinction ratio: it is calculated by formula (25) as follows:
………(34)
Conclusion
summary of a student’s academic achievement. Therefore, this paper makes use of the grading system by developing some formulas to evaluate student learning outcomes. This paper proposed five levels of learning outcomes quality measures, the first for courses, the second for classes, the third for faculties, the fourth for university, and the last for outputs. These quantitative indicators have the advantage of avoiding opinions and attitudes in evaluation of quality in education, and more relying on objective measures.
REFERENCES
ASBBS Annual Conference, Las Vigas, Vol. 17 (1).
Astin, A. 1977. Four critical years. San Francisco: Jossey-Bass.
Astin, A. 1993. What matters in college. San francisco: Jossey-bass.
Barr, R. and J. Tagg 1995. “From Teaching to Learning - A New Paradigm for Undergraduate Education”, Change Magazine, Vol. 27(6), Taylor & Francis Group, Philadelphia, pp. 12- 25 http://ilte.ius.edu/pdf/BarrTagg.pdf Bergquist, W.H. 1995. Quality through access, access with
quality. California: Jossey-Bass Publishers.
Biggs, J. B. 1993. From theory to practice: a cognitive systems approach. Higher Education Research and Development. 12 (1), pp73–85.
Bologna Secretariat 1999. Joint Declaration of the European Ministers of Education, 19 June 1999 http://ec.europe.eu/ education/policies/edu/bolgona.pdf
Brown, R. 2010. Comparability of degree standards? oxford: Higher Education Policy institute. available from: www.hepi.ac.uk/455-1838/comparability-of-degree-standards.html [June 2010].
Chung, C. 2011. “Changing Engineering Curriculum in the Globalised World”, New Horizons in Education, Vol. 59(3), Hong Kong, pp. 59-70.
Council for Higher Education Accreditation (CHEA) 2001. Accreditation and Student Learning Outcomes: A Proposed Point of Departure.
Cullen, J., Joyce, J., Hassall, T. and Broadbent, M. 2003.
Quality in Higher Education: From
Monitoring to Management. Quality Assurance in Education, 11(1), 5-14.
European Association for Quality Assurance (EAQA) in Higher Education, 2009, Helsinki, 3rd edition.
Gibbs, G. 2010. The Assessment of Group Work: Lessons from the Literature. Oxford: Assessment Standards Knowledge Exchange. Available from: www.brookes.ac. uk/aske/documents.
Gibbs, G. and Lucas, L. 1997. Coursework Assessment, Class Size and Student Performance: 1984 94. Journal of Further
and Higher Education, 21 (2), pp183–192.
Harvey, L. and Green, D. 1993. Defining Quality. Assessment and Evaluation in Higher Education, 18(1), 9-34.
House of Commons Innovations, Universities, Science and Skills Committee 2009. Students and Universities. Eleventh Report of Session 2008-09. Volume 1. London: The Stationery Office.
Kohn, A. 2005. Unconditional Teaching, Educational Leadership, 63(1), 20-24.
Lindholm, J. 2009. Guidelines for Developing and Assessing Student Learning Outcomes for Undergraduate Majors, UCLA.
Maguad, B. A. 2010. Deming’s Profound Knowledge’: Implications for Higher Education:
Marshall, S. J. 1998. Professional development and quality in higher education institutions of the 21st century. Australian Journal of Education, 42(3), 321 -334.
Neave, G. and van Vught, F. 1991. Prometheus Bound. Oxford: Pergamon.
Nicholson, K. 2011. Quality Assurance in Higher Education: A Review of the Literature, Council of Ontario Universities Degree Level Expectations Project, McMaster University. Quality Assurance Agency for Higher Education (QAA)
1999a. Code of Practice for the Assurance of Academic Quality and Standards in Higher Education. Section 2: Collaborative Provision.
Reichert, S. 2010. “The Intended and Unintended Effects of the Bologna Reforms”, Higher Education Management and Policy, Vol. 22(1), pp. 59-78, OECD Publishing, Paris. Tremblay, K., Lalancette, D. and Roseveare, D. 2012.
Assessment of Higher Education Learning Outcomes Feasibility Study Report Volume 1 – Design and Implementation, OECD.
Universities Organization Law, 2006, Syria.
World Declaration on Higher Education for the Twenty-First Century: Vision and Action (1998). UNISCO, Paris. Yorke, M. 2009. Trends in Honors Degree Classifications,
1994–95 to 2006–07, for England, Wales and Northern Ireland. York: Higher Education Academy.