A NOVEL OPTIMAL MEDIUM RESOLUTION REMOTE SENSING IMAGE CLASSIFICATION USING
*,1
Ajit Kumar Swain
1
Department of Earth Sciences, Sambalpur University,
2
Applied Geography and Geoinformatics, School of Earth Sciences, Central University of Karnataka,
ARTICLE INFO ABSTRACT
A new neuro
The feature wise degree of belongings of patterns to all classes of the area through a fuzzification is processed.
elements equal to the product of the number of features and classes present in the data set. These matrix elements were the input to neural networks. The effectiveness of the proposed model is established with matrix method
measures supported the superiority of the proposed NF approach model.
Copyright ©2015Ajit Kumar Swain. This is an open access article distributed under the Creative Commons Att distribution, and reproduction in any medium, provided the original work is properly cited.
INTRODUCTION
Image processing usually refers to digital high
resolution image processing. This article is about general techniques that apply to all of them. With the development of earth observation technology, remote sensing data is becoming richer, how to extract meaningful surface information from the mass of remote sensing data has become a problem pressed for solution. Traditional methods of computer classification of remote sensing are based on the statistical analysis of pixel brightness, however, due to the remote sensing data general with the characteristics of integrated spectral, cause computer classification face to a number of fuzzy objects, the accuracy is reduced at last. The Neuro-fuzzy classification system technology can extract meaningful thematic information remote sensing classification system is an intellective method of interpreting remote sensing data, which uses artificial intelligence language. The Neuro-fuzzy classifier is trained with the training data set and it is used in predicting the methods of a program which are not trained. It
develop and simulate neuro-fuzzy Optimization based tools for the problem of medium resolution Remote Sensing image
*Corresponding author: Ajit Kumar Swain,
Department of Earth Sciences, Sambalpur University, Burla, Odisha 768019, India
ISSN: 0975-833X
Article History: Received 10th May, 2015 Received in revised form 15th June, 2015 Accepted 03rd July, 2015
Published online 21st August,2015
Key words: Neuro fuzzy, Remote sensing, Fuzzy logic, Classification
Citation: Ajit Kumar Swain, 2015. “A novel optimal medium resolution remote sensing image classification using
International Journal of Current Research, 7, (8
RESEARCH ARTICLE
A NOVEL OPTIMAL MEDIUM RESOLUTION REMOTE SENSING IMAGE CLASSIFICATION USING
NEURO-FUZZY APPROACH
Ajit Kumar Swain and
2Das, Biswajit
Department of Earth Sciences, Sambalpur University, Burla, Odisha-768019, India
Applied Geography and Geoinformatics, School of Earth Sciences, Central University of Karnataka,
Kalaburagi-585 367, India
ABSTRACT
A new neuro fuzzy approach is proposed for classification of medium resolution remote sensing data. The feature wise degree of belongings of patterns to all classes of the area through a fuzzification is processed. A fuzzification process is generated with a membersh
elements equal to the product of the number of features and classes present in the data set. These matrix elements were the input to neural networks. The effectiveness of the proposed model is established with matrix methods, three neuro-fuzzy models and two remote sensing images. All these measures supported the superiority of the proposed NF approach model.
is an open access article distributed under the Creative Commons Attribution License, which distribution, and reproduction in any medium, provided the original work is properly cited.
Image processing usually refers to digital high and medium resolution image processing. This article is about general techniques that apply to all of them. With the development of earth observation technology, remote sensing data is becoming richer, how to extract meaningful surface information from the emote sensing data has become a problem pressed for solution. Traditional methods of computer classification of remote sensing are based on the statistical analysis of pixel brightness, however, due to the remote sensing data general cs of integrated spectral, cause computer classification face to a number of fuzzy objects, the accuracy is fuzzy classification system eaningful thematic information and em is an intellective method of interpreting remote sensing data, which uses artificial fuzzy classifier is trained with the training data set and it is used in predicting the methods of a program which are not trained. It is practicable to fuzzy Optimization based tools for medium resolution Remote Sensing image
Department of Earth Sciences, Sambalpur University, Burla,
Odisha-Classification and to analyze available models, approaches for the problem. Over the past decade there have been considerable increases in both the quantity of remotely sensed data available and the use of neural networks. These increases have largely taken place in parallel, and it is only recently that several researchers have begun to apply neural networks to remotely sensed data (Atkinson
among the neurons is very high in NNs making them suitable for collective decision making. The main characteristics of NNs, namely, adaptivity, fault tolerance, robustness and optimality play important roles particularly in the field of pattern classification. Both NNs and fuzzy systems are adaptive in the estimation of the input
any precise mathematical model. NNs handle numeric and quantitative information while fuzzy systems can handle symbolic and qualitative data. Apart from this, in a fuzzy classifier patterns are assigned with a degree of belonging to different classes. Thus the partitions in fuzzy classifiers are soft and gradual rather than hard and crisp. Therefore, an integration of neural and fuzzy systems should have the merits of both and it should enable one to build more intelligent decision making systems.
Fuzzy set theory based hybrid classification systems are found to be more suitable and appropriate to handle these situat
International Journal of Current Research
Vol. 7, Issue, 08, pp.19176-19180, August, 2015
OF CURRENT RESEARCH
A novel optimal medium resolution remote sensing image classification using 8), 19176-19180.
A NOVEL OPTIMAL MEDIUM RESOLUTION REMOTE SENSING IMAGE CLASSIFICATION USING
768019, India
Applied Geography and Geoinformatics, School of Earth Sciences, Central University of Karnataka,
fuzzy approach is proposed for classification of medium resolution remote sensing data. The feature wise degree of belongings of patterns to all classes of the area through a fuzzification is A fuzzification process is generated with a membership matrix having total number of elements equal to the product of the number of features and classes present in the data set. These matrix elements were the input to neural networks. The effectiveness of the proposed model is fuzzy models and two remote sensing images. All these measures supported the superiority of the proposed NF approach model.
ribution License, which permits unrestricted use,
to analyze available models, approaches for the problem. Over the past decade there have been considerable increases in both the quantity of remotely sensed data available and the use of neural networks. These increases ly taken place in parallel, and it is only recently that several researchers have begun to apply neural networks to Atkinson and Tatnall, 1997). Interaction among the neurons is very high in NNs making them suitable ision making. The main characteristics of NNs, namely, adaptivity, fault tolerance, robustness and optimality play important roles particularly in the field of Both NNs and fuzzy systems are adaptive in the estimation of the input–output function without any precise mathematical model. NNs handle numeric and quantitative information while fuzzy systems can handle symbolic and qualitative data. Apart from this, in a fuzzy classifier patterns are assigned with a degree of belonging to different classes. Thus the partitions in fuzzy classifiers are soft and gradual rather than hard and crisp. Therefore, an integration of neural and fuzzy systems should have the merits of both and it should enable one to build more intelligent
Fuzzy set theory based hybrid classification systems are found to be more suitable and appropriate to handle these situations
OF CURRENT RESEARCH
reasonably (Kuncheva, 2000 and Pedrycz, 1990).The most common applications of neural networks in remote sensing are considered, particularly those concerned with the classification of land and clouds, and recent developments in these areas are described. Finally, the application of neural networks to multi-source data and fuzzy classification are considered.
MATERIALS AND METHODS
Study Area Details
Himachal Pradesh is in the western Himalayas. Covering an area of 55,673 square kilometres (21,495 sq. mi), it is a mountainous state. Uttarakhand on the southeast, Punjab on the west, China on the east, Haryana on the southwest, and Jammu and Kashmir on North of Himachal Pradesh. It extends from the latitudes 30°22’40” North to 33°12’40” North and longitudes 75°45' 55" East to 79°04' 20" East. The entire region of Himachal Pradesh is hilly with the altitude ranging from 350 meters to 7000 meters above sea level. The altitude increases from west to east and from south to north. Geographically, Himachal Pradesh can be divided into three distinct regions, the Shivalik or outer Himalayas, middle Himalayas or inner Himalayas, and greater Himalayas or the alpine zone.
Satellite Data
The Advanced Wide Field Sensor (AWiFS) camera is an improved version compared to the WiFS camera flown in IRS-1C/1D. AWiFS operates in four spectral bands identical to LISS-III, providing a spatial resolution of 56 m and covering a swath of 740 Km. To cover this wide swath, the AWiFS camera is split into two separate electro-optic modules, AWiFS-A and AWiFS-B. This study uses advanced wide field (AWiFS) sensor data of Resourcesat-1 of Himachal Pradesh as study area, because of large impact on multi-spectral images, taking into account the phonological characteristics remote sensing image of the study area is more favorable for classification. In practical work, the images are collected as the main source of remote sensing data (Figure 1).
Methodology
Classification based on image segments means to classify the image objects according to class descriptions structured in a user-customized knowledge rules base. The knowledge rules base is created by the image segments’ features and the relationship between them. The Neuro-fuzzy classification is done. Users can customize a transparent and adjustable set of classification rules. The rules are defined by using of membership functions or nearest neighbor classifier. Membership functions are especially used to represent each image segment's membership degree to each class. The most remarkable features should be chosen to add to knowledge rules bases, when we set membership functions. Rules cannot be set up too many, as too many rules would not improve the classification accuracy. Nearest neighbor classification uses a set of samples for different classes to define membership values, which is a method of supervised classification. Then, in order to classify imagery and extract ground objects, the Neuro-fuzzy logic classification is processed. Image segment based classification is mostly not aimed at single pixels but meaningful image segments and their mutual relationship. This is the essential difference between image segment based
classification approach and traditional pixel-based
classification. Beyond the pure spectral information, some other essential information like shape, texture, shadow, spatial location and the relevant arrangement attributes are also often used to improve classification results.
Two classification functions are used in this experiment. The first one is a fuzzy classification based on knowledge rules, and the second one is nearest neighbor classification based on samples. After algorithms are determined, the main features of image objects are chosen to describe each class, and samples are selected for each class. Knowledge rules sets are filled by user-defined functions. The result can be improved by reclassifying certain objects. Classification based on separating layers is to identify and classify objects in the images through classifiers designed according to specific regulations. Several identifications can lead to the ultimate classification result, i.e. through a group of separate variants, a complicated data set can be broken down into some coessential subsets. In this way, the classification difficulty can be dramatically lessened. In this paper, the classification is conducted in the following
[image:2.595.54.273.542.727.2]Fig. 1. Resourcesat-1 AWiFS Sensor image of Himachal Pradesh
Fig. 2. Resourcesat-1 AWiFS Sensor Neuro fuzzy classified Image of Himachal Pradesh
Class-1
Class-2
Class-3
Class-4
order: separation of land and water, mudflat retrieval, reed and plough land retrieval and construction land retrieval. For the separation of land and water, the difficulty lies in the sun glitter interference of water. The difficulty of urban and rural land and plough land retrieval comes from vegetation in the spring (Figure 2).
RESULTS AND DISCUSSION
Proposed neuro-fuzzy classification model
In this study it is proposed to develop a neuro-fuzzy approach for medium resolution Remote Sensing image Classification.
(A) Fuzzy Logic
Fuzzy techniques offer powerful tools that efficiently deal with the vagueness and ambiguity of images by associating a degree of belongingness to a particular property. Generally, fuzzy image processing has three main stages: image fuzzification, modification of membership values, and defuzzification. The choice of fuzzification function, contrast operators, and defuzzification function differ depending upon a particular application. Fuzzy set theory provides a host of attractive aggregation connectives for integrating membership values representing uncertain information.
Fuzzy Algorithm
The algorithm proposed by Kumar, Sathish et al. 2010 can be
applied here for overcoming the above methods.
Step 1: Read the given image, and convert it into a matrix form where each pixel value is in the range from 0-255.
Step 2: Apply median filtering to remove noise.
Step 3: Create fuzzy interference system.
Step 4: Decide the number and type of Membership functions for the input image by tuning the membership functions. The following fuzzy rules are used in the proposed algorithm for clustering.
1) If the mean value is low and the standard deviation value
is low then it is not an edge pixel.
2) If the mean value is medium and the standard deviation
value is low then it is an edge pixel.
3) If the mean value is high and the standard deviation value
is low then it is not an edge pixel.
4) If the mean value is low and the standard deviation value
is high then it is not an edge pixel.
5) If the mean value is medium and the standard deviation
value is high then it is not an edge pixel.
6) If the mean value is high and the standard deviation value
is high then it is not an edge pixel.
Step 5: Apply Fuzzification using the rules developed above on the corresponding pixel values of the input image which gives a fuzzy set represented by a membership function. Check the rules using rule viewer and surface viewer.
Step 6: Choose the cluster centers and extract the features.
Step 7: Clustering is done based on similarity measures.
Step 8: Update the membership function and cluster centers.
Step 9: Calculate the cost function and update the weights.
Step 10: Test the stopping condition and convert the column form to matrix form and display the segmented image.
[image:3.595.315.551.266.528.2]At first, the input image is preprocessed using median filter to remove noise and then the membership functions are defined for the filtered image and clusters are formed using fuzziness. Then neighborhood attraction is considered to exist between neighboring pixels. This is considered as a feature for extraction. During clustering, each pixel attempts to attract its neighboring pixels toward its own cluster. This neighborhood attraction depends on two factors; the pixel intensities or feature attraction, and the spatial position of the neighbors or distance attraction, which also depends on the neighborhood structure. Consideration of these neighboring pixels greatly restrains the influence of noise. Finally, the parameters referring to the degree of feature extraction are determined using RBF neural network model (Figure 3).
Fig. 3. Flow Diagram of neuro fuzzy approach (Sathish et al., 2010)
(B) Neural Network
Fig. 4. Flow Chart of Back propagation Neural Network
The important aspect of the RBF Network is the usage of activation function for computing the output, where it uses the Gaussian activation function. The response of such a function is non negative for all values of x.
The function is defined as f(x) = exp
(
X
2)
The training algorithm
Step 1: Initialize the weights.
Step 2: While stopping is false do step 3 to step 10.
Step 3: For each input do step 4 to step 9.
Step 4: Each input unit
X
i ,i
=1----n. Receives input signalsto all units in the layer above (hidden unit).
Step5: Calculate the radial basis function.
Step 6: Choose the center for the RBF, the centers are chosen from the set of input vectors. A sufficient number of centers have to be selected in order to ensure adequate sampling of the input vector space.
Step 7: The output of the unit
V
i(X
i) in the hidden layer andis given as
V
i(X
i) = exp (x
ij^
-)
/
2
ji
x
i2Where
x
ij^
= center of the RBF unit for input variables,
i2= width of the
i
th RBF unit,x
ji
j
th variable of inputpattern
Step 8: Initialize the weights in the output layers of the network to some random value.
Step 9: Calculate the output of the network using
Y
net
w
imi
V
(X
i) +w
0, Where, H= number of hidden layer,net
Y
= output value of them
thnode in output layer for then
thincoming pattern,
w
im = weight betweeni
thRBF unit andm
thoutput node,
w
0= biasing term atm
th output nodeStep 10: Calculate error and test the stopping condition
[image:4.595.334.532.191.275.2](Figure 5).
Fig. 5. Output value of incoming pattern
Objects are classified into different classes respectively by Back Propagation neural network and the improved Fuzzy logic network (Figure 6).
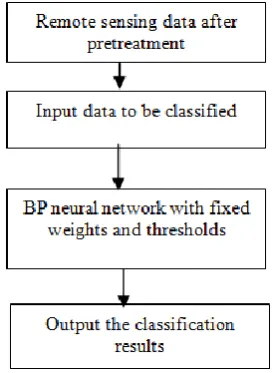
Fig. 6. Flow chart of BP Image Classification
We set the training error 0.05, maximum iterations 10000. If training error is less than 0.05, or maximum iterations times reaches to 10000, training finish. However in the latter circumstance, if training error is still no less than 0.05, then we should modify the network structure, learning rate, momentum constant, or re-select training samples. Training parameters of back propagation neural network are given below (Table 1).
Table 1. Training parameters and values
Training Parameters Values
Hidden layer neurons 24
Momentum constant 0.8
Training error 0.05
[image:4.595.365.504.349.536.2] [image:4.595.326.543.681.732.2]Classification Results of BP Neural Network
When the BP network training success, we get a BP neural network in accordance with the study area of the image (the fixed number of neurons in each layer, the modified weights and thresholds of network connections, the selected learning rate of each layer, the momentum constant). The result will reduce classification precision. The Neuro-fuzzy performance measures to be employed in this approach will approximate the actual image quality. The quality of the enhanced color images can be measured in two ways:
1) An objective and quantitative analysis of color image quality and
2) A subjective visual inspection of the images. The defined entropy and visual factors can be used as the quantitative measure of color image quality.
The fuzzy contrasts for an image are computed by calculating the deviation of the membership values from the crossover point. Two fuzzy contrasts are separately defined for both the underexposed and the overexposed regions. Using the multi-source information to do the experts classification of remote sensing data can effectively improve the classification accuracy, and provide an effective method of land use classification for the complex terrain regions. Test results show that the experts’ system technology can introduce more variables, design the flexible reasonable knowledge base. Remote sensing experts’ system technology for land use classification in mountainous areas has more advantage. Future work in this area is aimed at improving the prediction accuracy of the system by identifying more effective static and dynamic features of a program. Applying this approach, the prediction accuracy of the other machine learning algorithms can be evaluated to build additional models.
Conclusion
A novel neuro-fuzzy model for classification of medium resolution remote sensing data is proposed and demonstrated successfully its effectiveness for classification of fully and partially labeled patterns. Besides these generic advantages, the proposed model develops a membership matrix that provides information of feature-wise degree of belonging of a pattern to all classes instead to a particular class. The computational complexity of the proposed classification model is little high.
However, its learning ability with small percentage of training samples will make it practicably applicable to problems with a large number of classes and features. In future, this NF technique with some other existing NF techniques, in all aspects such as time complexity and classification accuracy will help to find more effective results.
Acknowledgement
Author acknowledges Dr. Jagadish Kumar Tripathy and Mr. Kamal Kumar Barik, faculty of Dept. of earth sciences, Sambalpur University, Burla, Odisha for their critical suggestions.
REFERENCES
Ashish Ghosh, B., Uma S., and Meher, S.K. 2009. A novel approach to neuro-fuzzy classification, Neural networks, 22(1):100–109.
Atkinson, P.M, and Lewis, P. 2000. Geostatistical
Classification for Remote Sensing: An Introduction, Computers & Geosciences, 26, 361-371.
Atkinson, P.M. and Tatnall, A. R. L. 1997. Introduction Neural networks in remote sensing, 18(4), 699-709.
Chavez, P. S. and Kwarteng, A.Y. 1989. Extracting Spectral Contrast in Landsat Thematic Mapper Image Data Using Selective Principal Component Analysis, Photogrammetric Engineering & Remote Sensing, 55(3): 339-348.
Chavez, P., Sides, S.C., and Anderson, J.A., 1991. Comparison of Three Different Methods to Merge Multi-resolution and Multi-spectral Data Landsat TM and SPOT Panchromatic, Photogrammetric Engineering & Remote Sensing, 57(3): 295-303.
Holden, H. and LeDrew, E. 1998. Spectral Discrimination of Healthy and No healthy Corals Based on Cluster Analysis.
Principal Components Analysis, and Derivative
Spectroscopy, Remote Sensing of Environment, 65: 217-224.
Kumar, Sathish S., Moorthi, M., Madhu, M., and Amutha R. An improved method of segmentation using fuzzy-neuro Logic, Second International Conference on Computer
Research and Development.2010. IEEE DOI
10.1109/ICCRD.2010.155.
Mitternicht, G. I. and Zinck, J.A. 2003. Remote Sensing of Soil Salinity: Potentials and Constraints, Remote Sensing of Environment, 85, 1-20.
Sunar, F. and Musaoglu, N. 1998. Merging multi-resolution SPOT and Landsat TM data: the effects and advantages, International Journal Remote Sensing, 19(2): 219-224. Zhao, G., and Maclean, A.L., 2000. A Comparison of
Canonical Discriminate Analysis and Principal Component Analysis for Spectral Transformation, Photogrammetric Engineering & Remote Sensing, 66(7): 841-847.