http://dx.doi.org/10.4236/ajac.2012.31006 Published Online January 2012 (http://www.SciRP.org/journal/ajac)
Fast Determination of 22 Pesticides in Rice Wine by
Dispersive Solid-Phase Extraction in Combination with
GC-MS
Nannan Chen1,2, Hongbo Gao1, Nengsheng Ye2, Qiding Zhong1, Zhenghe Xiong1*, Xuexin Gu2
1China National Research Institute of Food and Fermentation Industries, Beijing, China 2Department of Chemistry, Capital Normal University, Beijing, China
Email: *cnscff@263.net
Received November 3, 2011; revised January 6, 2012, accepted January 16, 2012
ABSTRACT
A rapid method was developed for the determination of 22 pesticides in rice wine. The procedure involved an extraction with acetonitrile and a cleanup step using dispersive solid-phase extraction (d-SPE), and primary-secondary amine (PSA) and octadecylsilane (ODS) were used as sorbents. D-SPE had some advantages over some traditional prepara- tions, especially in time and cost. Both the extraction and cleanup only cost about 15 min per a sample. Then the GC-MS was used for quantitative and qualitative analysis. Matrix-matched standards solution and analyte protectant were compared to decrease the matrix effect, and the former showed a better efficacy. Acceptable linearity was achieved in the range of 0.05 - 0.30 mg/L. After matrix-matched standards calibration, recoveries were between 60% and 140%. For the most of pesticides, precision and repeatability were less than 10% and 16%, respectively. The result indicated that the developed method was suitable for the determination of the multi-pesticides in rice wine.
Keywords: d-SPE; Rice Wine; Pesticide; GC-MS; Matrix Effect
1. Introduction
Rice wine, beer and wine are considered as the three an- cient wines [1]. Rice wine is an alcoholic beverage brewed from rice, and pesticides may be used during the period of rice growth. Rice is directly used for fermentation without any processing, and that causes the presence of pesticide residues in rice wine.
Many reports have been published for the determina- tion of pesticides in alcoholic beverage. Major pretreat- ments of pesticides in food are liquid-liquid extraction (LLE) [2], solid-phase extraction (SPE) [3-6], and solid- phase micro-extraction (SPME) [7,8]. In 2003, dispersive solid-phase extraction (d-SPE) method was introduced for the determination of pesticides by Anastassiades et al.
[9], and d-SPE was a simple and rapid technique with high recovery for the determination of pesticides in fruit and vegetables [10]. In previous studies, the combination of several sorbents showed a better cleanup result than using primary-secondary amine (PSA) alone for some complex samples [11-13]. However, few reports were introduced for the determination of the pesticides in rice wine.
In this study, a rapid method was introduced for the
determination of multi-pesticides in rice wine by GC- MS/SIM. Pesticides in rice wine samples were extracted with acetonitrile and cleaned by d-SPE by using the com- bination of PSA and octadecylsilane (ODS).
2. Experimental
2.1. Reagents and Standards
Acetonitrile (LC grade) was purchased from Merck (Darmstadt, Germany). PSA and ODS were provided by Bonna-Agela Technologies (Tianjin, China). All the stan- dards of pesticide were obtained from Agricultural Envi- ronmental Protection Institution (Tianjin, China), and listed in Table 1. Polyethylene glycol (PEG300) and tri-
phenyl phosphate (TPP) were purchased from SCRC (Beijing, China). Other chemicals were from Beijing Che- mical Works (Beijing, China). All of the rice wines and olive oil were purchased from local supermarkets, and the wine samples were kept in a freezer (2˚C - 4˚C).
2.2. Instrumentation
Separations of pesticides were performed on a gas chro- matography equipped with a mass detector and an auto- sampler (GC-MS 2010 plus, Shimadzu, Japan). The ex-
Table 1. Information of pesticide and IS, retention time (Rt), molecular weight (Mw), quantification and Identification ions.
Quantification and Identification Ions
No. Pesticides Rt Mw
1 2 3
1 Phorate 16.15 260.38 260 121 231
2 α-lindane 16.87 290.83 219 183 221
3 Diazinon 17.91 304.35 304 179 137
4 Pyrimethanil 18.11 199.25 198 199 200
5 Heptachlor 19.21 373.35 100 272 237
6 Chlorpyrifosmethyl 20.23 322.53 286 288 197
7 Chlorothalonil 21.20 265.91 266 264 268
8 Metalaxyl 21.72 279.33 206 249 234
9 Chlorpyrifos 21.81 350.59 314 258 286
10 Methyl-Parathion 21.96 263.21 263 233 246
11 Phenthion 22.48 278.33 278 169 153
12 Malathion 22.65 330.36 173 158 143
13 Parathion 23.49 291.26 291 186 235
14 Quinalphos 24.10 298.30 146 298 157
15 Isocarbophos 24.20 289.29 136 230 289
16 Folpet 25.07 296.66 260 104 297
17 Medathion 25.65 302.33 145 157 302
18 Triazophos 29.48 313.31 161 172 257
19 TPP (IS) 29.76 326.28 326 325 77
20 Phosalone 32.45 367.81 182 367 154
21 Pyridaben 33.25 364.93 147 117 364
22 Fenvalerate 36.18; 36.45 419.90 167 225 419
23 Cypermethrin 38.46 416.30 181 152 180
tractant of pesticides were injected with a splitless mode. DB-1701 capillary column (30 m × 0.25 mm × 0.25
μm) was provided by Agilent (Palo Alto, CA, USA). Helium was used as carrier gas, and the flow rate was kept at 1.2 mL/min. The column temperature was main- tained at 40˚C for 1 min, and then ramped at 30˚C/min up to 130˚C, then at 5˚C/min up to 250˚C, and finally at 20˚C/min up to 280˚C. The injector temperature was 280˚C, the volume of injection was 1 μL. The MS ioni- zation energy was 70 eV, the ion-source temperature was 230˚C, and the interface temperature was set at 280˚C. The MS detection was performed in Selection ion mode (SIM), and the characteristic of pesticides are listed in
Table 1.
2.3. Sample Preparation
TPP (10.00 mg/L, dissolved by acetonitrile) was used as the internal standard (IS) solution, and 100 μL IS solu-tion and 2.4 mL acetonitrile were added into 5.0 mL rice wine sample, and the mixture was vigorously shaken for 2 min. then NaCl (0.50 g) and anhydrous MgSO4 (2.00 g)
were added and then vortexed slightly for 1 min. The
extract was then centrifuged for 5 min at 5000 rpm. An aliquot of 1.0 mL of the upper layer was transferred to a 2.0 mL micro-centrifuge tube containing 50 mg PSA, 50 mg ODS and 150 mg MgSO4, shaken for 2 min, and then
centrifuged for 4 min at 8000 rpm. Finally, 500 μL of extract added 50 μL analyte protectant (prepared as it described by Xu et al. [14]) was placed into an auto-
sampler vial for GC/ MS analysis.
3. Results and Discussion
3.1. Optimization of d-SPE Procedure
3.1.1. Optimization of Sorbents
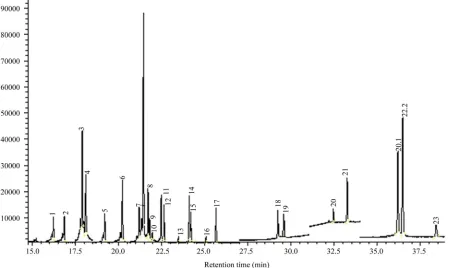
Figure 1. GCB adsorbed some pesticides containing ben- zene ring. Names of pesticides are listed Table 1.
areas of some pesticides reduced when GCB was used as the sorbent of d-SPE. Due to the light color of rice wine, GCB was not necessary. It is important for the cleanup to select an appropriate material as the sorbent. In previous works, some sorbents such as PSA, ODS, anhydrous MgSO4, and GCB, or their combination was selected for
the cleanup of pigments in extracts of wine and grape [18-20]. In this study, the combination of 50 mg PSA, 50 mg ODS, and 150 mg anhydrous MgSO4 was selected
in d-SPE for rice wine extracts cleanup. The SIM chro- matogram of pesticide standards and the internal standard was shown in Figure 2.
3.1.2. Optimization of Temperature and pH
The low temperature minimizes the degradation of some heat-sensitive pesticides [11]. Rice wine and other rea- gents were kept in freezer (4˚C) overnight before sample preparation. Keeping the samples in low temperature during the d-SPE procedure was important.
The pH of samples will be increased when PSA was added and the stability of some alkali-labile pesticides was affected by pH [18]. Two ways were usually taken to resolve the problem, one was acidifying the extracts quickly to pH∼5, and another was the usage of citrate buffer [21]. In this study, rice wine samples were acidity, and the pH of samples was not obviously increased with the addition of 50 mg PSA.
3.2. Matrix Effects
In GC analysis, analyte protectants and matrix-matched calibration solutions were proved to be effective appro- aches to minimizing matrix effect [22]. The effects of analyte protectants were compared by Xu et al. [14], and
the results showed that PEG300 and olive had a better effect. In our study, the combination of PEG300 and olive was used to be the analyte protectant, and the peak
[image:3.595.74.523.439.707.2]areas of pesticides were compared under the three situa- tions (in pure solvent, matrix-matched calibration solu- tions and analyte protectant). As shown in Figure 3, both
analyte protectant and matrix-matched calibration solu- tion can reduce the matrix effect. The former had a better effect on diazinon, fenvalerate and cypermethrin, but for phorate, pyrimethanil, heptachlor, and chlorpyrifosmethyl, matrix-matched solution was better. In our study the me- thod of matrix-matched calibration solution was selected for the minimizing of matrix effect.
3.3. Comparison with Other Preparation
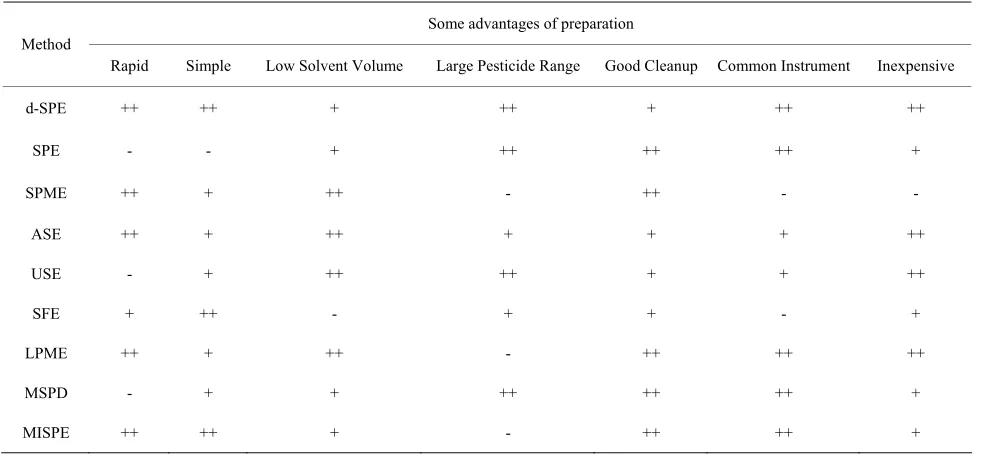
Modern sample preparation techniques should be simple, reliable, cheap, and be similar to common analytical te- chniques, in order to minimize errors [23]. Information of the major methods used for determining pesticides in alcoholic beverages was presented in Table 2.
d-SPE had advantages in time and cost, but SPE and some other methods had a better cleanup.
3.4. Methodology Evaluation
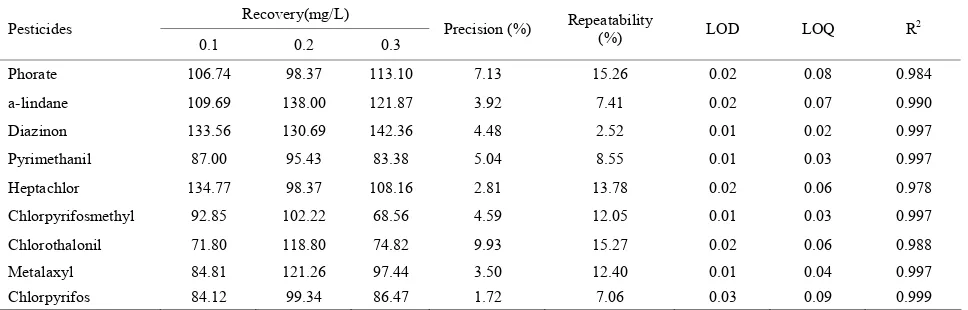
Linearity was investigated in the range 0.05 - 0.30 mg/L with four calibration points, and the correlation coeffi- cients for pesticides were listed in Table 3. Precision was
less than 10%, and the recoveries were from 60% to 140% at three concentration levels (0.10, 0.20 and 0.30 mg/L). A SIM chromatography for blank rice wine sample and spiked rice wine was shown in Figure 4. LOQ, LOD,
and other information were also listed in Table 3.
Figure 3. Comparison of pesticide peak areas in pure sol- vent, matrix-matched standards and adding analyte protec- tant of mixed PEG and olive oil in optimal concentrations. Names of pesticides are listed Table 1.
4. Conclusion
[image:4.595.313.525.87.278.2]In this work, a rapid method was developed for the de- termination of multi-pesticides in rice wine by using d- SPE-GC-MS. The effect of different adsorbents was in- vestigated, and the combination of different adsorbents was used for the d-SPE procedure with a high results. And then the approaches of minimizing the matrix effect were compared. And the developed method can be used for the determination of pesticides in rice wine samples.
Table 2. Information of some preparations.
Some advantages of preparation Method
Rapid Simple Low Solvent Volume Large Pesticide Range Good Cleanup Common Instrument Inexpensive
d-SPE ++ ++ + ++ + ++ ++
SPE - - + ++ ++ ++ +
SPME ++ + ++ - ++ - -
ASE ++ + ++ + + + ++
USE - + ++ ++ + + ++
SFE + ++ - + + - +
LPME ++ + ++ - ++ ++ ++
MSPD - + + ++ ++ ++ +
MISPE ++ ++ + - ++ ++ +
[image:4.595.54.545.480.707.2](a)
(b)
[image:5.595.58.542.580.735.2]Figure 4. SIM chromatography for (a) blank rice wine sample; (b) blank rice wine spiked with 0.3 mg/L of the pesticides. Names of pesticides are on Table 1.
Table 3. Average recovery (%), precision (%, RSD), repeatability (%, RSD), limit of quantitation (LOQ, mg/L), limit of detection (LOD, mg/L) and R2 obtained with the d-SPE method and analyzed by GC/MS. Spiking concentration levels were 0.10, 0.20,and 0.30 mg/L, respectively.
Recovery(mg/L) Pesticides
0.1 0.2 0.3 Precision (%)
Repeatability
(%) LOD LOQ R2
Phorate 106.74 98.37 113.10 7.13 15.26 0.02 0.08 0.984
a-lindane 109.69 138.00 121.87 3.92 7.41 0.02 0.07 0.990
Diazinon 133.56 130.69 142.36 4.48 2.52 0.01 0.02 0.997
Pyrimethanil 87.00 95.43 83.38 5.04 8.55 0.01 0.03 0.997
Heptachlor 134.77 98.37 108.16 2.81 13.78 0.02 0.06 0.978
Chlorpyrifosmethyl 92.85 102.22 68.56 4.59 12.05 0.01 0.03 0.997
Chlorothalonil 71.80 118.80 74.82 9.93 15.27 0.02 0.06 0.988
Metalaxyl 84.81 121.26 97.44 3.50 12.40 0.01 0.04 0.997
Continued
Methyl-Parathion 77.77 102.27 75.50 9.22 7.45 0.08 0.26 0.948
Phenthion 101.85 121.02 107.21 2.64 3.33 0.01 0.04 0.938
Malathion 97.90 107.15 86.07 5.21 2.87 0.01 0.05 0.999
Parathion 101.97 129.60 90.34 7.29 4.69 0.10 0.32 0.976
Quinalphos 94.92 129.80 107.63 3.48 6.40 0.01 0.04 0.995
Isocarbophos 78.02 129.67 87.48 5.37 6.63 0.02 0.06 0.963
Folpet 96.47 124.86 92.83 9.52 15.94 0.09 0.28 0.949
Medathion 74.56 130.19 80.28 5.30 8.54 0.02 0.05 0.908
Omethoate 79.10 122.90 93.17 9.12 8.60 0.02 0.06 0.990
Triazophos 100.37 72.66 92.02 7.70 8.00 0.18 0.59 0.996
Phosalone 91.60 91.11 87.38 8.04 13.74 0.01 0.04 0.980
Pyridaben 94.57 119.28 112.78 9.87 5.37 0.01 0.02 0.984
Fenvalerate 128.72 134.12 113.45 9.58 6.41 0.05 0.16 0.990
5. Acknowledgements
This work was supported by China Spark Program (No. 2010GA700005).
REFERENCES
[1] H. Yu, Y. Ying, X. Fu and H. Lu, “Quality Determination of Chinese Rice Wine Based on Fourier Transform Near Infrared Spectroscopy,” Journal of Near Infrared Spec- troscopy, Vol. 14, No. 1, 200, pp. 37-44.
doi:10.1255/jnirs.584
[2] D. T. Likas, N. G. Tsiropoulos and G. E. Miliadis, “Rapid Gas Chromatographic Method for the Determination of Famoxadone, Trifloxystrobin and Fenhexamid Residues in Tomato, Grape and Wine Samples,” Journal of Chro- matography A, Vol. 1150, No. 1-2, 2007, pp. 208-214.
doi:10.1016/j.chroma.2006.08.041
[3] A. Economou, H. Botitsi, S. Antoniou and D. Tsipi, “De- termination of Multi-Class Pesticides in Wines by Solid- phase Extraction and Liquid Chromatography-Tandem Mass Spectrometry,” Journal of Chromatography A, Vol. 1216, No. 31, 2009, pp. 5856-5867.
doi:10.1016/j.chroma.2009.06.031
[4] J. J. Jimenez, J. L. Bernal, M. J. Del Nozal, L. Toribio and J. Bernal, “Use of SPE—GC/EIMS for Residue Ana- lysis in Wine Elaborated from Musts Spiked with Formu- lations of Chlorpyriphos—Methyl, Methiocarb, Dicofol, and Cyproconazol,” Journal of Separation Science, Vol. 30, No. 4, 2007, pp. 547-556.
doi: 10.1002/jssc.200600345
[5] I. Carpinteiro, M. Ramil, I. Rodríguez and R. Cela, “De-termination of Fungicides in Wine by Mixed-mode Solid Phase Extraction and Liquid Chromatography Coupled to Tandem Mass Spectrometry,” Journal of Chromatogra-phy A, Vol. 1217, No. 48, 2010, pp. 7484-7492.
doi:10.1016/j.chroma.2010.09.080
[6] G. F. Pang, C. L. Fan, Y. M. Liu, Y. Z. Cao, J. J. Zhang, B. L. Fu, X. M. Li, Z. Y. Li and Y. P. Wu, “Multi-Resi-
due Method for the Determination of 450 Pesticide Resi- dues in Honey, Fruit Juice and Wine by Double-Cartridge Solid-Phase Extraction/Gas Chromatography-Mass Spec-trometry and Liquid Chromatography-Tandem Mass Spec- trometry,” Food Additives & Contaminants: Part A, Vol. 23, No. 8, 2006, pp. 777-810.
doi:10.1080/02652030600657997
[7] D. Zhan, R. E. Anli, N. Vural and M. Bayram, “Determi-nation of Chloroanisoles and Chlorophenols in Cork and Wine by Using HS-SPME and GC-ECD Detection,” Jour- nal of the Institute of Brewing, Vol. 115, No. 1, 2009, pp. 71-77.
[8] L. M. Ravelo-Pérez, J. Hernández-Borges, T. M. Borges- Miquel and Má Rodríguez-Delgado, “Solid-Phase Mi- croextraction and Sample Stacking Micellar Electroki- netic Chromatography for the Analysis of Pesticide Re- sidues in Red Wines,” Food Chemistry, Vol. 111, No. 3, 2008, pp. 764-770. doi:10.1016/j.foodchem.2008.04.020 [9] M. Anastassiades, S. J. Lehotay, D. Tajnbaher and F. J.
Schenck, “Fast and Easy Multiresidue Method Employing Acetonitrile Extraction/Partitioning and ‘Dispersive Solid- Phase Extraction’ for the Determination of Pesticide Re- sidues in Produce,” Journal of AOAC International, Vol. 86, No. 2, 2003, pp. 412-431.
[10] J. Dong, X. M. Gong, L. Zhang and H. T. Wang, “Deter-mination of Imidacloprid, Tebufenozide, Avennectins and Hexythiazox in Vegetables by QuEChERS-HPLC,” Chi- nese Journal of Analysis Laboratory, Vol. 3, 2008, pp. 91-94.
[11] S. H. Patil, K. Banerjee, S. Dasgupta, D. P. Oulkar, S. B. Patil, M. R. Jadhav, R. H. Savant, P. G. Adsule and M. B. Deshmukh, “Multiresidue Analysis of 83 Pesticides and 12 Dioxin-Like Polychlorinated Biphenyls in Wine by Gas Chromatography-Time-of-Flight Mass Spectrometry,” Jour- nal of Chromatography A, Vol. 1216, No. 12, 2009, pp. 2307-2319. doi:10.1016/j.chroma.2009.01.091
Wines by Dispersive Solid-Phase Extraction and Ultra- high-Performance Liquid Chromatography-Tandem Mass Spectrometry,” Journal of Agricultural and Food Chem- istry, Vol. 57, No. 10, 2009, pp. 4019-4029.
doi:10.1021/jf9000023
[13] S. C. Cunha, J. O. Fernandes, A. Alves and M. Oliveira, “Fast Low-pressure Gas Chromatography-Mass Spectro- metry Method for the Determination of Multiple Pesti- cides in Grapes, Musts and Wines,” Journal of Chroma- tography A, Vol. 1216, No. 1, 2009, pp. 119-126.
doi:10.1016/j.chroma.2008.11.015
[14] X. Xu, L. Li, W. Zhong and Y. He, “Rapid GC-MS Ana- lysis of Pesticide Residues Using Analyte Protectants,” Analytical Letters, Vol. 42, No. 16, 2009, pp. 2578-2591.
doi:10.1080/00032710903243646
[15] J. M. Lee, J. W. Park, G. C. Jang and K. J. Hwang, “Com- parative Study of Pesticide Multi-Residue Extraction in Tobacco for Gas Chromatography—Triple Quadrupole Mass Spectrometry,” Journal of Chromatography A, Vol. 1187, No. 1, 2008, pp. 25-33.
doi:10.1016/j.chroma.2008.02.035
[16] Y. Jiang, X. Li, J. Xu, C. Pan, J. Zhang and W. Niu, “Multiresidue Method for the Determination of 77 Pes- ticides in Wine Using QuEChERS Sample Preparation and Gas Chromatography with Mass Spectrometry,” Food Additives & Contaminants: Part A, Vol. 26, No. 6, 2009, pp. 859-866. doi:10.1080/02652030902822794
[17] W. Shen, K. Yu, Q. Gui, Y. Jiang, Z. Zhao, C. Shen, B. Wu and X. Chu, “Determination of 107 Pesticide Resi- dues in Vegetables Using Off-Line Dispersive Solid- phase Extraction and Gas Chromatography-tandem Mass Spectrometry,” Chinese Journal of Chromatography, Vol. 4, 2009, pp. 391-400.
[18] P. Payá, M. Anastassiades, D. Mack, I. Sigalova, B. Tas- delen, J. Oliva and A. Barba, “Analysis of Pesticide Re-
sidues Using the Quick Easy Cheap Effective Rugged and Safe (QuEChERS) Pesticide Multiresidue Method in Com- bination with Gas and Liquid Chromatography and Tan- dem Mass Spectrometric Detection,” Analytical and Bio-analytical Chemistry, Vol. 389, No. 6, 2007, pp. 1697- 1714. doi:10.1007/s00216-007-1610-7
[19] C. Lesueur, P. Knittl, M. Gartner, A. Mentler and M. Fuerhacker, “Analysis of 140 Pesticides from Conven- tional Farming Foodstuff Samples after Extraction with the Modified QuECheRS Method,” Food Control, Vol. 19, No. 9, 2008, pp. 906-914.
doi:10.1016/j.foodcont.2007.09.002
[20] T. D. Nguyen, J. E. Yu, D. M. Lee and G. H. Lee, “A Multiresidue Method for the Determination of 107 Pe- sticides in Cabbage and Radish Using QuEChERS Sam- ple Preparation Method and Gas Chromatography Mass Spectrometry,” Food Chemistry, Vol. 110, No. 1, 2008, pp. 207-213. doi:10.1016/j.foodchem.2008.01.036 [21] A. Garrido Frenich, J. L. Martínez Vidal, E. Pastor-
Montoro and R. Romero-González, “High-Throughput Determination of Pesticide Residues in Food Commodi- ties by Use of Ultra-performance Liquid Chromatography —Tandem Mass Spectrometry,” Analytical and Bioana-lytical Chemistry, Vol. 390, No. 3, 2008, pp. 947-959.
doi:10.1007/s00216-007-1746-5
[22] K. Maštovská, S. J. Lehotay and M. Anastassiades, “Com- bination of Analyte Protectants to Overcome Matrix Ef- fects in Routine GC Analysis of Pesticide Residues in Food Matrixes,” Analytical Chemistry, Vol. 77, No. 24, 2005, pp. 8129-8137. doi:10.1021/ac0515576
[23] A. Beyer and M. Biziuk, “Applications of Sample Prepa- ration Techniques in the Analysis of Pesticides and PCBs in Food,” Food Chemistry, Vol. 108, 2008, pp. 669-680.