ISSN Online: 2160-5874 ISSN Print: 2160-5866
DOI: 10.4236/jbbs.2018.810036 Oct. 30, 2018 587 Journal of Behavioral and Brain Science
Predicting Mortality and Functional Outcomes
after Ischemic Stroke: External Validation of a
Prognostic Model
Achala Vagal
1*, Heidi Sucharew
2, Christopher Lindsell
3, Dawn Kleindorfer
4, Kathleen Alwell
4,
Charles J. Moomaw
4, Daniel Woo
4, Matthew Flaherty
4, Pooja Khatri
4, Opeolu Adeoye
3,
Simona Ferioli
4, Jason Mackey
5, Sharyl Martini
6, Felipe De Los Rios La Rosa F.
6, Brett Kissela
31Departments of Radiology, University of Cincinnati Medical Center, Cincinnati, OH, USA
2Department of Biostatistics and Epidemiology, Cincinnati Children’s Hospital, Cincinnati, OH, USA
3Department of Emergency Medicine, University of Cincinnati Medical Center; Department of Neurology, Cincinnati, OH, USA 4University of Cincinnati Medical Center, Cincinnati, OH, USA
5Department of Neurology, Indiana University School of Medicine, Indianapolis, Indiana, USA 6Baylor College of Medicine, Baptist Health Neuroscience Center, Miami, Florida, USA
Abstract
Background: We previously developed predictive models for 3-month mor-tality and modified Rankin Score (mRS) after ischemic stroke. Aim: The aim was to test model validity for 3-month mortality and mRS after ischemic stroke in two independent data sets. Methods: Our derivation models used data from 451 subjects with ischemic stroke in 1999 enrolled in the Greater Cincinnati/Northern Kentucky Stroke Study (GCKNSS). We utilized two separate cohorts of ischemic strokes through GCKNSS (460 in 2005 and 504 in 2010) to assess external validity by utilizing measures of agreement be-tween predicted and observed values, calibration, and discrimination using Transparent Reporting of a multivariable prediction model for Individual Prognosis or Diagnosis. Results: The 3-month mortality model performed well in the validation datasets with an average prediction error (Brier score) of 0.045 for 2005 and 0.053 for 2010 and excellent discrimination with an area under the curve of 0.86 (95% CI: 0.79, 0.93) for 2005 and 0.84 (0.76, 0.92) for 2010. Predicted 3-month mRS also performed well in the validation datasets with R2 of 0.57 for 2005 and 0.50 for 2010 and a root mean square error of 0.85 for 2005 and 1.05 for 2010. Predicted mRS tended to be higher than ac-tual in both validation datasets. Re-estimation of the model parameters for age and severe white matter hyperintensity in both 2005 and 2010, and for diabetes in 2005, improved predictive accuracy. Conclusions: Our previously developed stroke models performed well in two study periods, suggesting va-How to cite this paper: Vagal, A.,
Sucha-rew, H., Lindsell, C., Kleindorfer, D., Al-well, K., Moomaw, C.J., Woo, D., Flaherty, M., Khatri, P., Adeoye, O., Ferioli, S., Mackey, J., Martini, S., De Los Rios La Rosa F., F. and Kissela, B. (2018) Predicting Mortality and Functional Outcomes after Ischemic Stroke: External Validation of a Prognostic Model. Journal of Behavioral and Brain Science, 8, 587-597.
https://doi.org/10.4236/jbbs.2018.810036
Received: May 31, 2018 Accepted: October 27, 2018 Published: October 30, 2018
Copyright © 2018 by authors and Scientific Research Publishing Inc. This work is licensed under the Creative Commons Attribution International License (CC BY 4.0).
DOI: 10.4236/jbbs.2018.810036 588 Journal of Behavioral and Brain Science lidity of the model predictions.
Keywords
Ischaemic Stroke, Epidemiology, Stroke, Leukoaraiosis, African American, Stroke Prevalence
1. Introduction
Accurate prediction of outcomes after stroke is important, particularly if the predictive model can be applied to patient care [1] [2] and to relaying informa-tion to patients and families [2]. Modeling is also useful if it provides insights into the mechanisms of post-stroke recovery and stratifications for recovery tri-als that might improve post-stroke outcomes.
Prediction of functional outcomes after ischemic stroke is challenging. There are a plethora of stroke-related clinical and imaging data to consider. To date, predictive models have differed in the factors considered to build the model, [3]-[11] and testing for external validity in independent cohorts of patients has been uncommon [12].
We previously derived predictive models for 3-month mortality and 3-month modified Rankin Score (mRS) score after acute ischemic stroke utilizing a co-hort of patients from 1999 [10]. The purpose of the current study was to test the validity of those models. Here, we have utilized two independent data sets from 2005 and 2010 that include comprehensive outcome measurements in a well-characterized cohort of ischemic strokes.
2. Methods
Source of Data:
This work was undertaken as part of the Greater Cincinnati/Northern Ken-tucky Stroke Study (GCNKSS), a 5-county population-based study that tracks the regional incidence of stroke and case fatality. The Institutional Review Boards at all participating institutions approved this study, and detailed methods have been previously described [13] [14] [15]. Our original models were derived using data from a cohort of 451 subjects from the GCNKSS study with ischemic stroke occurring during calendar year of 1999. Two additional cohorts were enrolled in the GCNKSS, one whose strokes occurred in 2005, and the other whose strokes occurred in 2010. We used the Transparent Reporting of a multi-variable prediction model for Individual Prognosis or Diagnosis TRIPOD state-ment checklist [16] in analyzing and reporting this study.
Subject ascertainment and follow up:
DOI: 10.4236/jbbs.2018.810036 589 Journal of Behavioral and Brain Science eligible for enrollment; the primary reason for not enrolling was discharge be-fore contact for consent. Trained study nurses abstracted demographics, pre-senting symptoms, functional status before stroke, social, family, and medical histories, medications, testing and laboratory results, and imaging studies for each case. Stroke team physicians reviewed each abstract and all available imag-ing studies to verify that each case was a stroke and to classify the subtype of stroke.
These cohorts were followed for three months to determine both survival and short-term functional outcome, which was assessed via an initial interview and a 3-month interview. The methodology of the initial abstraction of data and sub-sequent interviews was similar to that used in the derivation cohort [10]. Each consented patient or proxy underwent an initial face-to-face structured inter-view with a research nurse. At 3 months after stroke, research nurses telephoned patients or proxies and asked about vital status, poststroke hospitalizations and medical contacts other than simple office visits. The mRS was used to determine the functional status of each surviving patient.
The Modified Rankin Score (mRS) is a widely-used scale to determine func-tional outcomes after stroke and measures independence of the patients. The scale consists of 6 grades, from 0 to 5, with 0 corresponding to no symptoms and 5 corresponding to severe disability. A separate category of 6 is usually added for patients who expire [17].
Predictors:
The predictors considered in model derivation have been detailed previously [10]. The original mortality prediction model included age and post-stroke mRS, whereas the original mRS prediction model included age, diabetes, severe white matter hyperintensity (WMH), pre-stroke mRS, post-stroke mRS, and NIH Stroke Scale (NIHSS) at presentation. The validated retrospective NIHSS (rNIHSS) scoring method was used to compute the NIHSS [18]. Post stroke mRS was estimated at time of hospital discharge or at 30 days after onset if the patient continued to be hospitalized. The degree of WMH was assessed visually using the 4-level Fazekas ordinal scale (none, mild, moderate, or severe) [19]. A single reader (B.K) graded the WMH in all three time periods (original and va-lidation) to maintain consistency. If a patient had both CT and MRI, the MRI study was used to grade white matter disease using the same Fazekas scale.
Outcome measures:
The two main outcomes of interest were: 1) death that occurred within 3 months after stroke (3 month mortality), and 2) Modified Rankin Score (mRS) at 3 months. Each surviving cohort member or their proxy was interviewed at three months after stroke to assign a 3 month mRS.
Statistical Methods:
DOI: 10.4236/jbbs.2018.810036 590 Journal of Behavioral and Brain Science coarse measure of an underlying continuous distribution of functionality; thus, the underlying distribution is appropriately modeled using the linear regression technique [10].
External validity of the model predictions was tested using measures of agreement between predicted and observed values, discrimination, and calibra-tion. For the 3-month mortality logistic model, the Brier score, [20], a measure of the average prediction error, and Tjur’s R2, [21], a measure of explained varia-tion, were used to assess overall model performance. The Brier score takes on values between 0 (perfect) and 1 (worst predictions), with lower Brier scores in-dicating better predictions. Tjur’s R2 is closely related to the traditional R2 for li-near models with an upper bound of 1 (perfect) and a lower bound of 0 (worst). The area under the receiver operating characteristic curve (AUC) was used to assess discrimination. An AUC of 0.5 indicates no discrimination, whereas an AUC of 1.0 indicates perfect discrimination. For the 3-month mRS linear model, R2 and root mean squared error (RMSE) were used to assess overall model per-formance. For both models, calibration was evaluated by plotting the predicted outcomes aganst the observed outcomes; calibration reflects the agreement be-tween predictions from the model and observed outcomes and perfectly cali-brated models have an intercept of 0 and a slope of 1. The need for re-estimating model parameters was also tested. Handling of missing data was done by com-plete-case analysis, as was done in the previous model development analyses.
SAS 9.3 (SAS Institute Inc., Cary, NC) and R version 3.2.4 (The R Foundation for Statistical Computing) were used for analyses.
3. Results
Participants
In 2005, we prospectively identified a cohort of 460 ischemic stroke subjects. Three subjects did not have post-stroke mRS assessed and were excluded, leav-ing 457 patients in the 3-month mortality validation dataset. There were 29 who died within 3 months post-stroke, five with missing WMH data, and 38 lost to follow up, leaving 388 patients in the 3-month mRS validation dataset. In 2010, a cohort of 504 ischemic stroke subjects was prospectively identified. Eight pa-tients were missing post-stroke mRS, leaving 496 papa-tients in the 3-month mor-tality validation dataset. There were 45 who died within 3 months post stroke, and 1 patient missing WMH data, and 56 lost to follow up, leaving 402 in the 3-month mRS validation dataset.
Derivation versus validation dataset
DOI: 10.4236/jbbs.2018.810036 591 Journal of Behavioral and Brain Science
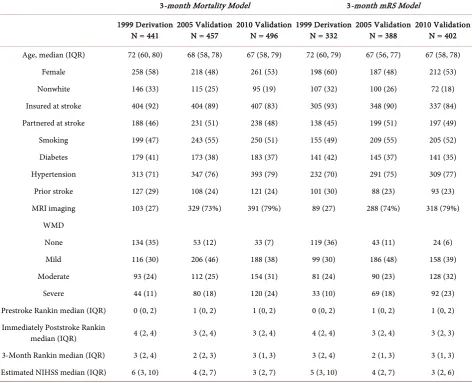
Table 1. Characteristics of patients included in the 3-month mortality and the 3-month mRS models by development and
valida-tion dataset.
3-month Mortality Model 3-month mRS Model
1999 Derivation
N = 441 2005 Validation N = 457 2010 Validation N = 496 1999 Derivation N = 332 2005 Validation N = 388 2010 Validation N = 402 Age, median (IQR) 72 (60, 80) 68 (58, 78) 67 (58, 79) 72 (60, 79) 67 (56, 77) 67 (58, 78)
Female 258 (58) 218 (48) 261 (53) 198 (60) 187 (48) 212 (53)
Nonwhite 146 (33) 115 (25) 95 (19) 107 (32) 100 (26) 72 (18)
Insured at stroke 404 (92) 404 (89) 407 (83) 305 (93) 348 (90) 337 (84) Partnered at stroke 188 (46) 231 (51) 238 (48) 138 (45) 199 (51) 197 (49)
Smoking 199 (47) 243 (55) 250 (51) 155 (49) 209 (55) 205 (52)
Diabetes 179 (41) 173 (38) 183 (37) 141 (42) 145 (37) 141 (35)
Hypertension 313 (71) 347 (76) 393 (79) 232 (70) 291 (75) 309 (77)
Prior stroke 127 (29) 108 (24) 121 (24) 101 (30) 88 (23) 93 (23)
MRI imaging 103 (27) 329 (73%) 391 (79%) 89 (27) 288 (74%) 318 (79%) WMD
None 134 (35) 53 (12) 33 (7) 119 (36) 43 (11) 24 (6)
Mild 116 (30) 206 (46) 188 (38) 99 (30) 186 (48) 158 (39)
Moderate 93 (24) 112 (25) 154 (31) 81 (24) 90 (23) 128 (32)
Severe 44 (11) 80 (18) 120 (24) 33 (10) 69 (18) 92 (23)
Prestroke Rankin median (IQR) 0 (0, 2) 1 (0, 2) 1 (0, 2) 0 (0, 2) 1 (0, 2) 1 (0, 2) Immediately Poststroke Rankin
median (IQR) 4 (2, 4) 3 (2, 4) 3 (2, 4) 4 (2, 4) 3 (2, 4) 3 (2, 3)
3-Month Rankin median (IQR) 3 (2, 4) 2 (2, 3) 3 (1, 3) 3 (2, 4) 2 (1, 3) 3 (1, 3) Estimated NIHSS median (IQR) 6 (3, 10) 4 (2, 7) 3 (2, 7) 5 (3, 10) 4 (2, 7) 3 (2, 6) Data shown as count (percentage) unless noted otherwise. Denominators vary due to missing data.
(79%) compared with 1999 (27%); p<0.01.
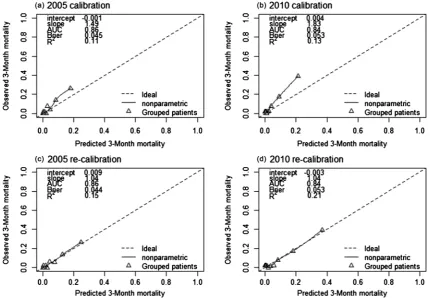
3-month mortality
per-DOI: 10.4236/jbbs.2018.810036 592 Journal of Behavioral and Brain Science formance improved with observed and predicted probabilities falling on the ideal line with intercept 0 and slope of 1 (Figure 1(c) and Figure 1(d)).
3-month mRS model
The original 3-month mRS model included six predictors-age, diabetes, severe WMH, pre-stroke mRS, post-stroke mRS, and the retrospective NIHSS and had an R2 of 0.48 and an RMSE of 1.10. When applying the derived model to the va-lidation datasets keeping all regression coefficients fixed at their original value, the model performed well with an R2 of 0.57 for 2005 and 0.50 for 2010 and an RMSE of 0.85 for 2005 and 1.05 for 2010 (Figure 2(a) and Figure 2(b)). When compared with actual 3 month mRS, predicted values tended to be high in both validation datasets. When allowing the regression coefficients to vary, the esti-mated cofficients for pre-stroke mRS, post-stroke mRS and NIHSS were rea-sonably similar to the coefficients previously estimated. However, the effects of age, diabetes and severe WMD were significantly different for the 2005 cohort, and the effects of age and severe WMD differed for 2010 (Table 2). After re-estimating the regression coefficients, model performance improved with ob-served and predicted probabilities falling close to the ideal line with intercept 0 and slope of 1 (Figure 2(c) and Figure 2(d)).
4. Discussion
[image:6.595.111.542.398.696.2]Our originally derived 3-month mortality and functional outcome predictive
Figure 1. Calibration and re-calibration plots of the 3-month mortality prediction model. (For comparison, the
DOI: 10.4236/jbbs.2018.810036 593 Journal of Behavioral and Brain Science
Figure 2. Calibration and revision plots of the original 3-month mRS prediction model. (For comparison, the 1999
derivation model had an R2 = 0.48 and RMSE = 1.10.)
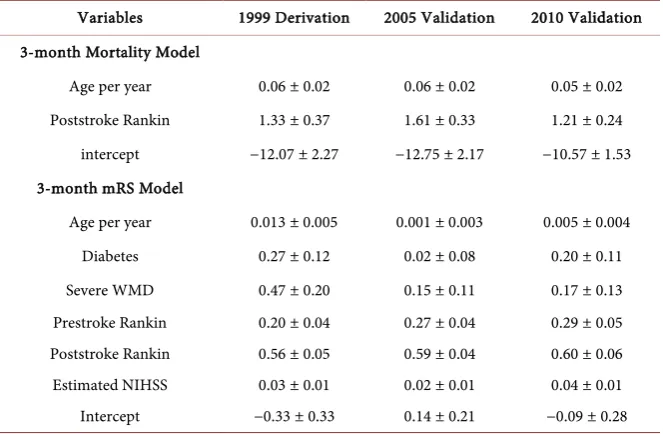
Table 2. Coefficients ± standard error in the 3-month mortality model (logistic
regres-sion) and in the 3-month mRS model (linear regresregres-sion) derivation data and reestimation using the validation data.
Variables 1999 Derivation 2005 Validation 2010 Validation 3-month Mortality Model
Age per year 0.06 ± 0.02 0.06 ± 0.02 0.05 ± 0.02 Poststroke Rankin 1.33 ± 0.37 1.61 ± 0.33 1.21 ± 0.24 intercept −12.07 ± 2.27 −12.75 ± 2.17 −10.57 ± 1.53 3-month mRS Model
Age per year 0.013 ± 0.005 0.001 ± 0.003 0.005 ± 0.004 Diabetes 0.27 ± 0.12 0.02 ± 0.08 0.20 ± 0.11 Severe WMD 0.47 ± 0.20 0.15 ± 0.11 0.17 ± 0.13 Prestroke Rankin 0.20 ± 0.04 0.27 ± 0.04 0.29 ± 0.05 Poststroke Rankin 0.56 ± 0.05 0.59 ± 0.04 0.60 ± 0.06 Estimated NIHSS 0.03 ± 0.01 0.02 ± 0.01 0.04 ± 0.01 Intercept −0.33 ± 0.33 0.14 ± 0.21 −0.09 ± 0.28
[image:7.595.208.540.449.666.2]DOI: 10.4236/jbbs.2018.810036 594 Journal of Behavioral and Brain Science enrolled using similar methods as in the derivation study. While there are a mul-titude of models and clinical scores predicting outcomes after stroke, [12] [22] [23] these are rarely derived from longitudinal datasets with comprehensive measurements made at different time points. All three patient cohorts used in our study were derived from a stroke population more representative of the US population than cohorts from randomized clinical trials or administrative data-bases [15].
We tested models that separately predict mortality and functional outcomes. A model that combines mortality and morbidity into a single endpoint has limi-tations for interpretation, as well as resulting in loss of clinically relevant infor-mation useful in counseling patients and their caregivers about both short and long term prognosis.
In contrast to the originally derived models, severe WMH burden was not significantly associated with poor outcome in the validation cohorts [10]. This is discordant with other studies that have suggested that WMH may play an im-portant role in predicting poststroke outcomes [24] [25]. One possible reason for this discrepancy could be that our original model was developed using a cohort of stroke patients from 1999 where CT scanning was predominant, while imag-ing in 2005 and 2010 was predominantly MRI. CT is less sensitive than MRI in determining WMH burden. Our finding is consistent with Reid et al, who illu-strated that CT derived imaging variables including WMH did not improve pre-diction of stroke outcome models [26]. An alternative explanation could be our use of visual scales rather than quantitative volumetric assessment of WMH. Our data do not resolve the controversy over the utility of WMH in predicting stroke outcomes. The role of chronic small vessel disease in determining post stroke outcome must be further explored in prognostic models using more sophisti-cated quantitative imaging biomarkers.
Our study has important limitations. Similar to the derivation dataset, the va-lidation datasets are a convenience sample of stroke patients who survived the early days following their stroke, and hence survival bias may be present. Thus, these models are applicable to patients who survive the first few days of stroke and remain hospitalized in the acute phase. Another limitation is that our imag-ing variables considered only severe WMH and not the entire spectrum of chronic small vessel disease (microbleeds, lacunar infarcts, atrophy) or infarct volumes. The studies available for the imaging analysis included both CT and MRI, leading to heterogeneity in WMH grading as CT can underestimate white matter disease burden. Lastly, we had missing data and there is a chance of bias if individuals with missing data are not representative of the original cohort. However, only 1% in 2005 and 2% in 2010 had missing data and were excluded from the 3-month mortality models. Almost all of the missing data from the 3-month mRS models was due to missing outcome and we chose not to impute outcomes.
out-DOI: 10.4236/jbbs.2018.810036 595 Journal of Behavioral and Brain Science come strengthens our contention that the models have both clinical and research utility. They will be useful tools in epidemiological studies and clinical trials to stratify cohorts or to balance treatment groups, and also for prognostication in clinical practice. However it is important to note the general limitation inherent when applying any population-based model in the context of individual patients; these models should be seen as a practical instrument to facilitate information and not as a substitute for clinical judgment and medical decision making.
5. Conclusion
Our models accurately predict 3-month mortality and functional outcome in two independent study cohorts with minor re-calibration. These models provide insight into post stroke recovery and may have utility in counseling patients and their families as well as for designing clinical trials and in epidemiological re-search.
Conflicts of Interest
The authors declare no conflicts of interest regarding the publication of this paper.
References
[1] Braitman, L.E. and Davidoff, F. (1996) Predicting Clinical States in Individual Pa-tients. Annals of Internal Medicine, 125, 406-412.
https://doi.org/10.7326/0003-4819-125-5-199609010-00008
[2] Harrell, F.E., Lee, K.L. and Mark, D.B. (1996) Multivariable Prognostic Models: Is-sues in Developing Models, Evaluating Assumptions and Adequacy, and Measuring and Reducing Errors. Statistics in Medicine, 15, 361-387.
https://doi.org/10.1002/(SICI)1097-0258(19960229)15:4<361::AID-SIM168>3.0.CO; 2-4
[3] Johnston, K.C., Connors, A.F., Wagner, D.P., Knaus, W.A., Wang, X. and Haley, E.C. (2000) A Predictive Risk Model for Outcomes of Ischemic Stroke. Stroke, 31, 448-455. https://doi.org/10.1161/01.STR.31.2.448
[4] Johnston, K.C., Connors, A.F., Wagner, D.P. and Haley, E.C. (2003) Predicting Outcome in Ischemic Stroke: External Validation of Predictive Risk Models. Stroke, 34, 200-202. https://doi.org/10.1161/01.STR.0000047102.61863.E3
[5] Johnston, K. (1999) What Are Surrogate Outcome Measures and Why Do They Fail in Clinical Research? Neuroepidemiology, 18, 167-173.
https://doi.org/10.1159/000026208
[6] Baird, A.E., Dambrosia, J., Janket, S., Eichbaum, Q., Chaves, C., Silver, B., Barber, P.A., Parsons, M., Darby, D., Davis, S., Caplan, L.R., Edelman, R.E. and Warach, S. (2001) A Three-Item Scale for the Early Prediction of Stroke Recovery. Lancet, 357, 2095-2099. https://doi.org/10.1016/S0140-6736(00)05183-7
[7] Ntaios, G., Faouzi, M., Ferrari, J., Lang, W., Vemmos, K. and Michel, P. (2012) An Integer-Based Score to Predict Functional Outcome in Acute Ischemic Stroke: The ASTRAL Score. Neurology, 78, 1916-1922.
https://doi.org/10.1212/WNL.0b013e318259e221
DOI: 10.4236/jbbs.2018.810036 596 Journal of Behavioral and Brain Science
IScore: A Risk Score to Predict Death Early after Hospitalization for an Acute Ischemic Stroke. Circulation, 123, 739-749.
https://doi.org/10.1161/CIRCULATIONAHA.110.983353
[9] Counsell, C., Dennis, M. and Lewis, S. (2001) Prediction of Outcome after Stroke.
Lancet, 358, 1553-1554. https://doi.org/10.1016/S0140-6736(01)06607-7
[10] Kissela, B., Lindsell, C.J., Kleindorfer, D., Alwell, K., Moomaw, C.J., Woo, D., Fla-herty, M.L., Air, E., Broderick, J. and Tsevat, J. (2009) Clinical Prediction of Func-tional Outcome after Ischemic Stroke: The Surprising Importance of Periventricular White Matter Disease and Race. Stroke, 40, 530-536.
https://doi.org/10.1161/STROKEAHA.108.521906
[11] Strbian, D., Meretoja, A., Ahlhelm, F.J., Pitkäniemi, J., Lyrer, P., Kaste, M., Engelter, S. and Tatlisumak, T. (2012) Predicting Outcome of IV Thrombolysis-Treated Ischemic Stroke Patients: The DRAGON Score. Neurology, 78, 427-432.
https://doi.org/10.1212/WNL.0b013e318245d2a9
[12] Teale, E.A., Forster, A., Munyombwe, T. and Young, J.B. (2012) A Systematic Review of Case-Mix Adjustment Models for Stroke. Clinical Rehabilitation, 26, 771-786.
https://doi.org/10.1177/0269215511433068
[13] Broderick, J., Brott, T., Kothari, R., Miller, R., Khoury, J., Pancioli, A., Gebel, J., Mills, D., Minneci, L. and Shukla, R. (1998) The Greater Cincinnati/Northern Ken-tucky Stroke Study: Preliminary First-Ever and Total Incidence Rates of Stroke among Blacks. Stroke, 29, 415-421. https://doi.org/10.1161/01.STR.29.2.415
[14] Kissela, B., Schneider, A., Kleindorfer, D., Khoury, J., Miller, R., Alwell, K., Woo, D., Szaflarski, J., Gebel, J., Moomaw, C., Pancioli, A., Jauch, E., Shukla, R. and Brode-rick, J. (2004) Stroke in a Biracial Population: The Excess Burden of Stroke among Blacks. Stroke, 35, 426-431. https://doi.org/10.1161/01.STR.0000110982.74967.39
[15] Kleindorfer, D.O., Khoury, J., Moomaw, C.J., Alwell, K., Woo, D., Flaherty, M.L., Khatri, P., Adeoye, O., Ferioli, S., Broderick, J.P. and Kissela, B.M. (2010) Stroke In-cidence Is Decreasing in Whites But Not in Blacks: A Population-Based Estimate of Temporal Trends in Stroke Incidence from the Greater Cincinnati/Northern Ken-tucky Stroke Study. Stroke, 41, 1326-1331.
https://doi.org/10.1161/STROKEAHA.109.575043
[16] Collins, G.S., Reitsma, J.B., Altman, D.G. and Moons, K.G. (2015) Transparent Re-porting of a Multivariable Prediction Model for Individual Prognosis or Diagnosis (TRIPOD): The TRIPOD Statement. Annals of Internal Medicine, 162, 55-63.
https://doi.org/10.7326/M14-0697
[17] Banks, J.L. and Marotta, C.A. (2007) Outcomes Validity and Reliability of the Mod-ified Rankin Scale: Implications for Stroke Clinical Trials: A Literature Review and Synthesis. Stroke, 38, 1091-1096.
https://doi.org/10.1161/01.STR.0000258355.23810.c6
[18] Williams, L.S., Yilmaz, E.Y. and Lopez-Yunez, A.M. (2000) Retrospective Assess-ment of Initial Stroke Severity with the NIH Stroke Scale. Stroke, 31, 858-862.
https://doi.org/10.1161/01.STR.31.4.858
[19] Fazekas, F., Chawluk, J.B., Alavi, A., Hurtig, H.I. and Zimmerman, R.A. (1987) MR Signal Abnormalities at 1.5 T in Alzheimer’s Dementia and Normal Aging. Ameri-can Journal of Roentgenology, 149, 351-356. https://doi.org/10.2214/ajr.149.2.351
[20] Brier, G.W. (1950) Verification of Forecasts Expressed in Terms of Probability.
Monthly Weather Review, 78, 1-3.
https://doi.org/10.1175/1520-0493(1950)078<0001:VOFEIT>2.0.CO;2
DOI: 10.4236/jbbs.2018.810036 597 Journal of Behavioral and Brain Science
New Proposal: The Coefficient of Discrimination. The American Statistician, 63, 366-372.https://doi.org/10.1198/tast.2009.08210
[22] Counsell, C. and Dennis, M. (2001) Systematic Review of Prognostic Models in Pa-tients with Acute Stroke. Cerebrovascular Diseases, 12, 159-170.
https://doi.org/10.1159/000047699
[23] Meyer, M.J., Pereira, S., McClure, A., Teasell, R., Thind, A., Koval, J., Richardson, M. and Speechley, M. (2015) A Systematic Review of Studies Reporting Multivaria-ble Models to Predict Functional Outcomes after Post-Stroke Inpatient Rehabilita-tion. Disability and Rehabilitation, 37, 1316-1323.
https://doi.org/10.3109/09638288.2014.963706
[24] Arsava, E.M., Rahman, R., Rosand, J., Lu, J., Smith, E.E., Rost, N.S., Singhal, A.B., Lev, M.H., Furie, K.L., Koroshetz, W.J., Sorensen, A.G. and Ay, H. (2009) Severity of Leukoaraiosis Correlates with Clinical Outcome after Ischemic Stroke. Neurolo-gy, 72, 1403-1410.https://doi.org/10.1212/WNL.0b013e3181a18823
[25] Henninger, N., Lin, E., Baker, S.P., Wakhloo, A.K., Takhtani, D. and Moonis, M. (2012) Leukoaraiosis Predicts Poor 90-Day Outcome after Acute Large Cerebral Artery Occlusion. Cerebrovascular Diseases, 33, 525-531.
https://doi.org/10.1159/000337335