The Path to Information Technology Business Value:
Case of Turkey
Birgul Arslan1, Meltem Ozturan2 1
Department of Strategy, HEC Paris, Paris, France 2
Department of Management Information Systems, Bogazici University, Istanbul, Turkey E-mail: [email protected], [email protected]
Received January 10, 2011; revised January 28, 2011; accepted February 11, 2011
Abstract
This study seeks to shed light upon the strategic value of information technology (IT) investments. Previous literature suggests that IT investments per se are not sufficient for improving firm performance. Drawing from the resource-based view, it is hypothesized in this study that IT investments can deliver higher firm per-formance if they are 1) combined with complementary assets, 2) leveraged to build capabilities and 3) used to support organizational core competencies. Based on the data collected, the findings show that IT support for core competencies has a significant positive effect on firm performance and the research model explains more than fifty percent variation of this performance. The study contributes to the literature by developing a comprehensive resource-based model of IT value, which takes IT, human and complementary resources into account and combines them with IT-related capabilities. The study also attempts to fill the gap of measure-ment by proposing a new measuremeasure-ment for IT stock of company which accounts for both the availability and the level of information technologies held by the company. Lastly, the study provides evidence from an un-der researched country, Turkey.
Keywords:IT Investments, Strategic Value of IT, Resource-Based View
1. Introduction
Information technologies (IT) have come to take a key part in the strategic agenda of companies. This is espe-cially true starting with 1970s when the U. S. economy witnessed a sharp increase in the levels of IT investment. Investments in IT continue to increase taking progres-sively larger part of the total investment pie. Hence, IT has become one of the most important decision variables for the top management of companies of any kind.
Academics’ interest on the productivity effects of in-formation technology rose with a sharp increase in the levels of information technology investment during 1970’s. The period was particularly interesting because, at the same time, productivity was falling [1]. As Solow, [2], stated “we see the computers everywhere except in the productivity statistics”; has been quoted many times by IT researchers. The issue has come to be known as the ‘Solow Paradox’ or ‘Productivity Paradox’ and unveiled a prolific stream of research.
First, academics sought to shed light upon the rela-tionship between IT investment and economy-wide
pro-ductivity. Baily [3] reported that labor productivity fell down to 0.7 % per year between 1973 and 1979 as com-pared to 2.75 % between 1953 and 1968. A more recent study conducted by Jorgenson and Stiroh [4] confirmed the findings: the average multifactor productivity growth was measured as 0.5 % per year in the period between 1973 and 1992 whereas the figure was estimated to be 1.7 % per year for the period between 1947 and 1973.
Second, researchers focused on industry-level effects of information technology. Earlier studies found that IT did not increase productivity neither in service nor in manufacturing sectors [5,6]. Morrison and Berndt [7] indicated overinvestment on IT because each dollar spent on IT returned $ 0.80 of value.
Third, in an effort to overcome the biases present in industry-level aggregations, authors turned to firm-level data. Brynjolfsson and Yang [8] reported that studies involving larger and more recent data sets showed a positive relationship between IT and firm performance.
contribution, even after so much effort.’ The possible explanations for the indecisiveness include 1) mismeas-urement of outputs and inputs, 2) lags due to learning and adjustment, 3) redistribution and dissipation of prof-its, and 4) mismanagement of information and technol-ogy. Furthermore, Brynjolfsson and Yang [9] concluded that half of the benefit derived from IT investments stemmed from unique characteristics of firms and the other half from investment levels. According to Bryn-jolfsson and Hitt [10], “what goes on inside the ‘black box’ of the firm has a substantial influence on the pro-ductivity of IT investments”. To conclude, it has been realized that the relationship between IT investment and productivity is of a complex, indirect and peculiar nature. Later, new theories presented an enriched platform for researchers to explore performance effects of informa-tion technology. Melville et al. [11] identified four main research paradigms applied to IT business value research: microeconomic theory, industrial organization theory, sociology and socio-political perspectives, and resource- based view.
Microeconomic theory studies economic agents’ deci-sions on how to allocate limited resources [12]. It has been extensively adopted in IT literature because it is equipped with “a rich set of well-defined constructs in-terrelated via theoretical models and mathematical speci-fications” [11]. Six approaches under the microeconomic theory have been followed in IT literature: Theory of Production [13], Growth Accounting [14], Consumer Theory [15], Data Envelopment Analysis [16], Tobin’s Q [17-19] and Option Pricing [20,21].
However, none of the above approaches fully answer the call of Brynjolfsson and Hitt [10] for looking at firm differences in IT productivity. The search for a new framework resulted in the application of resource-based view (RBV) to the relationship between IT and business performance.
RBV looks at the relationship between firm resources and competitive advantage [22-24]. RBV holds that dif-ferences in performance stem from heterogeneous re-source and capability portfolios. A rere-source, to convey sustained competitive advantage, must be valuable, rare, inimitable and non-substitutable; the characteristics for a resource to survive competitive duplication [22].
RBV-based IT research starts with IT and comple-mentary resources, and relates firm performance to their availability. Bharadwaj [25] found evidence that firms, leading in IT investment and use, outperformed those with moderate IT adoption. Devaraj and Kohli [26] pointed out that the link between IT resources and firm performance could only be established if the actual usage was accounted for. In the e-commerce framework, Zhu [27] provided evidence for capability building arguments:
the interaction between e-commerce capabilities activi-ties and IT infrastructure was positively linked with firm performance. Ray et al. [28] pointed out the importance of shared knowledge between IT and customer service units which was found to have a significant direct effect on the business process performance as well as a signifi-cant moderating effect on the relationship between IT resources and process performance. In another study by Wu et al. [29], supply chain capabilities were found to have significant positive effect on firm performance if supported by IT advancement and IT alignment. Huang et al. [30] found positive relationship between IT infra-structure and IT-related intangibles which, in turn, had a significant positive effect on firm performance.
Another group of researchers identified the importance of strategic alignment of IT investments. Such alignment was achieved when the general IT investment plan sup-ported the priorities and goals of the firm’s general stra-tegic plan. Sabherwal and Chan [31] found evidence that strategic alignment of IT had an effect on overall busi-ness success if the firm sought for flexibility and innova-tion or for a simultaneous achievement of efficiency and innovation. But the relationship did not hold if the firm followed a defensive strategy, such as aggressive cost cutting. Dehning et al. [32] showed that transformative IT investments which redefined business and industry processes generated abnormal returns to investment an-nouncements. Finally, Oh and Pinsonneault [33] found that strategic alignment of IT for cost reduction purposes had a significant negative effect on firm expenses.
Ravichandran and Lertwongsatien [34] combined the capability arguments with alignment arguments by tak-ing a process view in the IT business value generation. They modeled this process starting with resources gener-ating IT-related capabilities which supported core com-petencies, hence provided business value. They found evidence that IT support for core competencies was posi-tively related with firm performance.
In summary, a wide range of theories with disparate perspectives are applied to the investigation of IT busi-ness value. The applications of the first three paradigms are either criticized to be either too abstract to draw con-clusions from or too specific to be generalized. Con-versely, most researchers expressed confidence in the application of RBV on IT literature since RBV allowed researchers to account for the complex process through which IT resources delivered value [11,25,35,36]. Mel-ville et al. [11] proposed RBV as a unifying framework “suitable for analyzing the complexity of IT and firm performance”. Due to emphasis on firm heterogeneity and process oriented approach, studies employing RBV are credited for generating more consistent results.
crea-tion process of RBV approach [37], and underlying mechanisms of IT business value creation remain to be an unresolved issue [22,25,38,29]. Therefore, academics call for further review and testing of the resource-based view of IT [25,35].
As a response, based on the RBV, this study proposes a model combining and enriching the complementary and processual aspects in the literature for IT business value creation. The proposed model, adopted from Ravichandran and Lertwongsatien [34], includes the process through which IT, human and complementary resources are turned into IT-based capabilities to support core competencies and improve firm performance. The study provides evidence from an under researched coun-try, Turkey.
2. Methodology
2.1. Model
This study builds on the model developed by Ravi-chandran and Lertwongsatien [34] taking a process view to IT business value creation as given in Figure 1. The
study also improves the model 1) by extending IT related resource portfolio to include a range of complementary assets, 2) proposing a new measure of IT stock, and 3) controlling for previous performance.
2.2. Hypotheses
Hypotheses, regarding the model, are classified under three groups; hypotheses on IT related resources, hy-pothesis on IT based capabilities and hyhy-pothesis on IT support for core competencies.
Hypotheses on IT-Related Resources: Following Grant’s classification [39], IT-related resources can be classified as 1) IT infrastructure, 2) IT department human resource (HR) skills, and 3) complementary resources.
IT infrastructure constitutes resources such as com-puters, ancillary equipment, software, procedures, and services. They are used to acquire, store, analyze and distribute data. The actions taken to acquire and make use of data form the basis for IT-based capability build-ing. Hence;
Hypothesis 1a. IT infrastructure is positively associ-ated with IT-based capabilities.
The success of the process through which firms extract value from their IT investments is highly dependent on the personnel of the IT department, who are responsible for analyzing business requirements, planning, organiz-ing and leadorganiz-ing information systems (IS) projects, as well as communicating with and educating end-users. IT department human resources constitute an important in-put for the development of IT based capabilities and for that purpose they need to have strong technical, analyti-cal, managerial and interpersonal skills [40]. Hence;
Hypothesis 1b: IT department human resources skills are positively associated with IT-based capabilities.
Complementary intangible resources include process redesign, benchmarking, teamwork, top management commitment, propensity for change and open organiza-tion [36]. Overall, they serve two funcorganiza-tions. First, they combine with IT infrastructure and IT department human resource skills to produce the intended results in a pro-ductive manner. Second, drawing from the notion of complementarity, they render the resource combination imperfectly imitable through causal ambiguity. Hence;
[image:3.595.99.502.497.705.2]Hypothesis 1c: Complementary resources are positively
associated with IT-based capabilities.
Overall, they serve two functions. First, they combine with IT infrastructure and IT department human resource skills to produce the intended results in a productive manner. Second, drawing from the notion of comple-mentarity, they render the resource combination imper-fectly imitable through causal ambiguity. Hence;
Hypothesis 1c: Complementary resources are posi-tively associated with IT-based capabilities.
Hypothesis on IT-based Capabilities: Bharadwaj, [25] defined IT-based capability as “the ability to mobilize and deploy IT-based resources in combination or copre-sent with other resources and capabilities”. The extent to which an organization can enhance its core competencies through IT support depends on IT-based capabilities. Strong IS planning capability enables an organization’s managers to allocate technology resources to strategic priorities. Systems development capability improves the compatibility of intended strategic applications of tech-nology resources with the strategic priorities. The effi-ciency of IT support for core competencies, in terms of both cost and time, might result from end-user IT support and system operation capabilities by ensuring company wide end-user utilization of applications and the continu-ity of business operations [34]. Hence,
Hypothesis 2: IT-based capabilities are positively as-sociated with IT support for core competencies.
Hypothesis on IT Support for Core Competencies: Hamel [41] categorized core competencies as mar-ket-access, integrity-related, and functionality-related. Market-access competencies relate to the proximity with which a firm can come close to its customers; integ-rity-related competencies refer to the speed, flexibility and reliability with which a firm performs its operations; and functionality-related competencies relate to the uniqueness of products and services offering of a firm. Given that resources are limited and competency devel-opment process is complex, bundling IT with core busi-ness processes in a strategic manner is likely to yield valuable and inimitable results. Therefore, everything else being equal, firms that align their IT infrastructure with core competencies will realize more value from their IT assets and improve their competitiveness. Hence;
Hypothesis 3: IT support for core competencies is po-sitively associated with firm performance.
2.3. Data Collection
In this study, survey methodology was used to collect data to test the hypotheses. The questionnaire (given in appendix) used for this purpose is an adaptation of the questionnaire that was used by Ravichandran and Lertwongsatien [34]. The questionnaire is revised to
ac-count for the renewed resource set proposed.
The sample, chosen by judgement sampling, included 212 companies whose IT executives’ interviews were published in Turkey’s leading IT magazines, in the last two years. This ensures that the sample covers a signifi-cant portion of Turkish companies which make consid-erable IT investments. The names and titles of the execu-tives were collected from the IT magazines. Contact in-formation, on the other hand, was collected from corpo-rate, IT vendor, and IT education websites.
Following a pilot study, the questionnaire was sent to the 181 IT executives via e-mail where for 31 IT execu-tives, the consecutive trials were returned with delivery failure. The number of responses received totaled 36, hence a result rate of 19.89%. Two responses were left out due to missing data.
The respondents represent a wide spectrum of indus-tries including apparel, finance, fast moving consumer goods, food and beverages, healthcare and pharmaceuti-cals, retail, telecommunications, and transportation. Seven of the respondents are IT directors whereas 22 are de-partment managers. The remaining seven respondents are managers of an IT function such as software, network, or project.
2.4. Measurements
Measurements of this study can be discussed under six main groups.
IT Infrastructure: The types of benefits attributed to information technologies include increased quality, vari-ety, responsiveness and improved communications. These benefits are not direct results of the hardware fea-tures of the IT infrastructure but of the IS developed to run on that hardware. Therefore, for the purposes of this study, the IT infrastructure is measured by the type of IS running within the infrastructure.
Laudon and Laudon [42] provided a classification of IS based on functionality and sophistication. Accordingly, there are four main levels of IS: transaction processing systems (TPS), management information systems (MIS), decision support systems (DSS), and executive support systems (ESS), in increasing sophistication.
Regarding the discussions above, IS possessed by the company were measured in the questionnaire in terms of functional software architecture approach where the business functions were listed and corresponding IS ex-istence and usage for that function is questioned.
From IS usage information provided by the respondents, an index of IS usage is created to measure the level of IT infrastructure, as in (1), utilized within the company: IT Infrastructure =
ISUsage is a dummy variable taking the value 1 if the information system is in use in the company, 0 otherwise. IS Level takes the values 1, 2, and 3 for TPS, MIS & DSS and ESS, respectively. MaximumTotalScore is the maxi-mum level a company can score in its industry; i.e. a company that has all the information systems across all functions with highest levels at the time of the question-naire.
Therefore, the higher-level systems are more likely to contribute to the firm performance. Furthermore, the index above is better in measuring real usage and in cancelling out the cases in which the investment is made but the related assets are not being used. Devaraj and Kohli [26] find that the link between IT investment and firm performance will be valid only if real usage is ac-counted for.
IT Department HR Skills and Complementary Re-sources: The second part of the questionnaire measured the level of other resources present in the company. It consisted of multiple 1 to 5 likert-scale questions asking the respondents their level of agreement with the state-ments provided.
IT department human resource skills were categorized by four distinct set of skills: technical, analytical, mana-gerial and interpersonal skills [43]. Each was measured by 6 to 7 item scales using 1 to 5 likert-scale questions. The scales were adopted from 1) Byrd and Turner [40] and reshuffled to match the 4-item categorization of Hoffer et al. [43], and 2) others were added in parallel with the descriptions in Laudon and Laudon [42] when necessary.
The measurement items for other complementary re-sources were adopted from refined measurement scales in Powell and Dent-Micallef [36].
IT-Based Capabilities: In this study, IT-based capa-bilities were measured in four dimensions: IS planning, system development, end-user IT support, and IS opera-tions capabilities [34]. They were all measured by 4 to 6 item scales adopted from [34].
IT Support for Core Competencies: IT support for Core Competencies has three dimensions: IT support for 1) market-access, 2) integrity-related, and 3) functional-ity-related competencies. All three constructs were measured by multiple item scales adopted from Ravi-chandran and Lertwongsatien [34] through 1 to 5 li-kert-scale questions.
Firm Performance: Firm performance was measured by respondents’ subjective evaluations of last year’s corporate performance. Corporate performance has two dimensions. Operating performance is related to tradi-tional performance measures such as profitability and productivity. It is also related to the performance as-sessment relative to the competitors. Market-access
per-formance, on the other hand, measures how successful the organization has been in entering new markets and launching new products/services. These two constructs were measured by three and four item scales as in Ravi-chandran and Lertwongsatien [34] using again 1 to 5 likert-scale questions.
Controls: The model of the study controls for firm size, firm age and industry IT intensity in order to account for possible other factors which could have an effect on the dependent variable. Firm size is one such factor because large firms may possess slack resources which may help utilize IT more effectively than smaller firms can do [44]. In the context of this study, it was measured by the loga-rithm of number of employees. Firm age may indicate higher legitimacy, stronger interfirm relationships and maturity in internal processes. Also, the performance of the younger firms may be subject to the liability of new-ness [45]. Age was measured by the number of years passed from the foundation of the organization. Lastly, industry IT intensity will affect the value extracted from IT investments because in industries, where information is more intensely used, IT may have more of an effect on performance [46]. Industry IT intensity was measured by a three item scale via 1 to 5 likert-scale questions.
2.5. Analysis of the Model
The statistical analysis of the research model was con-ducted in multiple steps. First, descriptive statistics for continuous variables were evaluated, and then the multi-ple item scales were tested for validity, by examining the individual items’ loadings. Next, principal components of refined measurement items were created to be used as formative indicators of higher level latent variables. Fi-nally, the research model was tested using PLS technique which is generally used for the analysis of causal paths. PLS was developed to overcome the limitations of the better-known covariance-based Linear Structural Rela-tion Systems (LISREL) approach [47]. Hulland [47] ported that these limitations were large sample size re-quirements and nonunique results; this is why PLS was more suitable for this study where the sample size was small.
change in all the manifest variables. In a formative rela-tionship, however, a change in the manifest variable causes a corresponding change in the latent variable. In this case, each manifest variable captures a different as-pect of the latent variable [48]. The structural model, on the other hand, relates the latent variables to other latent variables within the model and analyzes the hypothesized relationships.
3. Results
3.1. Descriptive Statistics
There are three scale variables in the research model: IT infrastructure, company age and size. The average IT in-frastructure score is 0.595 with a standard deviation of 0.192. The average number of employees for the respon-dent companies was 1189. The standard deviation for the number of employees is 235.5. The mean for the firm age is 23.67 with a corresponding standard deviation of 17.9.
3.2. Scale Validation for Latent Variables
The scales were validated using the factor analysis me-thod. A scale presents sufficient convergent validity if all of its items load highly on one factor. The loadings of all measurement items on their corresponding scales were found and the items, given in Table 1, with loadings
lower than 0.5 were removed from the scale. The re-maining scales were used in the next step, principal component analysis.
3.3. Principal Component Analysis
Principal component analysis was conducted to come up with a single variable for each indicator of the latent va-riables. For example, 6 items were used to measure the level of technical skills which, in turn, was the formative indicator of higher-level latent variable IT department HR skills. The principle component of these 6 items was used as a single indicator of technical skills. The princi-ple component analysis was necessary to reduce the complexity of the model.
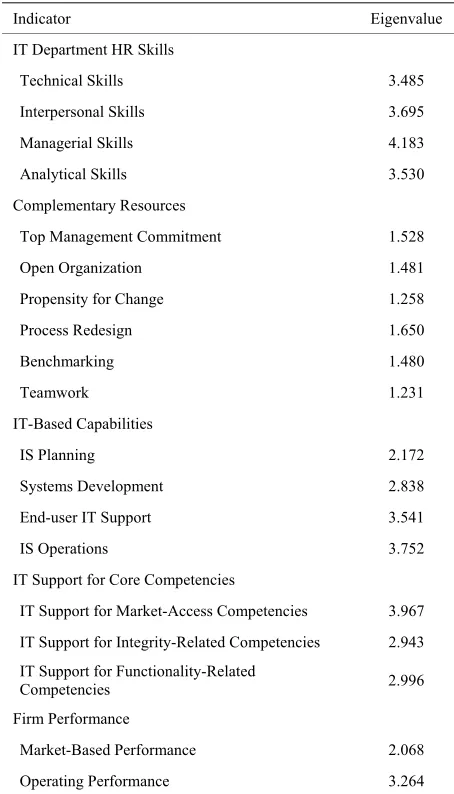
In order for a principle component to represent enough variation among the variables, its eigenvalue must be greater than 1. All eigenvalues for formative indicators, in this study were found to be higher than 1, as reported in Table 2.
3.4. Analysis of the Research Model
In the research model of this study, there are five la-tent variables: IT department HR skills, complementary
[image:6.595.310.537.151.293.2]resources, IT-based capabilities, IT support for core com-petencies, and firm performance. The relationships be-tween the latent variables and their manifest variables are formative.
Table 1. Items removed from analyses.
Item Part of the Questionnaire
Our IT personnel have the ability be knowledgeable about the environ-mental constraints.
Part II
Business units’ participation in the
IS planning process is very low. Part III
Our systems development process
facilitates reuse of software assets. Part III
We use IS to improve the speed of
[image:6.595.309.536.319.716.2]product/service delivery. Part IV
Table 2. Eigenvalues for principal components.
Indicator Eigenvalue
IT Department HR Skills
Technical Skills 3.485
Interpersonal Skills 3.695
Managerial Skills 4.183
Analytical Skills 3.530
Complementary Resources
Top Management Commitment 1.528
Open Organization 1.481
Propensity for Change 1.258
Process Redesign 1.650
Benchmarking 1.480
Teamwork 1.231
IT-Based Capabilities
IS Planning 2.172
Systems Development 2.838
End-user IT Support 3.541
IS Operations 3.752
IT Support for Core Competencies
IT Support for Market-Access Competencies 3.967
IT Support for Integrity-Related Competencies 2.943 IT Support for Functionality-Related
Competencies 2.996
Firm Performance
Market-Based Performance 2.068
Figure 2 illustrates an example for the overall PLS
methodology followed in the study. It lays out the proc-ess in three steps with their respective statistics of inter-est. In the example, the first step consists of creating the principal components of individual scale items to be used as a single variable reflecting technical HR skills. Com-bined with the principal components of other three types of skills, they constitute the formative indicators for the higher level latent variable IT department HR skills (step 2). The structural model of PLS algorithm, in turn, re-lates these higher level constructs to each other as de-signed in the model. In the overall methodology, the first and second steps are omitted for variables such as IT infrastructure, firm size and age because they are con-tinuous variables reflecting their variable in isolation.
3.4. PLS Findings
In this study, the PLS model was analyzed using PLS-Graph 3.0 both for the measurement model and the structural model and the findings of this analysis are ex-plained in the following sections.
[image:7.595.145.454.531.707.2]The Measurement Model of PLS: The measurement model, also known as the outer model, relates the mani-fest variables to their corresponding latent variables. In this study, the measurement model relates the formative indicators (e.g. technical, interpersonal, managerial and analytical skills) to the higher level latent variables (e.g. IT department HR skills). The resulting statistic of inter-est is, again, the loadings; a formative indicator should have a loading higher than 0.5 to present enough validity.
Table 3 depicts the loadings for all formative indicators.
Using the results of the measurement model, the PLS model was refined by dropping the formative indicators with loadings lower than 0.5. Five of nineteen indicators were excluded from the next analysis, the structural model. Another outcome of the measurement model is
composite reliability. The reliability statistics for the refined model are depicted in Table 4. Composite
reli-ability is a measure developed by Fornell and Larcker [50] for PLS modeling and is required to be greater than 0.7 [51]. All latent variables in the measurement model were found to present sufficient reliability.
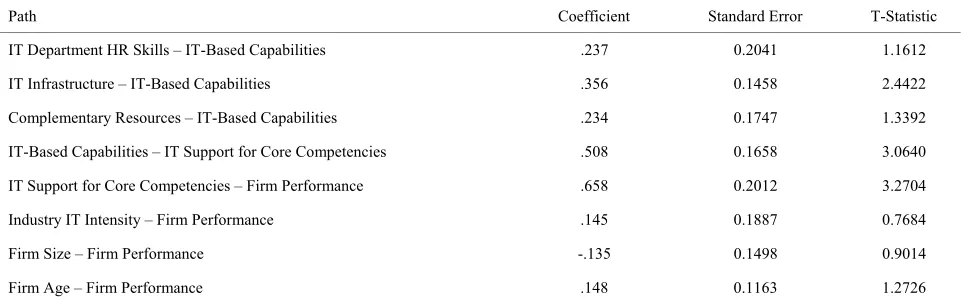
The Structural Model of the PLS: The structural model looks at the causal paths, the relationships between the latent variables. The statistics of interest are 1) path coefficients and 2) R-squares. The results of the struc-tural model are presented in Figure 3.The model
ex-plains 48.1% of variance in IT-based capabilities, 25.8% of variance in IT support for core competencies, and 52.1% of variance in firm performance. The t-statistics of path coefficients in Table 5 showed that three of five
coeffi-cients of the hypothesized relationships were statistically significant. T-statistics imply statistical significance for the coefficients and are required to be greater than 2. T-statistics were generated using bootstrapping, a sig-nificance assessment technique, which involves resam-pling with replacement from the original sample. As suggested in Tenenhaus et al. [49], 200 resamples were used for bootstrapping in this study. The coefficients which are statistically significant are depicted with an asterisk in the Figure 3. Accordingly, the relationships
between 1) IT infrastructure and IT-based capabilities, 2) IT-based capabilities and IT support for core competen-cies, and 3) IT support for core competencies and firm performance are positive and significant. Hence, the findings support Hypothesis 1a, Hypothesis 2 and Hy-pothesis 3. The relationship between IT department HR skills and IT-based capabilities turned out to be positive as hypothesized, yet the coefficient was statistically in-significant. Similarly, the relationship between comple-mentary resources and IT-based capabilities was found to be positive, yet again statistically insignificant. There-
Figure 3. The results of the structural model.
Table 3. Results of the measurement model.
Original Model Refined Model
Formative Indicators Loading T-Statistic Loading T-Statistic
IT Department HR Skills
Technical Skills 0.6751 2.5017 0.8331 2.9974
Interpersonal Skills 0.7408 3.2687 0.8812 4.121
Managerial Skills 0.3957 1.4921 dropped dropped
Analytical Skills 0.3418 1.2773 dropped dropped
Complementary Resources
Top Management Commitment 0.3409 1.3175 dropped dropped
Open Organization -0.2102 0.7031 dropped dropped
Propensity for Change -0.0757 0.2396 dropped dropped
Process Redesign 0.7800 4.2120 0.8323 3.665
Benchmarking 0.8011 4.0617 0.8523 4.767
Teamwork 0.5453 1.9980 0.5700 1.7829
IT-Based Capabilities
IS Planning 0.6755 2.7809 0.6609 2.656
Systems Development 0.8384 3.7218 0.8037 4.1813
End-user IT Support 0.7497 3.3500 0.7667 3.7677
IS Operations 0.9139 6.3278 0.9289 6.5988
IT Support for Core Competencies
IT Support for Market-Access Competencies 0.9177 6.5149 0.9222 4.6741
IT Support for Integrity-Related Competencies 0.6591 1.9107 0.6377 1.9898
IT Support for Functionality-Related Competencies 0.7228 2.8116 0.7322 3.1727
Firm Performance
Market-Based Performance 0.9598 6.4940 0.9590 4.8213
Table 4. Reliability statistics for the measurement of latent variables.
Latent Variable Composite Reliability
IT Department HR Skills 0.847
Complementary Resources 0.802
IT-Based Capabilities 0.872
IT Support for Core Competencies 0.813
Firm Performance 0.862
Table 5. Significance of path coefficients.
Path Coefficient Standard Error T-Statistic
IT Department HR Skills – IT-Based Capabilities .237 0.2041 1.1612
IT Infrastructure – IT-Based Capabilities .356 0.1458 2.4422
Complementary Resources – IT-Based Capabilities .234 0.1747 1.3392
IT-Based Capabilities – IT Support for Core Competencies .508 0.1658 3.0640
IT Support for Core Competencies – Firm Performance .658 0.2012 3.2704
Industry IT Intensity – Firm Performance .145 0.1887 0.7684
Firm Size – Firm Performance -.135 0.1498 0.9014
Firm Age – Firm Performance .148 0.1163 1.2726
Table 6. Breakdown of explained variance in firm performance.
Full Model Control Variables Only Model Theoretical Variables Only Model
Total number of paths 8 3 5
Number of significant paths 3 1 (Age) 3
Variance explained in firm performance 52.1 % 15.4 % 47.1 %
Additional variance explained
by the theoretical variables 36.7 % (= 52.1 % - 15.4 %)
Additional variance explained
by the control variables 5 % (= 52.1 % - 47.1 %)
fore, no support was found for Hypothesis 1b and Hy-pothesis 1c. Coefficients of control variables were found to be statistically insignificant. The breakdown of ex-plained variance in firm performance can be inferred as in Ravichandran and Lertwongsatien [34] using the results of “control variables only model” and “theoretical vari-ables only model”. The breakdown is shown in Table 6.
4. Conclusions
Resource-based view informs our understanding of IT business value by stressing the valuable, rare and inimi-table resources [22]. Given the fact that information technologies are increasingly available in the market for every actor, the question remains for academics to dis-cover the process through which IT can be leveraged to
[image:9.595.52.538.404.517.2]through which IT investments are aligned with corporate strategy. The study hypothesized positive relationships between IT-based capability and IT support for core competencies as well as between IT support for core competencies and firm performance. Even after control-ling for industry IT intensity, firm size and age, the find-ings strongly supported these hypotheses. Therefore, one can conclude that it is the process of continuous leverag-ing of resources for capability buildleverag-ing that leads to per-formance differentials.
The study provided partial support for resource-based arguments and was not free from limitations. The major limitation was the small data set. Although considerable effort was put on data collection, the response rate was around 20 %. This was partly overcome by choosing the appropriate methodology; PLS modeling. However, a larger data set would provide more consistent results. Another limitation concerns the measurement which can still be improved. The IT infrastructure score proposed here can be supplemented by monetary investment levels. However, there is no such data publicly available in Turkey, and companies are reluctant to provide that in-formation. In addition, the measurement of firm per-formance in this study was subjective. Again, it is very difficult to collect objective performance data for com-panies not listed in stock exchange. Final limitation stems from the nature of the data. Cross-sectional data implies association but not causality. Therefore, the question remains open if the relationships present in this study will be sustained over time.
This study offered implications for future research. It should be complemented with comprehensive data sets and objective measurements. Second, the relationships should be checked for robustness across industries and over time. Furthermore, although the coefficient for rela-tionship between IT-based capabilities and IT support for core competencies was positive and statistically signifi-cant, the variance explained in IT support for core com-petencies was relatively low which leaves room for fur-ther theoretical contribution. Additional theoretical vari-ables, such as end-user resistance and availability of slack resources, might moderate the relationship between IT- based capabilities and IT support for core competencies. Lastly, the model explained more than 50% of variation in firm performance. Although this is considered a rela-tively high percentage, there is still room for re- search-ers to reveal the rest. Other theoretically interesting fac-tors need to be discovered and included in IT business value analysis.
Finally, the results bear implications for management. The findings shed light upon the process through which managers can create value from their IT investments. Managers must be aware that stand-alone IT investments
are less likely to deliver business value. These invest-ments must be leveraged to build IT-based capabilities. There is no doubt that the level of IT investment contrib-utes significantly to IT-based capability building, how-ever the link to improved firm performance is indirect: these capabilities need to be used to support the compe-tence areas of the company. In other words, the IT strat-egy must be aligned with the overall firm stratstrat-egy.
On the other hand, the study did not support the wide- spread suggestion that IT investments need to be com- plemented with other resources such as corporate culture and IT department HR skills. However, the conclusion must be made carefully here because the theory about complementarity is rather strong. The insignificant results may be due to the sample size or measurement problems.
5. References
[1] E. Brynjolfsson, “The Productivity Paradox of Informa-tion Technology,” Communications of the ACM, Vol. 36, No. 12, December 1993, pp. 66-77.
doi:10.1145/163298.163309
[2] R. M. Solow, “We’d Better Watch Out,” New York Times Book Review, New York Times, New York, July 1987, pp. 36.
[3] M. N. Baily, “What Has Happened to Productivity Grow- th?,” Science, Vol. 234, No. 4775, October 1986, pp. 443-451.
doi:10.1126/science.234.4775.443
[4] D. W. Jorgenson and K. Stiroh, “Computers and Growth,” Economics of Innovation and New Technology, Vol. 3, No. 3, 1995, pp. 295-316.
doi:10.1080/10438599500000008
[5] S. S. Roach, “America’s Technology Dilemma: A Profile of the Information Economy,” Morgan Stanley, 1987. [6] S. S. Roach, “Services Under Siege: The Restructuring
Imperative,” Harvard Business Review, Vol. 69, No. 5, September-October 1991, pp. 82-91.
[7] C. J. Morrison and E. R. Berndt, “Assessing Productivity of Information Technology Equipment in U.S. Manufac-turing Industries,” Review of Economics and Statistics, Vol. 79, No. 3, August 1997, pp. 471-481.
doi:10.1162/003465300556887
[8] E. Brynjolfsson and S. Yang, “Information Technology and Productivity: A Review of the Literature,” Advances in Computers, Vol. 43, 1996, pp. 179-214.
doi:10.1016/S0065-2458(08)60644-0
[9] E. Brynjolfsson and S. Yang, “The Intangible Benefits and Costs of Investments: Evidence from Financial Mar-kets,” Proceedings of the 18th International Conference on Information Systems, Atlanta, December 1997, pp. 147-166
[10] E. Brynjolfsson and L. M. Hitt, “Beyond the Productivity Paradox,” Communications of the ACM, Vol. 41, No. 8, August 1998, pp. 49-55.
[11] N. Melville, K. L. Kraemer and V. Gurbaxani, “Informa-tion Technology and Organiza“Informa-tional Performance: An In-tegrative Model of IT Business Value,” MIS Quarterly, Vol. 28, No. 2, June 2004, pp. 283-322.
[12] M. A. Marchant and W. M. Snell, “Macroeconomic and International Policy Terms,” Internet Available:
http://www.ca.uky.edu/agc/pubs/aec/aec75/aec75.pdf,1991. [13] E. Brynjolfsson and L. M. Hitt, “Paradox Lost? Firm-
Level Evidence on the Returns to Information Systems Spending,” Management Science, Vol. 42, No. 4, April 1996, pp. 541-558. doi:10.1287/mnsc.42.4.541
[14] D. W. Jorgenson and K. J. Stiroh, “Information Technol-ogy and Growth,” The American Economic Review, Vol. 89, No. 2, May 1999, pp. 109-115.
doi:10.1257/aer.89.2.109
[15] L. M. Hitt and E. Brynjolfsson, “Productivity, Business Profitability, and Consumer Surplus: Three Different Measures of Information Technology Value,” MIS Quar-terly, Vol. 20, No. 2, June 1996, pp. 121-142.
doi:10.2307/249475
[16] S. M. Shafer and T. A. Byrd, “A Framework for Measur-ing the Efficiency of Organizational Investments in In-formation Technology Using Envelopment Analysis,” Omega, Vol. 28, No. 2, April 2000, pp. 125-41.
doi:10.1016/S0305-0483(99)00039-0
[17] Cockburn and Z. Griliches, “Industry Effects and Appro-priability Measures in the Stock Market’s Valuation of R&D and Patents,” The American Economic Review, Vol. 78, No. 2, May 1988, pp. 419-423.
[18] Z. Griliches, “Market Value, R&D and Patents,” Eco-nomic Letters, Vol. 7, No. 2, 1981, pp. 183-187.
doi:10.1016/0165-1765(87)90114-5
[19] B. H. Hall, “The Stock Market’s Valuation of R&D In-vestment during the 1980’s,” The American Economic Review, Vol. 83, No. 2, May 1993, pp. 259-264.
[20] B. Kogut and N. Kulatilaka, “Operating flexibility, Glob- al Manufacturing and the Option Value of a Multina-tional Network,” Management Science, Vol. 40, No. 1, January 1994, pp. 123-139.
doi:10.1287/mnsc.40.1.123
[21] C. Y. Baldwin, and K. B. Clark, “Capital-Budgeting Sys-tems and Capabilities Investments in U.S. Companies af-ter the Second World War,” Business History Review, Vol. 68, No. 1, Spring 1994, pp. 73-109.
doi:10.2307/3117016
[22] J. Barney, “Firm Resources and Sustained Competitive Advantage,” Journal of Management, Vol. 17, No. 1, March 1991, pp. 99-120.
doi:10.1177/014920639101700108
[23] R. P. Rumelt, “Towards a Strategic Theory of the Firm,” In: R. Lamb, Ed., Competitive Strategic Management, Prentice-Hall, New Jersey, 1984, pp. 556-570.
[24] B. Wernerfelt, “A Resource-Based View of the Firm,” Strategic Management Journal, Vol. 5, No. 2, April-June 1984, pp. 171-180. doi:10.1002/smj.4250050207
[25] A. S. Bharadwaj, “A Resource-Based Perspective on Information Technology Capability and Firm
Perform-ance: An Empirical Investigation,” MIS Quarterly, Vol. 24, No. 1, March 2000, pp. 169-196.
doi:10.2307/3250983
[26] S. Devaraj and R. Kohli, “Performance Impacts of Infor-mation Technology: Is Actual Usage the Missing Link?” Management Science, Vol. 49, No. 3, March 2001, pp. 273-289. doi:10.1287/mnsc.49.3.273.12736
[27] K. Zhu, “The Complementarity of Information Technol-ogy Infrastructure and E-Commerce Capability: A Re-source-Based Assessment of Their Business Value,” Journal of Management Information Systems, Vol. 21, No. 1, Summer 2004, pp. 167-202.
[28] G. Ray, W. A. Muhanna and J. Barney, “Information Technology and the Performance of the Customer Service Process: A Resource-Based Analysis,” MIS Quarterly, Vol. 29, No. 4, December 2005, pp. 625-652.
[29] F. Wu, S. Yeniyurt, D. Kim and T. Cavusgil, “The Impact of Information Technology on Supply Chain Capabilities and Firm Performance: A Resource-Based view,” Indus-trial Marketing Management, Vol. 35, No. 4, May 2006, pp. 493-504. doi:10.1016/j.indmarman.2005.05.003
[30] S. M. Huang, C. S. Ou, C. M. Chen and B. Lin, “An Em-pirical Study of Relationship between IT Investment and Firm Performance: A Resource-Based Perspective,”
Eur-opean Journal of Operational Research, Vol. 173, No. 3, September 2006, pp. 984-999.
doi:10.1016/j.ejor.2005.06.013
[31] R. Sabherwal and Y. E. Chan, “Alignment between Busi-ness and IS Strategies: A study of Prospectors, Analyzers and Defenders,” Information Systems Research, Vol. 12, No. 1, March 2001, pp. 11-33.
doi:10.1287/isre.12.1.11.9714
[32] B. Dehning, V. J. Richardson and R. Zmud, “The Value Relevance of Announcements of Transformational In-formation Technology Investments,” MIS Quarterly, Vol. 27, No. 4, December 2003, pp. 637-656.
[33] W. Oh and A. Pinsonneault, “On the Assessment of the Strategic Value of Information Technologies: Conceptual and Analytical Approaches,” MIS Quarterly, Vol. 31, No. 2, June 2007, pp. 239-265.
[34] T. Ravichandran and C. Lertwongsatien, “Effect of In-formation Systems Resources and Capabilities on Firm Performance: A Resource-Based Perspective,” Journal of Management Information Systems, Vol. 21, No. 4, pp. 237-276.
[35] F. J. Mata, W. L. Fuerst and J. B. Barney, “Information Technology and Sustained Competitive Advantage: A Resource-Based Analysis”, MIS Quarterly, Vol. 19, No. 4, December 1995, pp. 487-505.
doi:10.2307/249630
[36] T. C. Powell and A. D. Micallef, “Information Technol-ogy as Competitive Advantage: The Role of Human, Business and Technology Resources,” Strategic Man-agement Journal, Vol. 18, No. 5, May 1997, pp. 375-405.
doi:10.1002/(SICI)1097-0266(199705)18:5<375::AID-S MJ876>3.0.CO;2-7
Empirical Investigation of Net-Enabled Business Value,” MIS Quarterly, Vol. 28, No. 4, December 2004, pp. 585- 620.
[38] J. Barney, M. Wright and D. J. Jr. Ketchen, “The Re-source-Based View of the Firm: Ten Years after 1991,” Journal of Management, Vol. 27, No. 1, December 2001, pp. 625-641. doi:10.1177/014920630102700601
[39] R. M. Grant, “The Resource-Based Theory of Competi-tive Advantage: Implications for Strategy Formulation,” California Management Review, Vol. 33, No. 3, Spring 1991, pp. 114-135.
[40] T. A. Byrd and E. D. Turner, “Measuring the Flexibility of Information Technology Infrastructure,” Journal of Management Information Systems, Vol. 17, No. 1, sum-mer 2000, pp. 167-208.
[41] G. Hamel, “The Concept of Core Competence,” In: G. Hamel and A. Heene, Eds., Competence-Based Competi-tion, Wiley, New York, 1994, pp: 11-33.
[42] K. C. Laudon and J. P. Laudon, “Management Informa-tion Systems: Managing the Digital Firm,” Prentice Hall, 2006.
[43] J. A. Hoffer, J. F. George and J. S. Valacich, “Modern System Analysis & Design,” Prentice Hall, 2001. [44] V. Grover, K. Fiedler and J. Teng, “Empirical Evidence
on Swanson’s Tri-Core Model of Information Systems Innovation,” Information Systems Research, Vol. 8, No. 3, September 1997, pp. 273-87.
doi:10.1287/isre.8.3.273
[45] M. Hannan and J. Freemani, “Structural Inertia and
Or-ganizational Change,” American Sociological Review, Vol. 49, No. 2, April 1984, pp. 149-164.
doi:10.2307/2095567
[46] T. A. Byrd, E. H. Thrasher, T. Lang and N. W. Davidson, “A Process-Oriented Perspective of IS Success: Examin-ing the Impact of IS on Operational Cost,” Omega, Vol. 34, No. 5, October 2006, pp. 448-460.
doi:10.1016/j.omega.2005.01.012
[47] J. Hulland, “Use of Partial Least Squares (PLS) in Strate-gic Management Research: A Review of Four Recent Studies,” Strategic Management Journal, Vol. 20, No. 2, February 1999, pp. 195-204.
doi:10.1002/(SICI)1097-0266(199902)20:2<195::AID-S MJ13>3.0.CO;2-7
[48] S. Petter, D. Straub and A. Rai, “Specifying Formative Constructs in Information Systems Research,” MIS Quarterly, Vol. 31, No. 4, December 2007, pp. 623-656. [49] M. Tenenhaus, V. E. Vinzi, Y. Chatelin and C. Lauro,
“PLS Path Modeling,” Computational Statistics & Data Analysis, Vol. 48, No. 1, January 2005, pp. 159-205.
doi:10.1016/j.csda.2004.03.005
[50] C. Fornell and D. F. Larcker, “Evaluating Structural Equation Models with Unobservable Variables and Measurement Error,” Journal of Marketing Research, Vol. 18, No. 1, February 1982, pp. 39-50.
doi:10.2307/3151312