THE QUEST FOR GROWTH IN DEVELOPING COUNTRIES:
AN ANALYSIS OF THE EFFECTS OF FOREIGN AID ON
ECONOMIC GROWTH
Daniel Chris Khomba
A Thesis Submitted for the Degree of PhD at the
University of St Andrews
2017
Full metadata for this item is available in St Andrews Research Repository
at:
http://research-repository.st-andrews.ac.uk/
Please use this identifier to cite or link to this item:
http://hdl.handle.net/10023/11034
The Quest for Growth in Developing
Countries: An Analysis of the Effects of
Foreign Aid on Economic Growth
Daniel Chris Khomba
This thesis is submitted in partial fulfillment for the degree of
Doctor of Philosophy (Economics) at the
University of St. Andrews
1. Candidate’s declarations
I, Daniel Chris Khomba, hereby certify that this thesis, which is approximately 68,876
words in length, has been written by me, and that it is the record of work carried out by
me and that it has not been submitted in any previous application for a higher degree.
I was admitted as a research student in September 2013 and as a candidate for the
degree of PhD Economics in September 2013; the higher study for which this is a record
was carried out in the University of St. Andrews between 2013 and 2016.
Date: May 1, 2017. Signature of candidate: .
2. Supervisor’s declarations
I hereby certify that the candidate has fulfilled the conditions of the Resolution and
Reg-ulations appropriate for the degree of PhD Economics in the University of St. Andrews
and that the candidate is qualified to submit this thesis in application for that degree.
3. Permission for publication
In submitting this thesis to the University of St. Andrews I understand that I am giving
permission for it to be made available for use in accordance with the regulations of the
University Library for the time being in force, subject to any copyright vested in the work
not being affected thereby. I also understand that the title and abstract will be published,
and that a copy of the work may be made and supplied to any bona fide library or research
worker, that my thesis will be electronically accessible for personal or research use, and
that the library has the right to migrate my thesis into new electronic forms as required
to ensure continued access to the thesis. I have obtained any third-party copyright
per-missions that may be required in order to allow such access and migration.
Date: May 1, 2017. Signature of candidate: .
Date: May 1, 2017. Signature of supervisor: .
Address for correspondence:
School of Economics & Finance University of St. Andrews St. Andrews
Fife, UK KY16 9AL
4. Acknowledgments
I would like to thank God for being graceful and merciful to me; through the tough times,
he gave me strength and hope. In this work, He has fulfilled a dream in my life that I
barely even had. It is a true testimony to his never ending love.
I am profoundly indebted to my Supervisors, Dr Alex Trew and Dr Gonzalo
Forgues-Puccio. I would like take this opportunity and express special appreciation and thanks
for supervising my research and being there throughout and encouraging me, particularly
in the hard times. Thank you for your patience with me; for your faith when I doubted
myself; your priceless advice and guidance, not only about academic research but also life
in general.
I would also like to express my gratitude to the School of Economics and Finance. I am
very grateful for the enormous support I received through the years. Special thanks to
Professor Marco Mariotti, Professor Paola Manzini, Professor Miguel Costa-Gomes, Dr
Margaret Leighton, Dr Ozge Senay and Dr Peter Macmillan. Special mention to Caroline
Moore, Angela Hodge, Liz Pert-Davis and Eliana Wilson for your support in many ways.
Many thanks to the University of St Andrews for funding my research, my studies would
not have been possible without the financial assistance I received.
To my family, no words can adequately convey my gratitude and appreciation: Alinafe
Kabango, my wife, I would not have reached thus far without your love. You gave up so
much of your life to enable me study, you pushed me on when I was weary. Your faith
helped me believe in myself. Ethan Khomba, my son, you helped me relax on the most
stressful days. I am forever grateful to you both. The Khomba’s (Madalitso, Stanley Jr,
Chikumbutso, Henderson, Tiyanjane and Tisaiwale), your love and encouragement was
immeasurable. Thank you.
I would also like to mention different people who made important contributions at various
stages of my studies: Nikolay Chernyshev, Dr Luigi Pascali, Sarah Mechan, Dr Stelios
Finally, to the friends and colleagues that I have met in St Andrews, you made this
journey a lovely experience. Dr Sean Talamas, Dr Justin Snedegar, Chris Peys, Andreas
Papamichail, Sinan Corus, Nayha Mansoor, Zhibo Xu, Larissa Laura Feuchtm¨uller and
many more I cannot mention. Thank you very much for being there, for your kindness
To the memory of my parents
Abstract
Large quantities of foreign development assistance continue to flow to many developing
countries. At the same time, most of the aid-receiving countries have stagnated and
become even more aid-dependent. This grim reality provokes vigorous debate on the
effectiveness of aid. Despite the voluminous research on aid effectiveness, clear evidence
to support the view that development aid stimulates economic growth remains scant.
This thesis intends to extend the existing literature on foreign aid and economic growth.
First we re-examine results from cross-country studies to provide new insights on the lack
of robustness of results from this approach. We further explore and deepen the observation
that cross-country results are fragile, particularly when the number of countries in the
sample changes. Secondly, we study the impact of district-level aid disbursement on the
growth of average nighttime light density in Malawi. We use two plausibly exogenous
determinants of within-country aid allocation to isolate the causal effects of aid. The
results show a robust and quantitatively significant effect of aid flows in stimulating growth
of light density. We find a hump-shaped growth response over three years. Finally, the
thesis presents a theoretical model that explores how aid affects economic growth and
welfare in an economy with subsistence constraints. The main results from this analysis
are; (i) productive aid has higher long run growth and welfare effects than pure aid (ii)
the rate of convergence depends crucially on how close the initial conditions are to the
subsistence level (iii) while growth effects are maximised when all the aid is allocated to
productive aid, we find that optimal welfare is reached when some proportion of aid is
Contents
1 Introduction 1
1.1 Foreign Aid and Economic Growth in Developing Countries: An Overview 1
1.2 The Effect of Aid on economic growth in developing countries . . . 5
1.3 Brief Recap of Foreign Aid . . . 7
1.3.1 Definition of Aid . . . 7
1.3.2 Evolution of Aid . . . 10
1.3.3 Trends in net ODA flows . . . 16
1.3.4 Structure of the thesis . . . 20
Appendices 22 1.A Figures . . . 22
1.B Tables . . . 23
2 Literature Review 24 2.1 Review of the theoretical literature on aid-growth nexus . . . 24
2.1.1 Financing gap models (aid-savings-investment-growth) . . . 24
2.1.2 Poverty trap models (the Big Push) . . . 27
2.1.3 Endogenous Growth and Fundamental Determinants of Growth . . 33
2.2 Summary of the Existing Empirical Literature on Aid Effectiveness . . . . 36
2.2.1 Capital accumulation models: 1st and 2nd generation studies . . . . 37
2.2.2 Conditional growth models: 3rd generation studies . . . 41
2.3 Summary . . . 44
3.2 Contemporary aid-growth empirics: An analysis of cross-country aid-growth
regressions . . . 48
3.2.1 Data limitations . . . 48
3.2.2 Narrow scope of measuring aid effectiveness . . . 54
3.2.3 Model uncertainty . . . 55
3.2.4 Endogeneity . . . 56
3.2.5 Cross-country heterogeneity . . . 59
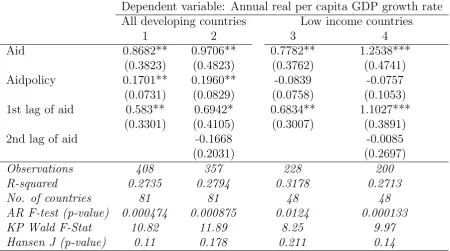
3.3 Aid, policies and growth . . . 60
3.3.1 Robustness checks on aid, policies and growth . . . 61
3.3.2 Discussion . . . 67
3.4 Specification issues . . . 74
3.4.1 Policy selectivity or diminishing returns . . . 74
3.4.2 Outliers . . . 78
3.4.3 Lags . . . 79
3.4.4 Instruments . . . 83
3.5 Evolution of the Impact of Aid on Growth . . . 86
3.5.1 Discussion . . . 92
3.6 Conclusion . . . 100
Appendices 101 3.A Classical Errors-in-variables (CEV) . . . 101
3.B Figures . . . 102
3.C Tables . . . 106
4 Shedding Light on Aid in Malawi: An Analysis of the Effects of Aid on Growth Using Evidence from Malawi 110 4.1 Introduction . . . 111
4.1.1 Why Malawi? . . . 115
4.2 Background and Context . . . 118
4.2.1 Malawi’s economic performance . . . 119
4.2.2 Trends in Malawi’s foreign aid . . . 126
4.2.3 Politics and Government spending Malawi . . . 127
4.3 Data . . . 131
4.4 Empirical Strategy . . . 136
4.4.1 First instrument: Ethnic Affinity . . . 139
4.4.2 Second instrument: Political switching . . . 145
4.5 Main Results . . . 150
4.5.1 Discussion of the main results . . . 155
4.6 Robustness Checks . . . 157
4.7 Extensions . . . 160
4.7.1 Time lags . . . 160
4.7.2 Project type . . . 162
4.7.3 Funding type . . . 164
4.8 Conclusion . . . 165
Appendices 167 4.A Figures . . . 167
4.B Tables . . . 171
5 Foreign Aid and Government Spending in an Endogenous Growth Model with Subsistence Consumption 182 5.1 Introduction . . . 182
5.1.1 A Brief Note on Subsistence . . . 184
5.2 Related Literature and Contribution . . . 187
5.3 A Growth Model with Subsistence Consumption: Recap of Steger's Model 193 5.3.1 Steger (2000) Model . . . 194
5.3.3 Foreign aid in Steger’s model: An extension . . . 203
5.4 Government Spending and Public Capital Accumulation . . . 210
5.4.1 Analytical Framework . . . 211
5.4.2 Dynamic General Equilibria . . . 218
5.4.3 Transitional Dynamics . . . 226
5.4.4 Dynamic Effects of Foreign Aid and Its Allocation . . . 230
5.4.5 Numerical Analysis of the Effects of Aid . . . 234
5.5 Conclusion . . . 242
Appendices 244 5.A Solving Steger (2000) Model . . . 244
5.B Solution to the model with public capital . . . 249
5.C Tables . . . 254
6 Conclusion 256
List of Figures
1.3.1 Trends in Official Development Assistance (current prices) . . . 17
1.A.1 Trend for net ODA per capita, (constant 2014 US$) . . . 22
1.A.2 Trends in net private flows (constant 2014 US$prices) . . . 22
2.2.1 Causal structure of the three generations of empirical aid and growth link 37 3.3.1 Annual GDP and population growth rates: low income and middle in-come countries (1970-2013) . . . 73
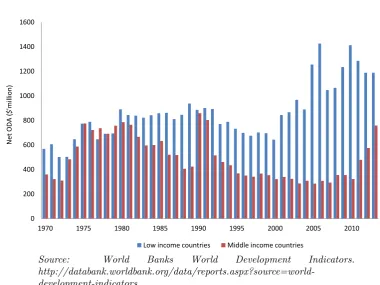
3.5.1 Net ODA disbursements (1970-2013) . . . 94
3.5.2 Evolution of the effect of aid in 20-country window (1970-2013) for all developing countries (full sample) . . . 95
3.B.1 Partial scatter of aid*policy using ELR original and its extended dataset 102 3.B.2 Partial scatter of aid*policy for BD original and ELR cross-sectionally extended dataset . . . 103
3.B.3 Evolution of the effect of aid in 20-country window (1970-2013): Middle income countries . . . 104
3.B.4 Evolution of the effect of aid in 20-country window (1970-2013): Low income countries . . . 105
4.2.1 Trend of Malawi’s per capita GDP (1970 – 2010) . . . 121
4.2.2 Trends in net ODA (% of GNI) and total reserves (months of import) . 126 4.2.3 Net aid to Malawi and other regions . . . 127
4.2.4 Timeline of recent Malawian politics . . . 128
4.3.1 Nighttime images for Malawi in 1999 (left) and 2010 (right) . . . 133
4.3.2 Location of geocoded projects in Malawi . . . 134
4.4.1 Spatial distribution of ethnic groups in Malawi . . . 140
4.4.2 Allocation of aid in the periods 2002-2004 and 2005-2005 . . . 141
4.4.3 Map of political change in Malawi between 2004 and 2005 . . . 149
4.7.1 Results for estimation with lagged aid . . . 161
4.7.2 Results for estimation with lags of health aid . . . 163
4.A.1 Skewness of the Aid variable . . . 167
4.A.2 Skewness of the Light intensity variable . . . 167
4.A.3 Malawi development policies and reforms (1970-2020) . . . 168
4.A.4 Zoomed in image of Lilongwe (2013) . . . 169
4.A.5 Lagged agriculture aid . . . 169
4.A.6 Lagged education aid . . . 170
5.3.1 Time path for the growth rate of output (and capital) . . . 199
5.3.2 Time path for the consumption/capital ratio . . . 201
5.3.3 Time path for the saving rate . . . 203
5.3.4 Growth rate of capital (and output) . . . 206
5.3.5 Time path for the saving rate . . . 208
5.4.1 Time path for the growth rate of capital and output . . . 224
5.4.2 Effect of aid on the time path of saving rate . . . 236
5.4.3 Effect of aid on the time path of growth rate of capital and output . . . 237
5.4.4 Effect of aid on the time path of saving rate . . . 238
5.4.5 Effect of the allocation of aid on the time path of growth rate of capital and output . . . 239
List of Tables
1.3.1 Net ODA by DAC donors (US$ million) . . . 19
1.3.2 Total ODA received per region (US$ millions) . . . 20
1.B.1 Overview of the key developments in the history of foreign aid . . . 23
2.2.1 Conclusions from the surveyed 31 cross country regressions . . . 39
3.2.1 PWT state of development vs data quality . . . 50
3.2.2 Instrumental variables used in the existing literature . . . 59
3.3.1 Replication of BD and ELR results, using 2SLS . . . 63
3.3.2 Results from 2SLS regressions using time series extension of ELR dataset 65 3.3.3 Results from 2SLS regressions using cross-sectional extension . . . 66
3.3.4 Results from 2SLS regressions using the full DK sample . . . 68
3.3.5 2SLS regressions with alternative samples . . . 70
3.4.1 2SLS regressions with different specifications using reconstructed dataset 77 3.4.2 2SLS regression results for estimation with lags as explanatory variables 80 3.4.3 2SLS regression results for estimation with lags as instrumental variables 82 3.4.4 Results of regressions with population in second stage of 2SLS . . . 85
3.5.1 OLS growth regressions with pure cross sectional data . . . 88
3.5.2 2SLS results using 5-year averages panel data (1970-2013) . . . 90
3.5.3 Summary of 2SLS growth regressions with individual 5-year cross sections 92 3.5.4 Number of countries in debt crisis during 5 year periods (1970-2013) . . 98
3.5.5 Results from 2SLS regressions using 5-year average panel data, by crisis status (1970 - 2013). . . 99
3.C.1 Comparison of average growth rates in African countries (1975-1999) . . 106
3.C.2 Correlations between ELR data and our reconstructed dataset . . . 106
3.C.4 List of countries in ELR and DK full sample . . . 107
3.C.5 2SLS regressions for growth of real GDP per capita, using alternative samples . . . 108
3.C.6 List of countries and years of crisis . . . 109
4.2.1 Selected socio-economic indicators for Malawi (1970-2015) . . . 120
4.2.2 Brief summary of government fiscal performance ( in million Malawi Kwacha) . . . 125
4.2.3 Aid disbursement by Sector (2009 - 2011) ($’000) . . . 127
4.4.1 Results for OLS regression of district vote share . . . 143
4.4.2 District vote shares received by Dr Bingu wa Muntharika . . . 144
4.4.3 Composition of Parliament and Defections (1999 - 2013) . . . 148
4.5.1 Regression results for estimation with ethnic affinity instrument . . . 151
4.5.2 Regression results for estimation with political switching instrument . . 153
4.5.3 Results with both instrument . . . 154
4.7.1 Regression results for estimation using aid to the three sectors of Agri-culture, Education and Health . . . 162
4.7.2 Regression results for estimation using types of aid . . . 164
4.B.1 List of Malawi districts used in the study . . . 171
4.B.2 Data descriptions and sources . . . 172
4.B.3 District level descriptive statistics . . . 173
4.B.4 Results with both instrument (GMM estimation) . . . 174
4.B.5 Robustness checks 1/2 . . . 175
4.B.6 Robustness checks 2/2 . . . 176
4.B.7 Results for specification with light per capita as dependent variable . . . 177
4.B.8 VIF test results . . . 178
4.B.9 Lags . . . 179
4.B.10 Regression results for estimation using aid to the three sectors of Agri-culture, Education and Health . . . 180
5.1.1 Ratio of per capita incomes and World Bank poverty lines . . . 186
5.4.1 Parameter values for the benchmark economy . . . 235
5.C.1 Parameter values for the Steger model simulation . . . 254
5.C.2 List of high income countries: OECD . . . 254
5.C.3 List of upper middle income countries . . . 254
5.C.4 List of lower middle income countries . . . 254
5.C.5 List of low income countries . . . 255
5.C.6 List of Sub-Saharan Africa countries (all income levels) . . . 255
5.C.7 List of least developed countries (UN classification) . . . 255
Abbreviations
2SLS Two-Stage Least Squares
AMP Aid Management Platform
CES Constant Elasticity of Substitution
DAC Development Assistance Committee
DfID Department for International Development
DMSP Defense Meteorological Satellite Programme
DPP Democratic Progressive Party
EMIS Education Management Information Systems
FDI Foreign Direct Investment
FISP Farm Input Subsidy Programme
GDP Gross Domestic Product
GIS Geographic Information System
HIPC Highly Indebted Poor Countries
HLFs High Level Forums
ICRG International Country Risk Guide
IDA International development Agency
IES Intertemporal Elasticity of Substitution
IMF International Monetary fund
IV Instrumenta Variable
LDCs Least Developed Countries
MCP Malawi Congress Party
MDGs Millenium Development Goals
MGDS Malawi Growth and Development Strategy
MoAFS Ministry of Agriculture and Food Security
MoEST Ministry of Education, Science and Technology
MPs Members of Parliament
NGDC National Geographic Data Centre
NLGFC National Local Government Finance Committee
NOAA National Oceanic and Atmospheric Administration
NSO National Statistical Office
ODA Official Development Assistance
OECD Organisation for Economic Co-operation and Development
OEEC Organisation for European Economic Co-operation
OLS Ordinary Least Squares
PP Peoples Party
PSIP Public Sector implementation Programme
PWT Penn World Tables
SDGs Sustainable Development Goals
SGP Stone-Geary Preferences
SSA Sub Saharan Africa
SWAp Sector Wide Approach
UDF United Democratic Front
USAID United Stated Agency for International Development
Chapter 1
Introduction
”It is ironic that the volume of aid is declining just as the environment for effective aid
is improving. By increasing financial assistance to poor countries . . . , we could help
hundreds of millions of the poorest people in the world to improve their lives, and the
lives of their children.”
David Dollar, (World Bank’s News Release, 1998).
1.1
Foreign Aid and Economic Growth in Developing
Countries: An Overview
Since 1960, over US$2.4 trillion1 of foreign development aid has been transfered from the
developed world to Least Developed Countries (LDCs). During the 1990s however, there
was a notable declining trend in aid flows to developing countries. At the time David
Dollar gave the above quote, official development assistance (ODA) had declined from
about US$91.8 billion in 1991 to about US$72 billion in 1998. The end of the Cold War
in particular had resulted in a marked reduction in foreign development assistance, as the
objectives for giving aid also shifted.
Over the last decade, however, international financial flows to low income countries,
par-ticularly in Sub Saharan Africa region, have grown six-fold and averages about 18% of
GDP, (GDI (2012))2. In 2012 alone, over US$133 billion of ODA was disbursed to
devel-oping countries. Additionally, aside from the increase in flows of development assistance
to least developed countries, from the late 1990s and into the 21st Century, the
inter-national community also intensified efforts in improving the environment for making aid
more effective. International agreements have been put in place setting out initiatives
for increasing donor coordination, to strengthen recipient countries’ capacity in
develop-ing and implementdevelop-ing national strategies and reducdevelop-ing or eliminatdevelop-ing aid conditionality
to improve alignment with country development goals. Further commitments have been
agreed to manage resources for improving results from aid initiatives as well as developing
comprehensive systems for monitoring and evaluation of the intended impact of aid.
Despite the increase in aid flows and the renewed emphasis and attention to improving
the environment for effective aid, the experience with economic growth within the LDCs
(particularly in SSA nations) remains deeply disappointing, with falling average per-capita
incomes and in many developing countries escalating poverty levels. Easterly (2001)
points out that the median per capita growth of output in developing countries was 2.5%
between 1960 and 1979 while between 1980 and 1999 it declined to 0.0%. In essence
many developing countries stagnated between 1980 and 1999. Furthermore, from the
1990’s, least developed countries have experienced increasing marginalisation, inequality,
poverty and social exclusion. The number of countries classified by the World Bank as
LDCs doubled from the list compiled in 1979 to 49 countries by 2001, with a number
of African countries experiencing negative economic growth rates in the 1980s and 1990s
(White (1992)).
Thus, while declining aid flows to developing countries may indeed be a matter of concern,
recent experience does not offer much evidence to support Dollar’s view that increasing
financial flows would lead to improving livelihood for generations of poor people in least
developed countries either. Scaling up of ODA has prospects for a better future for
developing countries, but it certainly also continues to raise serious challenges for policy
makers and academia alike. Heller (2005) and Gupta et al. (2006) identified a checklist
of some of the policy challenges that they argue will determine the success of scaling
up aid flows, and hence require concerted analysis and assessment, along with lessons
learnt from past experiences. These challenges include, among others, managing the
macroeconomic effects of scaling up aid and its effect on the competitiveness of recipient
countries, preventing aid dependency and developing an exit strategy, management of
fiscal and monetary policy and the delivery of public services, strengthening domestic
institutions and governance structures and reducing corruption.
significantly over time. In the 1960s and 1970s it was provided to assist in state building
as many developing nations gained independence from their colonial rulers. It then gained
momentum during the Cold War era when development cooperation, and foreign aid in
particular, was used to ‘buy’ elites and form alliances and thus influence affairs in third
world countries. Developmental goals of aid were at the time a secondary or incidental
outcome.
The primary reason for financial flows to Least Developed Countries (LDCs) in recent
times is “to spur economic growth that will generate development so that poverty, one of
the worst problems facing human race today, can be reduced,” Sachs et al. (2004).
Sub-Saharan Africa, the most impoverished region in the world, is perhaps unsurprisingly the
most financially aided region in the developing world. In the last two decades, the rhetoric
for aid has increasingly shifted towards addressing challenges of under-development and
extreme poverty that induces human suffering including hunger and starvation, lack of
proper shelter/dwellings and inability to afford basic education. These culminate into
health conditions that have come to be termed ‘diseases of poverty’ such as chronic
mal-nutrition, HIV/AIDS, Malaria etc.
The new direction was further intensified in the new millennium by the events of 11th
September, 2001 (terrorist attacks on New York and the Pentagon) as the industrialized
world realized the increasing significance of developing countries to global security. For
example, several developing countries in Asia and Africa have served as staging points for
terrorism and other threats. It has been recognized that persistent poverty and
under-development leaves LDCs in a very vulnerable position that is easily exploited by extremist
organizations.3
Consequently, there have been intensified efforts by the donor community in
mobiliz-ing resources for development aid, with volumes of aid to developmobiliz-ing countries surgmobiliz-ing
since the turn of the millennium.4 The Millennium Development Goals were created to
provide a framework agreed by all countries as well as leading aid agencies and
develop-ment institutions to galvanize unprecedented efforts to meet the challenges faced by the
3While some evidence has found little direct link between poverty or education and participation in terrorism, Krueger and Maleckova (2003) find that poverty may indirectly affect terrorism through the link between economic conditions and proclivity to incidence of civil conflict and wars.
world’s poorest communities.5 Having reached the target date in 2015, Heads of State
and Government and High Representatives gathered at the Third International
Confer-ence on Financing for Development in Addis Ababa (Ethiopia) in July 2015 for theAddis
Ababa Action Agenda where the Sustainable Development Goals (SDGs) were agreed to
replace the elapsed MDGs. Building on previous agreements of development financing,6
the SDGs7 are an enhanced framework to mobilise resources for the fight against extreme
poverty and strengthen universal peace.
The grim reality facing the international development policy arena with regards to
scaling-up of aid amidst seemingly ever increasing levels of economic malaise, extreme poverty and
very low economic growth rates has raised a lot of concerns over the effectiveness of foreign
transfers and their ability to promote sustainable growth and development. Questions like
”What is effective aid?” and ”Does aid work or not?” have become a source of substantial
debate among academic researchers, policy makers and aid practitioners alike over the
past 7 decades.
The objective of this thesis is to contribute to the literature on the impact of foreign
aid and economic growth; to do this we conduct have a critical analysis of the existing
literature and identify some of the main challenges contributing to the never-ending debate
about the effects of aid. Since we discuss the existing literature in detail in the forthcoming
chapters, we do not go deeply into the literature review in this introduction, instead the
remaining sections of this chapter present some background analysis of the effect of aid
on growth, the definitions of aid and how this affects measurements of aid, the evolution
of the notion of aid and some trends in aid flows.
5The eight Millennium Development Goals (MDGs) range from halving extreme poverty rates to halting the spread of HIV/AIDS and providing universal primary education, all by the target date of 2015.
6Including the Monterrey Consensus in 2002, the Paris Declaration in 2005 and the Doha Declaration in 2008
1.2
The Effect of Aid on economic growth in
devel-oping countries
The extent to which foreign aid can impact on the growth rate of output is still a matter
of great controversy. Over the years, the assessment of the effectiveness of aid has been
conducted based on different underlying theoretical growth models and econometric
ap-proaches, using both microeconomic and macroeconomic evidence. The results from such
different approaches have also been just as different. In particular it is observed that when
microeconomic approaches are employed, often by assessing directly the economic rate of
return of individual aid financed projects or in recent years by using randomised trials,
the results indicate some considerable success for the effectiveness of foreign aid. The
most comprehensive evaluations in this approach have been done by the World Bank’s
In-dependent Evaluation Group (IEG), through rigorous country assessment of World Bank
financed projects (World Bank (2008)) and report positive and significant effects of aid.
Further, Banerjee and Duflo (2009) discuss in more detail the evidence and
contribu-tion from randomised field experiments which also provide positive effects of aid from
microeconomic evidence.
On the other hand, the evidence from macroeconomic approaches to the evaluation of
aid’s impact on economic growth and development is at best conflicting. Some scholars
such as Sachs et al. (2004) argue for increased financial flows to developing countries to
uplift such economies from poverty traps and and lead them to the end of poverty. Others
such as Burnside and Dollar (2000) take a cautious approach recommending that more
aid is beneficial but only if allocated to countries with ’good’ policies. At the same time,
Rajan and Subramanian (2008) conclude that it is difficult to discern any systematic effect
of foreign aid on economic growth and Moyo (2009) argues for complete cessation of aid
flows to Africa.
Mosley et al. (1987) labeled this contradiction as the micro-macro paradox and offered
three explanations for its causes, pointing to some of the weaknesses of the
macroeco-nomic approach to assessing the impact of aid. The first explanation regards inaccurate
sector8 and the last explanation is potential negative effect of aid on investment and hence
on output. Furthermore, White (1992) claims there are some genuine reasons for not
ex-pecting effects of aid on growth in the aggregate, giving some further explanations for the
existence of the micro-macro paradox including problems as a result of over-aggregation
across countries in cross-country studies.
From 1990s, new growth theory emerged recognising that physical capital accumulation
could no longer be regarded as the only source of economic growth9. This approach
re-ignited the aid effectiveness literature by focusing on the interaction between foreign aid
and other factors in the recipient countries such as policies, institutional capacity and
other geophysical features. Much of the empirical assessment of the impact of aid on
growth since then has regarded the effect of stable macroeconomic environment
includ-ing international trade regimes, property rights, quality of institutions includinclud-ing public
services as well as political and social stability and how these factors affect the effects of
foreign aid. Probably the most popular empirical study that argues for the positive effects
of aid conditional on sound macroeconomic management and good quality institutions is
the study by Burnside and Dollar (2000). The findings of this study10prompted many
de-velopment partners to reconsider the role of aid and its strategies in spurring sustainable
economic growth and development.
In general, the results of aid effectiveness assessments have been largely influenced by
the lack of a unanimously accepted complete theory of the aid-growth relationship that
can guide the direction of empirical evaluation. As a result, the persisting elusiveness
of robust empirical evidence that can support aid effectiveness has often been attributed
to the macroeconometric methodologies for cross-country analysis. In addition, the prior
analyses of aid effectiveness failed to include such as the issues the heterogeneous nature
of the developing world. Different stages of economic development and wide cultural
diversity makes state and institutional capability vary significantly from one country to
another. This has brought doubts over the results from cross-country studies about the
effect of aid on economic growth.
8Aid fungibility means that a government can increase resources through the aid inflows, to increase spending, fund tax cuts, or reduce the fiscal deficit (reducing future tax). This would cause a negative impact of aid on growth (World Bank, 1998).
9see Easterly (1999) and Easterly and Levine (2001).
1.3
Brief Recap of Foreign Aid
Foreign Aid in Perspective
Development assistance has now accumulated over seven decades of experience, growing
into an international operation transferring massive amounts of resources to developing
countries and employing multitudes of people in many agencies and organizations around
the world. From modest origins in the nineteenth century, the concept of aid grew through
various stages, becoming established in the post-World War II and Cold War eras and
playing a significant role in political development of the third world during the wave of
independence in the 1960s and transition to liberal democracies in the 1990s.
Over the years, there have been notable changes in the objectives and strategies for aid;
institutions involved (rise of multilateral institutions in the 1970s and Non-Governmental
Organizations (NGOs) in the 1980s and 1990s); types of aid (from food aid to financial
programme aid) as well as further changes in the size, composition and allocation of
aid to developing countries. This section gives a brief recap of the background to the
notion of foreign development assistance, discussing issues related to the definition and
measurement of aid, an overview of the evolution of aid and a look at the trends and
patterns in aid flows.
1.3.1
Definition of Aid
It is now a common practice in the literature to define foreign aid by considering its
intended purpose, realising that aid for different purposes will probably have different
impact on development. For instance, aid given to promote economic reforms or for
infrastructure development would be expected to have short run and possibly greater
in-fluence on growth than military aid (without ignoring the possible indirect effects that
military aid may have on long run development). In light of this, distinction is made
between two broad categories of aid:
a) Humanitarian/Relief aid referring to financial flows, material donations or logistical
assistance mainly provided in response to natural or man-made humanitarian crises
with the primary aim of saving lives, preventing or alleviating bodily harm and
b) Development aid (non-humanitarian aid) is given in a manner that can reasonably
be expected to promote development, understood to be improvements in human
well-being and alleviation of poverty, whether achieved through economic growth,
social, environmental and political development or other means.
When conducting aid effectiveness analysis, only development aid is considered in the
lit-erature. Development aid in itself takes many different forms, as such there is some degree
of ambiguity in the literature on the terminology for foreign aid, and its measurement.
For some authors, development aid comprises all financial flows from donor countries and
institutions to developing countries including official loans and grants, trade financing
military grants etc. while others only consider aid to mean grants and concessional loans.
What has become the conventionally accepted definition of development aid in the
litera-ture and the development community, not least in terms of its size and influence, is ODA,
introduced in the 1970’s by the Development Assistance Committee (DAC) of the
Or-ganization for Economic Co-operation and Development (OECD). As per this definition,
ODA comprises all official flows (financial or otherwise) disbursed from bilateral donors or
multilateral institutions to developing countries listed on the DAC ‘List of Aid Recipients’
for the primary purpose of promoting economic development and social welfare.
According to the OECD, in order to be classified as ODA, flows should satisfy the following
criteria: (i) they must be administered by the official sector of the donor country (ii) have
as a primary objective the promotion of economic development and social welfare and (iii)
must be given on concessional terms with a grant element, i.e. an implicit subsidy included
on the loan of at least 25% of the face value of the loan, calculated as the ratio of the grant
equivalent part of the loan to the face value of a concessional loan and discount rate of
10%. In addition to financial flows, ODA also includes technical assistance or technical
co-operation costs, however it does not include grant, loans/credits or equipment for military
or peace-keeping purposes and nuclear energy (unless for civilian use). Transfer payments
to private individuals, donations from the public, commercial loans and foreign direct
investment (FDI) are also not considered as part of ODA.
It has become common in the literature to treat ODA and development aid (or indeed
activities of NGO’s and other faith/charitable organizations have increased and contribute
quite significantly to societies’ economic empowerment and social development in many
developing countries. By definition, this is part of development aid but is not classified
as ODA.
The OECD approach to defining and measuring official development aid has some
short-comings beginning with, perhaps unsurprisingly, that it includes ‘too little.’ By excluding
among others contributions by NGOs, faith based organizations and other charity
in-stitutions, ODA’s cash-flow-based measurement leaves out increasingly important efforts
and the impact that these institutions are playing in the developing world. Further, in
a continually evolving global environment, donors are providing more efforts in terms of
guarantees, callable capital etc. These are not classified as ODA but play important role
in mobilizing investment for development particularly in present times when many
devel-oping countries require huge loans and equity, rather than grants, to boost infrastructure
and finance economic growth (Lomoy (2013)).
On the other hand, other scholars feel that ODA includes ‘too much,’ arguing that it
ac-counts for much more than the actual money that goes into developing countries budgets.
Chang et al. (1998) argue that ODA does not present an accurate measure of the true
value of foreign aid flows by, among others, over-representing loans with high
concession-ality and under-representing loans with low concessionconcession-ality; as well as the inclusion of
official technical assistance (TA) grants with their full value, using constant discount and
interest rates instead of actual market rates and not accounting for credit risk. Other
scholars have pointed to the inclusion of administrative costs, refugee costs etc. as further
sources of distortion to ODA’s measurement of development aid.
Chang et al. (1998) claim that conventional net ODA has overstated the real aid flows by
25 to 30 percent over the last few years. They suggest an alternative approach to ODA in
the form of Effective Development Assistance (EDA), which comprises exclusively grants
and the grant shares of official loans, calculated on a basis of actual interest rates. While
some of the arguments raised by this study are legitimate, others are quite problematic
and lead to underestimation of the actual values of aid, for instance the exclusion of
The foregoing discussion points to an aspect that a researcher must be aware of when
conducting aid effectiveness analysis, defining the scope and measurement of aid being
considered in the analysis. As is conventional in the literature, this research will use
ODA as the preferred measure of development aid. Despite the noted shortcomings,
ODA remains the only systematically and best-recorded means available for assessing the
efforts the ‘traditional’ donors make to support development.
1.3.2
Evolution of Aid
The notion of ‘Foreign Aid’ as known in the modern era is a post-World War II
phe-nomenon. In the aftermath of WWII, the international economic system had collapsed,
and war-ravaged Europe faced a critical shortage of capital and an acute need for physical
reconstruction. The response to this was probably the most successful aid program ever
implemented, the European Recovery Program, popularly known as the Marshall Plan.
It was a bilateral financial assistance programme from the US to Europe, at the peak
of which the USA transferred some 2-3 per cent of its national income to help restore
Europe (approximately 20-30 times the level of foreign assistance as a share of national
income that the US provides today). During the four years that the plan was operational
(1948-1951) the US donated over $13 billion (equivalent of $148 billion in 2013 reflecting
currency inflation)11 in economic and technical assistance for the recovery of European
countries that had joined the Organization for European Economic Cooperation (OEEC),
an organization which later became the Organisation for Economic Cooperation and
De-velopment (OECD).
The success of the Marshall Plan fueled highly optimistic expectations of the future
effec-tiveness of aid. The focus turned to developing countries beginning with the World Bank’s
first loan to Colombia in 1950 and the passing of the United States Act for International
Development (1950) that established the USA’s foreign policy to assist poor countries
around the world (Wolf (1960) and Ohlin (1970)). Channing et al. (2014) points out that
post-war Europe, unlike most developing countries today, was well endowed with skilled
labour, had well established institutional frameworks and operated at the leading edge
of technology (used before and during the war). After the war, the fundamental missing
element for rapid recovery of Europe was capital, which foreign aid successfully provided.
Most importantly however, the post war period saw the institutionalization of key
multi-lateral organizations in the context of foreign financing/assistance. The World Bank and
International Monetary Fund (IMF) formed at the Bretton Woods Conference in 1944 to
secure global economic and financial stability and face the problem of escalating poverty
in the world by providing capital to development programmes that promote sustainable
economic growth. The OECD was formed in 1948 to promote good policy practices in
market economies to achieve sustainable economic growth in the process of economic
development that will improve the economic and social well-being of the people12.
In the decades after WWII, the notion of foreign financing/assistance has evolved as the
focus shifted from the recovering economies in Europe; coming of age during the Cold War
era (1960s-1980s) when aid was used to support client/allied states; to the present day
when the primary focus is achieving sustainable development. Table (1.B.1) in Appendix
(1.B) gives a brief overview of the key developments in the background to foreign aid that
have taken place since the end of WWII13.
While the need for foreign aid as a moral obligation of the rich to the poor has always
existed from earlier times, two important factors that have at various stages influenced
the discourse of foreign aid policy in the modern era are political factors and the process of
development thinking. Development thinking has been more complicated and non-linear
in nature where as key geopolitical influences on international aid have been the Cold
War, the collapse of the Soviet Union, events of the September 11 and most recently the
emergence of China as a global power and a major player in international aid.
During the 1950s and 1960s, foreign aid spending shifted from Western Europe and Japan
to U. S. military allies in the Middle East and Asia and to poor countries in sub-Saharan
Africa and South Asia. Donor ideology and focus during this period was to stop newly
independent nations from “going to the other side (communist side)”and to promote
peace in the Middle East. Notably, with regards to economic growth theory, it was at the
time of Rosenstein-Rodan’s “big push theory” (see Rosenstein-Rodan (1943)), Rostow’s
“stages of economic growth” (see Rostow (1960)) and the “two-gap model” of Chenery
and Strout (1966). They argued, each in their different ways, that the main constraint
to economic development was capital accumulation, and supplementing domestic savings
was the role of aid. Also, it was recognized that there were sufficiently strong market
failures and externalities in most of the emerging countries such that the government and
central planning had to play a key role in managing the investment and aid process in
the recipient country.
In the 1970s, aid flows rose as regional ‘development banks’ and multilateral organization,
particularly the World Bank’s International Development Association (IDA) 14 increased
activities. Support for state-led initiatives continued, however there was a shift from
targeting overall growth through productive sectors to poverty reduction and social welfare
development. Furthermore, the demand for development cooperation gained momentum
in the the 1960s and 1970s fueled by a number of developing nations gaining independence.
It was realised at the time that there was a group of poorer countries with economic
disincentives that lay not only in the profound poverty of their people but also from
weaknesses in their institutional and human resource capacities often compounded by
their geophysical handicaps.
The 1980’s experienced significant events that had impact on foreign aid policy, beginning
with the OPEC oil shock in 1979 to the fall of the Berlin wall (1989) and the collapse
of the Soviet Union (1989-91) while conservative administrations took power in the USA
(Ronald Reagan), UK (Margaret Thatcher), and Germany (Helmut Kohl). Against this
background, there was decisive shift in the aid doctrine, shifting from the statist approach
towards support to market based approach to achieving development. Further, the balance
of payments crisis in the late 1970s and the financial crisis in the early 1980s that resulted
in global economic instability strengthened the criticism against the statist and inward
looking import substitution strategies, resulting in a shift towards macroeconomic reforms
and market liberalisations.
This was the era of “structural adjustment” programmes (SAPs). Country policies which
included promotion of trade, development of financial systems and promotion of
market-oriented reforms, were seen as key to restructuring macroeconomic policies in order to
achieve economic stabilisation and growth. Aid transfers took the form of budget
sup-port and/or debt cancellation conditioned on policy reforms following the tenets of the
‘Washington Consensus15.’ Another important development during this period was the
rise of non-governmental organizations (NGO) as agents in foreign aid delivery and
bi-lateral donors agencies, such as United States Agency for International Development
(USAID) and UK’s Department for International Development (DfID) became further
re-moved from the implementation of foreign assistance projects and began to channel their
resources through NGOs.
The end of the Cold War in the 1990s affected international aid in three ways: (i) countries
from Eastern Europe and former Soviet Union re-emerged as recipients (ii) with the war
over, poverty reappeared as the driving ideology behind aid, partly due to the heavy
criticism of the structural adjustments policies16 and the rapid deterioration of
socio-economic conditions in Eastern Europe and former Soviet Union states as highlighted
in the World Bank’s World Development Report (1990)17 and (iii) serious consideration
to governance and human rights issues in developing countries. These factors saw some
preferred recipients becoming less so while in many countries aid was withdrawn on the
basis of the perceived “low quality” of governance, unlike in the Cold War era when donors
did not give much consideration to internal governance matters in recipient countries. This
resulted in a reduction in aid spending during the 1990s.
The new millennium began with the Millennium Summit of the United Nations (UN)
General Assembly held in New York (USA) in September, 2000 at which world leaders
from all 18918 UN member states and a further 23 international organizations adopted
and made a commitment to achieve the Millennium Development Goals (MDGs), which
included 8 goals and 18 targets. The second major event that affected aid in the new
millennium was 11th September, 2001 terrorist attacks on New York City and the
Pen-tagon. Other than fighting poverty, there was a significant shift in donor perspectives
(especially the US) upon the realisation that developing countries played a critical role in
global security as several countries in Asia and Africa were being used as staging points
15Williamson (2000) provides a more detailed history of the Washington Consensus.
16See UNICEF funded reports such as Grant (1990) “The State of World’s Children” and Cornia et al. (1987) “Adjustments with a Human Face.”
17see Bank (1990)
for terrorist activities, and hence the need for more cooperation with governments in
de-veloping countries to assure global security. For instance, in 2002 President George W.
Bush promised $4.5 billion in aid to Afghanistan.19
The major influence on the evolution of aid in the new millennium has emanated from
the efforts of the United Nations through a series of high level forums on aid; the first
International Conference on Financing for Development (ICFD) was held in Mexico in
2002 where the Monterrey Consensus was agreed and charted an action plan for a global
response to the challenges of financing for development with the goal to eradicate poverty,
achieve sustained economic growth and development, advancing towards an ’inclusive and
equitable’ global economic system. The Paris High Level Forum on Aid Effectiveness
held in France in 2005 followed the Monterrey meeting and here the Paris Declaration
was agreed. The Monterrey consensus and the Paris Declaration set out the road map
for conduct of both donors and aid recipients in the administration of development aid in
order to maximise its effectiveness and impact.
The two conferences highlighted the role of both private investment and official
develop-ment assistance and acknowledged that the poorest countries cannot really be expected to
attract large inflows of private capital because they lack the basic conditions
(infrastruc-ture and human capital). They addressed a number of areas of financing for development:
a) mobilizing international resources for development including foreign direct
invest-ment and other private flows.
b) improving international trade as an engine for development.
c) increasing international financial and technical cooperation for development.
d) addressing systemic issues: enhancing the coherence and consistency of the
interna-tional monetary, financial and trading systems in support of development.
e) advocating for recipient countries to lead the development efforts in their countries
through their own development strategies and policies and that donor activities
should be harmonised and aligned to support the priorities outlined the country
development strategies.
Since the Paris Declaration, further agreements and declarations on financing for
devel-opment have agreed to build on the agreements of the two first meetings. The Accra
Agenda for Action agreed in Ghana in 2008 to strengthen and deepen implementation of
the Paris Declaration on Aid Effectiveness drawing from strong evidence of what is and
is not working 20. The Doha Declaration was made at a meeting in Qatar in 2008 to
reaffirm the Monterrey Consensus and its holistic approach, recognising that mobilizing
financial resources for development and the effective use of all those resources are
cen-tral to the global partnership for sustainable development. The most recent high level
forum for financing for development was held in 2015 in Addis Ababa, Ethiopia where
the Addis Ababa Agenda for Action was agreed and most crucially set the platform for
the Sustainable Development Goals (SDGs) which were agreed upon by Heads of State
and Government at the UN headquarters in New York, USA in 2015.
In most recent times, two more important factors have emerged that play a significant role
on the state of aid beginning with the financial crisis of 2008, which has had severe impact
on developing countries. The World Bank projected that among other effects, developing
economies would face between $270-$700 billion financing gap as a result of the crisis,
about 20% fall in foreign direct investment and also deteriorating export revenues as a
result of falling commodity prices and further falls in private financial flows, remittances
and access to credit.21 The cumulative impact of the crisis implied that official
develop-ment assistance assumed an even greater importance to developing economies not only to
curb the impacts of the crisis but also to ensure continued progress towards achieving the
MDGs. However, the impact of the crisis on the developed economies implied that many
donor governments would face serious challenges in meeting their commitments, many
cutting their aid budgets.
The second factor is emergence of new donors particularly China’s22rapid rise into an
eco-nomic and political power, much to the benefit of Sub-Saharan Africa region; China now
represents more than 20 per cent of SSA’s trade, up from just 2.3 per cent in 1985. Most
importantly however, China has increased its aid to developing countries as a strategy
for idealism and strengthening diplomatic and political ties with the developing world. In
2011, the Information Office of the Chinese State Council, for the very first time, issued
20Gathered primarily from a 2008 monitoring survey and an evaluation exercise on the implementation of the Paris Declaration
21see World Bank’sWorld Development Report (2009)
the White Paper on ’China’s Foreign Aid,’ reporting that China’s financial resources for
foreign aid have increased rapidly, averaging 29.4 per cent annual growth from 2004 to
2009. By the end of 2009, China had provided a total of 256.29 billion Yuan
(approx-imately $41.5 billion) in aid to foreign countries (Africa’s share accounted for 45.7% of
this total). This rapid increase in Chinese influence particularly in Africa has become
an international focus and drawn concerns from traditional donors from the West who
criticise Chinese aid because for failing to promote democracy, equitable and sustainable
development, and environmental preservation in these countries and loss of ability to
in-fluence behaviour of aid recipients regarding human rights and economic reforms because
of China’s policy of providing foreign assistance without conditions.
1.3.3
Trends in net ODA flows
In this section, we take a look at the trends in flow of aid to developing countries. As
stated earlier, in this thesis we use ODA as defined by the OECDs Development Assistance
Committee (DAC). The data used comes from the World Bank’s (World Development
Indicators (2016)) and the OECD’s online database.
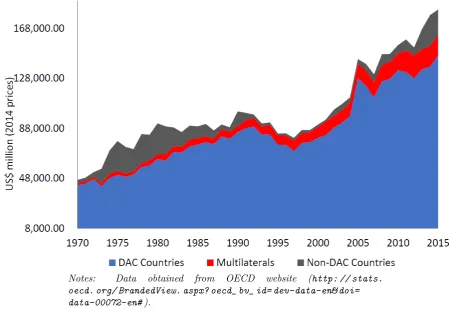
Figure 1.3.1 below presents the trend in official development assistance to developing
countries (at constant 2014 US$prices and exchange rates), indicating a rise from a
mod-est US$46.7 billion in 1975 to US$183.0 billion in 2015. While the figure indicates a clear
upward trend in net flows to developing countries, there have been periods when aid flows
have stagnated or indeed experienced a downward trend. For instance, having risen from
US$46.7 billion in 1970 to US$92.0 billion in 1980, the trend flattened and averaged about
US$89.0 billion between 1981 and 1989. Generally, a similar trend can be observed in
other forms of capital flows to developing countries during this period, to a large extent
as a result of the global recession that affected donor countries towards the late 1980s
(Temple (2010)).
The decline trend was more noticeable in the 1990s, as shown by the trend in net ODA
per capita in figure 1.A.1 in the appendix; net ODA per capita declined from US$32.64
in 1990 to about US$18.82 by 2000.23 Aggregate flows declined from US$101.5 billion in
Figure 1.3.1: Trends in Official Development Assistance (current prices)
Notes: Data obtained from OECD website (http: // stats. oecd. org/ BrandedView. aspx? oecd_ bv_ id= dev-data-en& doi= data-00072-en#).
1991 to US$80.2 billion in 1997. The main reason for the downward turn in aid flows
to developing countries during this period was the end of the Cold War, which changed
the geopolitical state of the world and most developed countries decreased their foreign
aid from their budgets. Another reason was the eruption of the Gulf War that resulted
in rising fuel prices. For some donors, such as Italy, Sweden and Finland who had been
running huge fiscal deficits, they faced increasing domestic pressure on their budgets.
In some cases, declines in official development assistance would be compensated by
in-crease in private flows; however there are times when both ODA and private flows would
expand/contract at the same time. For instance, both official aid flows and private flows
(mainly bank credit) expanded rapidly in the 1970s (private flows rose from US$48.1
bil-lion in 1970 to US$99.5 billion in 1980).24 In the 1980s official aid virtually stagnated
while private flows declined significantly (see figure (1.A.2)). As mentioned earlier, from
1991 to 1997 there was a sharp decline in official aid inflows, however, it was
compen-sated with a strong expansion in private capital inflows to developing countries, including
both equity and non-equity flows; total private flows rose from US$54.7 billion in 1992 to
US$136.1 billion in 2000.
Since 2000, official development assistance increased rapidly particularly within the
frame-work of the Millennium Development Goals (MDGs) which were agreed upon in the
Mil-lennium Declaration agreed by members of the United Nations in 2000. The MDGs set a
range of objectives to be met by 201525, which required large amount of financial support
to developing countries.
Other than the rapid increase in aid flows, the period after 2000 also experianced some
shifts in aid delivery including preference for direct budget support (payment through
government budgets) pooling of resources from multiple donors for sector-wide support
(SWAps) in areas such as health and education and expansion of program aid relative to
traditional project-based aid. Many of these were in line with recommendations agreed
under the Paris Declaration in 2000.
On the supply side, Japan had been the largest donor of aid to developing countries, in
volume terms, from the early 1990s till 2001 when the United States became the largest
donor. Japan’s aid had dropped by nearly US$4 billion, partly due to sharp depreciation
of Japanese yen.
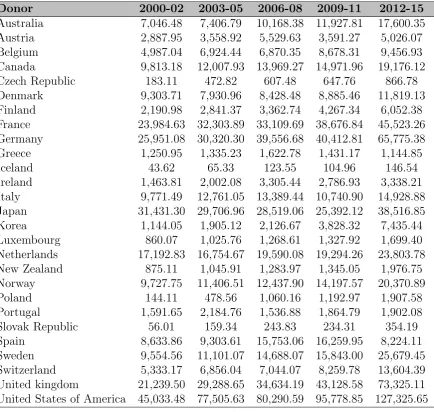
The United States remains the world’s largest aid donor in terms of volume (provided
US$30.1 billion in 2012 and have disbursed about US$273 billion in the last decade);
Germany, the United Kingdom and France have in the last 5 years substantially increased
their aid disbursements (see table 1.3.1) and have leapfrogged Japan who before then used
to be the second major donor. Germany disbursed US$13.8 billion, followed by the UK
(US$13.7 billion), France (US$12.8 billion) while Japan disbursed about US$10.7. As a
trend, net flows from the United States peaked in 2005 when they disbursed US$31.7
billion and have been declining since relative to the total aid flows from DAC members;
on the other hand, combined aid flows from EU member countries have been steadily
increasing.
25Compared to 1990, the MDGs aim to halve the proportion of people whose income is less than
Table 1.3.1: Net ODA by DAC donors (US$ million)
Donor 2000-02 2003-05 2006-08 2009-11 2012-15
Australia 7,046.48 7,406.79 10,168.38 11,927.81 17,600.35
Austria 2,887.95 3,558.92 5,529.63 3,591.27 5,026.07
Belgium 4,987.04 6,924.44 6,870.35 8,678.31 9,456.93
Canada 9,813.18 12,007.93 13,969.27 14,971.96 19,176.12
Czech Republic 183.11 472.82 607.48 647.76 866.78
Denmark 9,303.71 7,930.96 8,428.48 8,885.46 11,819.13
Finland 2,190.98 2,841.37 3,362.74 4,267.34 6,052.38
France 23,984.63 32,303.89 33,109.69 38,676.84 45,523.26
Germany 25,951.08 30,320.30 39,556.68 40,412.81 65,775.38
Greece 1,250.95 1,335.23 1,622.78 1,431.17 1,144.85
Iceland 43.62 65.33 123.55 104.96 146.54
Ireland 1,463.81 2,002.08 3,305.44 2,786.93 3,338.21
Italy 9,771.49 12,761.05 13,389.44 10,740.90 14,928.88
Japan 31,431.30 29,706.96 28,519.06 25,392.12 38,516.85
Korea 1,144.05 1,905.12 2,126.67 3,828.32 7,435.44
Luxembourg 860.07 1,025.76 1,268.61 1,327.92 1,699.40
Netherlands 17,192.83 16,754.67 19,590.08 19,294.26 23,803.78
New Zealand 875.11 1,045.91 1,283.97 1,345.05 1,976.75
Norway 9,727.75 11,406.51 12,437.90 14,197.57 20,370.89
Poland 144.11 478.56 1,060.16 1,192.97 1,907.58
Portugal 1,591.65 2,184.76 1,536.88 1,864.79 1,902.08
Slovak Republic 56.01 159.34 243.83 234.31 354.19
Spain 8,633.86 9,303.61 15,753.06 16,259.95 8,224.11
Sweden 9,554.56 11,101.07 14,688.07 15,843.00 25,679.45
Switzerland 5,333.17 6,856.04 7,044.07 8,259.78 13,604.39
United kingdom 21,239.50 29,288.65 34,634.19 43,128.58 73,325.11
United States of America 45,033.48 77,505.63 80,290.59 95,778.85 127,325.65
Source: OECD (2016), Net ODA (indicator). (https://data.oecd.org/oda/net-oda.htm)
Although aggregate trends in net ODA flows to developing countries present an upward
trend, these flows are smaller than they used to be, relative to gross national incomes of
the donor countries. Since the 1970s net ODA flows have shrunk by more than a quarter
relative to the GNI of donor nations.
Geographically, Sub-Saharan Africa (SSA) continues to be a high priority region since the
1970s, with over a third of total ODA being disbursed to countries within this region, as
shown in table (1.3.2). This rapid increase in aid to SSA from the 1970s followed donors’
reorientation of the objectives of aid towards poverty reduction.
Bilateral donors, such as the UK white paper ‘More Aid for the Poorest’ in 1975, explicitly
Table 1.3.2: Total ODA received per region (US$millions)
1970-79 1980-89 1990-99 2000-09 2010-14
Europe 223.998 497.945 1382.261 2541.037 2610.144
Africa 2632.961 8504.859 13557.6 20905.21 30254.84
North of Sahara 722.935 1996.935 2993.47 1822.865 1927.15
South of Sahara 1856.307 6330.03 10077.35 18394.96 26961.53
America 797.278 2515.072 4494.898 5060.591 6878.65
North & Central America 312.11 1506.558 2145.3 2224.906 3390.312
South America 433.394 891.001 1855.719 2370.667 2906.598
Asia 3861.329 7472.279 11948.41 20156.23 24712.73
Far East Asia 1555.175 2855.44 5974.884 5152.833 4293.238
South & Central Asia 1629.81 2820.435 3462.596 6770.102 13745.24
Middle East 646.742 1728.732 2345.82 7793.853 5832.694
Oceania 516.053 1038.942 1460.453 954.646 1759.576
All developing countries 8713.44 22891.8 39011.6 62280.89 92409.65
Source: OECD (2016), Net ODA (indicator). (https://data.oecd.org/oda/net-oda.htm)
segment of the world’s poorest nations.
Another important region for donors is the East Asia and Pacific region, albeit the fact
that the share of total aid to the region has been declining in the last two decades,
in part due to the success and growth of a number of countries in the region such as
Singapore, Korea, Malaysia and the Peoples Republic of China who have since emerged
from being recipients to establishing themselves as donors; per capita ODA to East Asia
and Pacific region peaked in early 1990s and has been declining since. In the 1990s,
countries from Eastern Europe and former Soviet Union states emerged as another high
priority destination for aid, rising sharply from US$5.5 ODA per capita in 1990 to about
US$17.4 by 2000, and the region still receives more ODA (in per capita terms) than all
other regions other than Sub-Saharan Africa.
1.3.4
Structure of the thesis
As mentioned earlier, the main objective of this thesis is to contribute to the literature
on foreign aid and economic growth. To achieve this objective we begin by presenting
developments in growth theory that affected our understanding of how aid can promote
growth. We also review how empirical approaches to measuring the effects of aid changed
along with the theoretical developments. Chapter 3 critically investigates the most
com-monly used approach in aid effectiveness studies, namely the cross-country approach to
growth empirics. The chapter brings some new insights on how some of the shortfalls of
this approach affect the results from aid-growth studies.
After discussing the cross-country aid-growth evidence, we proceed in chapter 4 to use
a single country approach to conduct an empirical investigation into the effects of aid.
There is limited evidence of the effects of aid at the sub-national level, and so this chapter
attempts to expand that strand of aid effectiveness literature. A version of this Chapter
is co-authored with Dr Alex Trew and presented in Khomba and Trew (2016); it is based
on the analysis conducted for this chapter including the empirical strategy and the data
used. In chapter 5, we develop a theoretical analysis of the effects of aid in a model that
accounts for subsistence consumption and public capital. The main concern about this
chapter is how subsistence constraints and productivity enhancing public capital affect
Appendix
1.A
Figures
Figure 1.A.1: Trend for net ODA per capita, (constant 2014 US$)
1975 1980 1985 1990 1995 2000 2005 2010 2015 20
40 60 80
HIPC
ADC LIC
MIC
Y ears
N et ODA p.c.
Notes: The graph shows trends in aid per capita to different income clas-sifications of countries. HIPC is for Highly Indebted Poor Countries, LIC for Low Income Countries, MIC for Middle Income Countries and ADC is for All Developing Countries
Figure 1.A.2: Trends in net private flows (constant 2014 US$ prices)
Chapter 2
Literature Review
Theoretical and empirical literature that attempts to examine the potential causal
re-lationship between foreign aid and economic growth has followed the progress in the
development of economic growth accounting in general. Classical (Ricardian) theories of
growth emphasized the role of physical capital accumulation. Modern theories place key
role in such factors as information, institutions, etc. in explaining the differences in
eco-nomic performance of different countries. This chapter provides a review of the existing
aid effectiveness literature, beginning with a review of the theoretical literature in section
2.1 and then the empirical evidence in section 2.2.
2.1
Review of the theoretical literature on aid-growth
nexus
2.1.1
Financing gap models (aid-savings-investment-growth)
For years, the theoretical framework for assessing the potential impact of aid on economic
growth was based on the so called ‘financing gap’ models. These theories asserted that the
growth process depends on the ability to surpass the constraints regarding the
accumula-tion of physical capital. Investment was perceived as the key to economic growth. Since
one of the main characteristics of developing countries is their limited capacity to generate
savings due to very low per capita incomes, foreign financing capital flows (in the form
of aid) fills the savings gap leading to higher investment and output growth.
Rosenstein-Rodan (1961) were the first to use this approach when they calculated the amount of aid
required by developing countries for them to achieve certain levels of growth.1