ISSN Online: 1947-394X ISSN Print: 1947-3931
DOI: 10.4236/eng.2019.118034 Aug. 23, 2019 475 Engineering
Effects of Outdoor Thermal Environment upon
the Human Responses
Yoshihito Kurazumi
1, Emi Kondo
2, Kenta Fukagawa
3, Yoshiaki Yamato
4, Kunihito Tobita
5,
Tadahiro Tsuchikawa
61School of Life Studies, Sugiyama Jogakuen University, Nagoya, Japan
2Department of Architecture, Ariake National College of Technology, Omuta, Japan
3Department of Architecture, Kyushu Sangyo University, Fukuoka, Japan
4Department of Architecture and Structural Engineering, Kure National College of Technology, Kure, Japan
5School of Humanities and Social Sciences, Osaka Prefecture University, Sakai, Japan 6School of Human Science & Environment, University of Hyogo, Himeji, Japan
Abstract
In a summer outdoor space, the influence of short-wave length solar radia-tion on the human body is strongly apparent, heat is retained in the body, and the risk of heat disorders such as heat stroke increases. To avoid this, it is essential to seek shade to avoid the influence of short-wave length solar radia-tion. In addition, natural ground surfaces such as green spaces and water sur-faces are useful in reducing the air temperature. It is indispensable to consid-er climate mitigation effect of outdoor space. The purpose of this study is to clarify the influence of the thermal environment of an outdoor space on the human body in rural and suburban regions where paddy fields remain. Sub-ject experiments were conducted to examine the relationship between the thermal environment evaluation index enhanced conduction-corrected mod-ified effective temperature (ETFe) in an outdoor space and the physiological and psychological responses of the human body. Experiment sites were se-lected with consideration for the natural ground surface such as bare ground where the surface is gravel or soil; paved ground such as concrete, asphalt or blocks; green areas covered in plants; and water surfaces, as well as the sky factor due to buildings or trees etc. and the proportion of the solid angle of components of greenery and water etc. comprising the solid angle of the total celestial sphere. A ground surface feature with a high heat capacity may pro-mote sensation of hot and deteriorate the thermal sensation. A landscape of thick vegetation with a high green factor may have a strong feeling of con-finement, which can make it somewhat hot and somewhat uncomfortable thermal environment due to the sense of stagnation. Compared with the ur-How to cite this paper: Kurazumi, Y.,
Kondo, E., Fukagawa, K., Yamato, Y., To-bita, K. and Tsuchikawa, T. (2019) Effects of Outdoor Thermal Environment upon the Human Responses. Engineering, 11, 475-503.
https://doi.org/10.4236/eng.2019.118034
Received: July 11, 2019 Accepted: August 20, 2019 Published: August 23, 2019
Copyright © 2019 by author(s) and Scientific Research Publishing Inc. This work is licensed under the Creative Commons Attribution International License (CC BY 4.0).
http://creativecommons.org/licenses/by/4.0/
DOI: 10.4236/eng.2019.118034 476 Engineering ban environment, it is conceivable that the difference in the perceptual envi-ronment, whereby it is subconsciously assumed to be a comfortable thermal environment, had an effect in the rural and suburban regional environment, resulting in an ETFe lower than the upper limit of comfort in a summer ur-ban environment.
Keywords
ETFe, Mean Skin Temperature, Outdoor Environment, Rural Area, Thermal Comfort, Thermal Sensation, Urban Area
1. Introduction
In an outdoor space, in addition to physical and biological environmental fac-tors, psychological environmental stimuli are important in determining thermal comfort [1]-[8]. Adaption to the thermal environment according to cultural background, experience of being in hot/cold thermal environments and the like, sense of expectation of the thermal environment, behavioral thermal regulation and the effect of the thermal environment history such as the time spent exposed to it are apparent in reported comfort. In these studies, the association between the outdoor thermal environment evaluation index and the thermal sensation of the human body is not made clear, and remains within the category of qualita-tive discussion.
Kurazumi et al.[9][10][11] quantitatively evaluate the influence on the human body in the outdoor thermal environment using enhanced conduction-corrected modified effective temperature (ETFe) [12] as an evaluation axis. In this series of studies, the sense of expectation with regards to comfort in outdoor spaces is low and the subjects are not judged to be comfortable thermal environments, so it is considered that even thermal environmental conditions with a high ETFe and ther-mal environmental conditions with high mean skin temperature can be tolerated as well as thermal environment conditions with a low ETFe and thermal environmental conditions with low mean skin temperature. The outdoor thermal environment be-ing in a harsh condition is shown quantitatively by the outdoor thermal envi-ronment evaluation index ETFe.
Givoni et al.[13], Oliveira and Andrade [14], Eliasson et al.[15], Nikolopou-lou and Steemers [5], Nikolopoulou and Lykoudis [7] and Ishii et al.[16] show the relationship between the physical environmental factors of the outdoor space and the thermal sensation of the human body, and clarify that the outdoor envi-ronmental factors that influence the thermal sensation of the human body are air temperature, wind speed and short-wave length solar radiation. However, these studies do not measure the physiological parameters of the human body neces-sary to calculate the heat balance of the human body. Kurazumi et al.[9][17]
DOI: 10.4236/eng.2019.118034 477 Engineering thermal environment factors on the thermal sensation of the human body. Ku-razumi et al.[9] clarify that the variable factors by which summer outdoor envi-ronmental factors influence the thermal sensation of the human body are heat conduction, humidity and short-wave length solar radiation. In addition, it clari-fies that the variable factors that affect the thermal comfort of the human body are air current, heat conduction and humidity. Also, Kurazumi et al.[17] clarify that the variable factors by which winter outdoor environmental factors influ-ence the thermal sensation of the human body are air temperature, long-wave length thermal radiation and short-wave length solar radiation. In addition, it clarifies that the variable factors that influence the thermal comfort of the hu-man body are air temperature, humidity, long-wave length thermal radiation, short-wave length solar radiation and heat conduction. These studies quantita-tively show the influence of outdoor thermal environmental factors on the ther-mal sensation of the human body.
Kurazumi et al.[18][19][20] demonstrate the influence of an outdoor ther-mal environment on the human body for the influence of a tropical climate with strong short-wave length solar radiation on the thermal sensation of the human body as the evaluation axis. It clarifies that in tropical areas where the effects of nighttime cooling cannot be expected, the effect of long-wave length thermal radiation is strong in the shade of objects made of materials with high heat ca-pacity, and the effect of improving the thermal sensation of the human body through shade is low. These studies quantitatively show that when the outdoor thermal environment is harsh, it is essential to reduce the influence of long-wave length thermal radiation.
The influence of large-scale green space, rivers, etc. on the summer outdoor thermal environment is measured [21]-[26]. These studies quantitatively show the influence of outdoor thermal environmental factors on the thermal sensation of the human body. Meanwhile, the influence of park lakes, agricultural ponds, etc., on the summer outdoor thermal environment is measured [27] [28] [29]. The environment is influenced by the depth of water, the temperature of the surface of the water and the direction of the wind, but the trend is observed whereby the air temperature tends to be lower directly above the water surface and in the vicinity of the pond compared to the surrounding area. However, they consider air temperature reduction effect to be within a limited range. If the temperature of the water surface is higher than the air temperature, the air tem-perature on the downwind side of a pond across which wind blows tends to in-crease.
DOI: 10.4236/eng.2019.118034 478 Engineering green spaces and water surfaces are useful in reducing the air temperature. How-ever, concerning the effects of water surfaces, water depth, water flow and water temperature influence the temperature reduction effect.
Japan has a cereal-crop culinary culture and rice cultivation is actively carried out. There are many paddy fields in the suburbs, countryside, and mountainous areas. Even in urban areas, some paddy fields still remain. Although there are differences depending on the area, from May to September, paddy fields can be expected to be effective as green spaces and water surfaces. According to Nishida et al.[30] etc., the irrigation water temperature of the paddy field is influenced by the water temperature of the irrigation channel. In addition, the water tem-perature of the irrigation channel rises as it flows from upstream to downstream. Therefore, the irrigation water temperature is strongly affected by the water temperature of the water near the inlet. Meanwhile, the influence of the depth of irrigation is considered to be stronger near the paddy field drain. Regarding the relationship between the growth of rice and the water temperature of the paddy field, the influence of short-wave length solar radiation is stronger at the early stage of rice formation because the leaf area of the rice is small with respect to the change of the irrigation water temperature. At the stage of ripening of the head of the rice, regarding the change in the irrigation water temperature, the shielding rate of short-wave length solar radiation increases due to the increase in the leaf area due to the growth of the rice, and in addition to short-wave length solar radiation the influence of the air temperature increases. From the heading stage of rice onwards, the short-wave length solar radiation shielding rate further increases due to the inclination of the leaves of the rice, and changes in the irrigation water temperature are considered to be strongly influenced by air temperature.
Therefore, this study focused on the rural and suburban regions where paddy fields still remain, and aimed to clarify the relationship between outdoor thermal environment evaluation index ETFe [12] and the response of the human body with respect to thermal sensory perception. We decided to collect phenomena and information to quantitatively examine the outdoor thermal environment and ef-fects on the human body.
2. Experimental Plan
2.1. ETFe
DOI: 10.4236/eng.2019.118034 479 Engineering short-wave length radiation, surface temperature of the material in contact with the human body and humidity into individual meteorological elements.
The influence of these five environmental factors on the heat balance of the human body is considered to be expressible in newly defined thermal environ-ment evaluation indices as follows: convective heat transfer area combined with the thermal velocity field TVFhta for wind speed; radiant heat transfer area combined with the effective radiation field concerning the long-wave length thermal radiation in outdoor space ERFhtaL [12] for long-wave length thermal radiation; radiant heat transfer area combined with the effective radiation field concerning the short-wave length solar radiation in outdoor space ERFhtaS[12] for short-wave length solar radiation; heat transfer area combined with the effec-tive conduction field ECFhta[12] for surface temperature of the material in con-tact with the human body; and effective humidity field at enhanced conduc-tion-corrected modified effective temperature EHFETFe [12] for humidity. The addition of each temperature-converted factor is also considered to be possible and quantifying the composite effect on sensation in the outdoor space as well as the discrete effect of each meteorological element to possible on the same evalu-ation axis.
a hta fL htaL fL hta fL
ETFe fL htaS fL
ETFe T TVF h ERF h ECF h
EHF h ERF h
= + + +
+ + (1)
(
)(
)
hta o conv c conv s a
TVF = h fclFclof −h fclFclf T T− (2)
(
)
htaL rL rad rL a
ERF =h fclFclf T −T (3)
(
)
hta d cond f a
ECF =h Fcldf T T− (4)
(
)
ETFe c a ETFe
EHF =Lwh fclFpcl p 0.5p− ∗ (5)
htaS S
ERF =R (6)
fL o conv rL rad d cond
h =h fclFclof +h fclFclf +h Fcldf (7)
where:
ETFe: enhanced conduction-corrected modified effective temperature [K]; Ta: air temperature [K];
TVFhta: convective heat transfer area combined with the thermal velocity field [W/m2];
ERFhtaL: radiant heat transfer area combined with the effective radiation field concerning the long-wave length thermal radiation in outdoor space [W/m2];
ERFhtaS: radiant heat transfer area combined with the effective radiation field concerning the short-wave length solar radiation in outdoor space [W/m2];
ECFhta: heat transfer area combined with the effective conduction field [W/m2];
EHFETFe: effective humidity field at enhanced conduction-corrected modified effective temperature [W/m2];
DOI: 10.4236/eng.2019.118034 480 Engineering fcl: effective surface area of clothing [−];
fconv: convective heat transfer area factor [−]; fcond: conductive heat transfer area factor [−]; frad: radiant heat transfer area factor [−];
Fcl: thermal efficiency factor of clothing in the exposed airflow area [−]; Fcld: thermal efficiency factor of clothing in the heat conduction area [−]; Fclo: thermal efficiency factor of clothing under the standard condition [−]; Fpcl: permeation efficiency factor of clothing [−];
hc: convective heat transfer coefficient [W/m2K]; hd: resultant heat conductance [W/m2K];
hfL: sensible heat transfer coefficient in outdoor space [W/m2K];
ho: convective heat transfer coefficient under the standard condition [W/m2K];
L: Lewis relation coefficient [K/kPa];
pa: water vapor pressure at the outdoor air temperature [kPa]; ETFe
p∗ : saturated water vapor pressure at enhanced conduction-corrected
mod-ified effective temperature [kPa];
RS: short-wave length solar radiation heat gain of human body [W/m2]; Ts: convection-corrected mean skin temperature [K];
Tf: surface temperature of the contacted material [K];
TrL: mean radiant temperature concerning long-wave length thermal radiation in outdoor space [K];
w: skin wettedness [−].
2.2. Experimental Procedure
In order to maintain consistency in the experimental data collection and mea-surement method of the outdoor environment taking the thermal environment evaluation index for an outdoor space ETFe [12] as an evaluation axis, the expe-rimental method and test items of this study are the same as described in Kura-zumi et al.[9][10][11][17][18][19][20].
Experiments were conducted in late July 2016 and from late August 2015 to the beginning of September, corresponding to the ripening period of rice in paddy fields. The observation points were drawn at random and the route to the points was undecided. With consideration for the burden on subjects, the experiment was concluded at a point two hours after commencement of the mobile observa-tions on foot. Morning measurements were carried out in a period from around 10:00 to 13:00 and afternoon measurements were carried out in a period from around 13:00 to 16:00.
DOI: 10.4236/eng.2019.118034 481 Engineering investigation. However, the thermal environment of summer outdoor spaces can be harsh to the extent that there are cases of death by heat stroke. Accordingly, one must avoid extended periods in outdoor spaces where one would be struck by direct high temperature solar radiation or strong low temperature winds. It is unavoidable that experiments on subjects in outdoor spaces treat a necessary transition period of a short time. Unlike an indoor space, it is difficult to con-sider spending extended periods in an outdoor thermal environment that can be considered uncomfortable, due to behavioral thermoregulation by means of en-vironmental refuge behavior. With that, in consideration of the subjects’ main-tenance of a posture in a standing position and the response time of the Assman ventilated psychrometer, the actual measurement of the human body response and thermal environment in the mobile observations were performed ten mi-nutes after having established the observation device. Naturally, it can be con-jectured that the human body response will differ the longer the exposure time of the subjects, and the experimental period was determined with consideration for the safety of the subjects.
Subjects moved on foot to the observation point after having been seated and at rest for 60 minutes or longer in an air-conditioned indoor space inside a building. The experiment staff instructed the subjects that the psychological re-porting was thermally specific thermal sensation and thermal comfort, and that they should report the average sensation during the exposure time. The move-ment speed of the subjects was made about 0.7 m/s.
After arriving at each measurement point, the subjects waited in a standing posture, during which time the experiment staff set up the measurement instru-ments for the thermal environment and preparations for measurement were con-cluded. Thereafter, the subjects were exposed to the thermal environment in a standing posture for ten minutes, as detailed above. The subjects were positioned around the thermal environment measurement instruments with the thermal en-vironment measurement instruments in the center. As the subject of the research was the environment surrounding the observation stations, the point of gaze of the subjects was free and unfixed. After exposure, the subjects reported the av-erage thermal sensation and the avav-erage thermal comfort for the whole body that they experienced for the time exposed at the observation point.
2.3. Outline of the Observation Points
DOI: 10.4236/eng.2019.118034 482 Engineering
Figure 1. 360-degree panoramic photographs of observation site.
Table 1. Summary of observation points.
Point Survey site Ground surface Skywards surface Surrounds North side Surrounds East side Surrounds South side Surrounds West side factor Sky Green factor
1 Building canyon Asphalt & Weed Open Building Building Building & Tree Open 0.295 0.116
2 Playground bare area Grass Open Open Open Open Open 0.920 0.046
3 Playground green area Bare ground Open Open Open Open Open 0.951 0.481
4 Roadside Asphalt Open Open Open Open Open 0.873 0.046
5 Wisteria trellis Bare ground Wisteria Ivy Ivy Ivy Ivy 0.104 0.135
6 Paddy side Paddy field Asphalt & Open Open Open Open Open 0.938 0.132
7 Farmland side Weed Bamboo Bamboo Open Open Open 0.506 0.338
8 On the bridge Concrete & River Open Open Open Open Open 0.913 0.035
9 River side Weed & River Gravel & Tree Open Open Tree Open 0.352 0.411
10 Square Grass & Weed Open Open Open Building Open 0.870 0.532
11 Residencial area alley Asphalt Open Building Open Open Building 0.690 0.019
12 Revetment canyon Stone revetment Open Steep slope Open Stone revetment Open 0.620 0.157
13 Roadside Asphalt Open Open Open Concrete revetment Open 0.718 0.000
14 Bus stop Asphalt & Weed Tree Open Open Tree Open 0.359 0.306
15 Building canyon Asphalt & Weed Open Building Building Building & Tree Open 0.287 0.051
16 Playground green area Grass Open Open Open Open Open 0.852 0.534
17 Roadside Asphalt Open Open Open Open Open 0.864 0.091
18 Paddy side Paddy field Asphalt & Open Open Open Open Open 0.881 0.100
19 River side Weed & River Gravel & Tree Open Open Tree Open 0.109 0.556
[image:8.595.60.538.378.711.2]DOI: 10.4236/eng.2019.118034 483 Engineering
2.4. Subjects
The subjects were 38 healthy young males and females. The age of the 21 young males was 22.0 ± 2.1, their height was 157.5 ± 3.4 cm, and their weight was 50.4 ± 5.6 kg. The age of the 17 young females was 22.0 ± 2.1, their height was 157.5 ± 3.4 cm, and their weight was 50.4 ± 5.6 kg. With a BMI of 20.3 ± 2.0, they can be considered to be unremarkable test subjects.
In accordance with the Helsinki Declaration [31], the details of the experi-ment were fully explained to the subjects in advance and their consent to partic-ipate in the experiment was obtained.
To calculate the surface area of the human body, the body surface area calcu-lation formula of Kurazumi et al.[32], the effectiveness of which as a calculation formula is verified [33], was used.
It is rare to perform a test subject experiment that measures physiological and psychological quantities as a response of the human body using a great number of test subjects. It is also difficult to perform an experiment that hypothesizes a statistical population. Therefore, this study is considered significant as being new data.
2.5. Experimental Parameters
Air temperature and humidity, wind speed, short-wave length solar radiation, long-wave length thermal radiation, and ground surface temperature of the cen-tral part of the experimental equipment were measured as thermal environment conditions. The air temperature and humidity were measured at a height of 90 cm above the ground by means of an Assmann ventilated psychrometer. The av-erage wind speed was measured for 10 minutes at a height of 90 cm above the ground by a non-directional anemometer (Kanomax Japan, Inc.: 6533, measurement range 0.05 - 5.00 m/s). Concerning the short-wave length radiation in the regions from the visible to the near-and-mid-infrared and the terrestrial radiation in the far infrared region, radiation in downwards and upwards directions were measured at a height of 90 cm above the ground by long and short-wave length radiometer (EKO Instruments: MR-50, sensitivity 7 μV/Wm−2, short-wave length range 305 - 2800 nm, long-wave length range 5000 - 50,000 nm). The ground surface temper-ature was measured by a radiation thermometer (KONICA MINOLTA: HT-10D, measurement wavelength 8 - 14 μm, measurement angle 1.4˚ - 2.0˚, emissivity measurement range 0.10 - 1.00).
di-DOI: 10.4236/eng.2019.118034 484 Engineering rectional component of the short-wave length solar radiation and the long-wave length thermal radiation.
Skin temperature was measured as a physiological condition for the human body by a thermistor thermometer (NIKKISO-THERM N542R data logger, measure-ment range −50˚C - 230˚C, resolution 0.01˚C and a NIKKISO-THERM ITP8391 body surface probe). Medical surgical tape (NICHIBAN, NICHIBAN SURGICAL TAPE-21N) with excellent moisture permeability was used to attach the skin temperature sensor to the human body. The temperature of skin exposed to the airflow was measured at the seven positions of the head, trunk, arm, hand, thigh, lower leg and foot. The sole of the foot was measured for the temperature of the contact part skin. The subjects freely selected their clothing to be suitable to the weather on the measurement day. The clothing quantity of the subjects was found by the clo value given by layering the clothing reported by the subjects
[34][35].
As a psychological condition for the human body, the psychological response was measured after staying at the observation point for ten minutes by means of rating the whole-body thermal sensation (cold-hot) and the whole-body thermal comfort (uncomfortable-comfortable) on a linear scale [36][37]. Linear rating scales are given for the hot (100) and cold (0), and comfortable (100) and un-comfortable (0) directions only. The arbitrary values of 0 and 100 are given for each endpoint, the reported values are read in, and the entire length is converted into a numerical value with the arbitrary scale of 100 for the linear rating scale.
Air temperature, humidity, wind speed, short-wave length solar radiation, long-wave length thermal radiation, and temperature of the ground surface in con-tact with the human body etc., which are direct environmental stimulus, have a large physiological or psychological influence on thermal sensory perception as explanatory variables for thermal sensory perception. Considering that the psy-chological reaction of the human body in an outdoor environment is likely to cause many disturbances and variations, the significance probability in this study is set at 10%, as a criterion for comparison of explanatory variables for deriving results of regression analysis with higher usefulness from a practical perspective. JMP 14.3.0 (SAS Institute Japan) was used for statistical analysis.
3. Results
DOI: 10.4236/eng.2019.118034 485 Engineering
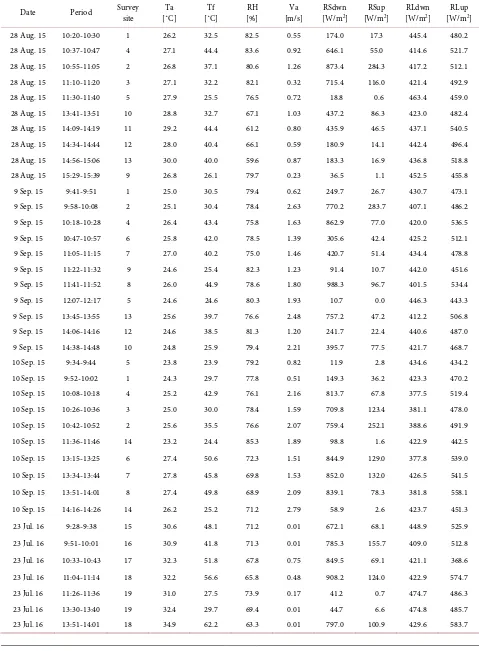
Table 2. Results of field survey.
Date Period Survey site [˚C] Ta [˚C] Tf [%] RH [m/s] Va [W/mRSdwn 2] [W/mRSup 2] [W/mRLdwn 2] [W/mRLup 2]
28 Aug. 15 10:20-10:30 1 26.2 32.5 82.5 0.55 174.0 17.3 445.4 480.2
28 Aug. 15 10:37-10:47 4 27.1 44.4 83.6 0.92 646.1 55.0 414.6 521.7
28 Aug. 15 10:55-11:05 2 26.8 37.1 80.6 1.26 873.4 284.3 417.2 512.1
28 Aug. 15 11:10-11:20 3 27.1 32.2 82.1 0.32 715.4 116.0 421.4 492.9
28 Aug. 15 11:30-11:40 5 27.9 25.5 76.5 0.72 18.8 0.6 463.4 459.0
28 Aug. 15 13:41-13:51 10 28.8 32.7 67.1 1.03 437.2 86.3 423.0 482.4
28 Aug. 15 14:09-14:19 11 29.2 44.4 61.2 0.80 435.9 46.5 437.1 540.5
28 Aug. 15 14:34-14:44 12 28.0 40.4 66.1 0.59 180.9 14.1 442.4 496.4
28 Aug. 15 14:56-15:06 13 30.0 40.0 59.6 0.87 183.3 16.9 436.8 518.8
28 Aug. 15 15:29-15:39 9 26.8 26.1 79.7 0.23 36.5 1.1 452.5 455.8
9 Sep. 15 9:41-9:51 1 25.0 30.5 79.4 0.62 249.7 26.7 430.7 473.1
9 Sep. 15 9:58-10:08 2 25.1 30.4 78.4 2.63 770.2 283.7 407.1 486.2
9 Sep. 15 10:18-10:28 4 26.4 43.4 75.8 1.63 862.9 77.0 420.0 536.5
9 Sep. 15 10:47-10:57 6 25.8 42.0 78.5 1.39 305.6 42.4 425.2 512.1
9 Sep. 15 11:05-11:15 7 27.0 40.2 75.0 1.46 420.7 51.4 434.4 478.8
9 Sep. 15 11:22-11:32 9 24.6 25.4 82.3 1.23 91.4 10.7 442.0 451.6
9 Sep. 15 11:41-11:52 8 26.0 44.9 78.6 1.80 988.3 96.7 401.5 534.4
9 Sep. 15 12:07-12:17 5 24.6 24.6 80.3 1.93 10.7 0.0 446.3 443.3
9 Sep. 15 13:45-13:55 13 25.6 39.7 76.6 2.48 757.2 47.2 412.2 506.8
9 Sep. 15 14:06-14:16 12 24.6 38.5 81.3 1.20 241.7 22.4 440.6 487.0
9 Sep. 15 14:38-14:48 10 24.8 25.9 79.4 2.21 395.7 77.5 421.7 468.7
10 Sep. 15 9:34-9:44 5 23.8 23.9 79.2 0.82 11.9 2.8 434.6 434.2
10 Sep. 15 9:52-10:02 1 24.3 29.7 77.8 0.51 149.3 36.2 423.3 470.2
10 Sep. 15 10:08-10:18 4 25.2 42.9 76.1 2.16 813.7 67.8 377.5 519.4
10 Sep. 15 10:26-10:36 3 25.0 30.0 78.4 1.59 709.8 123.4 381.1 478.0
10 Sep. 15 10:42-10:52 2 25.6 35.5 76.6 2.07 759.4 252.1 388.6 491.9
10 Sep. 15 11:36-11:46 14 23.2 24.4 85.3 1.89 98.8 1.6 422.9 442.5
10 Sep. 15 13:15-13:25 6 27.4 50.6 72.3 1.51 844.9 129.0 377.8 539.0
10 Sep. 15 13:34-13:44 7 27.8 45.8 69.8 1.53 852.0 132.0 426.5 541.5
10 Sep. 15 13:51-14:01 8 27.4 49.8 68.9 2.09 839.1 78.3 381.8 558.1
10 Sep. 15 14:16-14:26 14 26.2 25.2 71.2 2.79 58.9 2.6 423.7 451.3
23 Jul. 16 9:28-9:38 15 30.6 48.1 71.2 0.01 672.1 68.1 448.9 525.9
23 Jul. 16 9:51-10:01 16 30.9 41.8 71.3 0.01 785.3 155.7 409.0 512.8
23 Jul. 16 10:33-10:43 17 32.3 51.8 67.8 0.75 849.5 69.1 421.1 368.6
23 Jul. 16 11:04-11:14 18 32.2 56.6 65.8 0.48 908.2 124.0 422.9 574.7
23 Jul. 16 11:26-11:36 19 31.0 27.5 73.9 0.17 41.2 0.7 474.7 486.3
23 Jul. 16 13:30-13:40 19 32.4 29.7 69.4 0.01 44.7 6.6 474.8 485.7
DOI: 10.4236/eng.2019.118034 486 Engineering Continued
23 Jul. 16 14:43-14:53 17 34.8 63.9 57.2 1.62 765.8 69.7 435.3 612.9
23 Jul. 16 14:58-15:08 16 34.1 42.7 65.8 1.18 741.5 138.3 437.6 542.6
23 Jul. 16 15:27-15:37 15 35.4 58.2 57.3 0.64 466.4 43.8 476.9 589.3
24 Jul. 16 9:30-9:40 19 30.6 29.7 75.6 0.00 58.0 12.7 465.0 477.2
24 Jul. 16 9:52-10:02 18 32.3 47.2 73.2 0.00 801.9 113.5 427.4 507.7
24 Jul. 16 10:21-10:31 17 32.0 50.5 72.7 0.83 713.9 47.0 435.2 577.3
24 Jul. 16 10:43-10:53 16 32.2 45.1 75.8 1.21 881.3 171.3 427.5 540.6
24 Jul. 16 11:03-11:13 15 32.1 56.1 71.1 0.60 811.1 75.1 466.5 585.4
24 Jul. 16 13:08-13:18 15 33.7 57.8 65.3 0.54 645.3 62.8 477.9 587.4
24 Jul. 16 13:28-13:38 16 34.8 46.7 67.5 0.94 977.2 185.3 439.1 561.2
24 Jul. 16 13:51-14:01 17 35.3 61.8 59.1 1.58 970.4 85.0 440.6 630.9
24 Jul. 16 14:20-14:30 18 33.7 61.4 59.7 0.97 766.6 98.8 445.0 609.5
24 Jul. 16 14:40-14:50 19 33.1 31.0 70.4 0.12 55.6 1.7 486.4 494.0
Ta is range of air temperature. Tf is range of ground surface temperature in the vicinity of the human body. RH is range of relative humidty. Va is range of air verocity. RSdwn is range of downward short wave solar radiation. RSup is range of upward short wave solar radiation. RLdwn is range of downward long wave radiation. RLup is range of upward long wave radiation.
even at observation sites where direct solar radiation is shielded. There is no re-markable difference between the average values of downward short-wave length solar radiation and downward long-wave length thermal radiation, and the in-tensity of long-wave length thermal radiation from the ground surface is shown. Therefore, it is considered that large environmental mitigation effect cannot be expected by simply seeking shade.
Kurazumi et al.[18] [19] [20] clarifies that when long-wave length thermal radiation is strong, the effect of shade in improving the thermal sensory percep-tion of the human body is low. Compared with these studies, the outdoor ther-mal environment in the present study has an extremely high air temperature. Therefore, reducing the influence of long-wave length thermal radiation is also considered indispensable for mitigation of the thermal environment in the rural and suburban regions.
Instances where the temperature of the ground surface exceeds 60˚C are also indicated at observation sites covered by asphalt pavement. Although the air tem-perature also has an effect, the influence of heating by downward short-wave length solar radiation and solar radiation absorptivity of the ground surface is ob-served. In addition, in a location where the ground surface is covered with plants or where there is a water surface, taking into account downward short-wave length solar radiation and the high temperature, long-wave length thermal radiation from the ground surface is relatively low.
DOI: 10.4236/eng.2019.118034 487 Engineering where short-wave length solar radiation is strong, and the reflected solar radia-tion is weak, heat gain of the human body by heat conducradia-tion is conjectured to have a strong effect on the contact skin temperature.
The surface temperature of the water surface is lower than the ground surface, which receives other short-wave length solar radiation, due to the influence of the heat capacity of paddy fields. According to Nishida et al.[30] etc., regarding the change in the irrigation water temperature at the stage of ripening of the head of the rice, the shielding rate of short-wave length solar radiation increases due to the increase in the leaf area due to the growth of the rice, and in addition to short-wave length solar radiation the influence of the air temperature in-creases. That is, it is conjectured that a natural ground surface such as the green areas and the water surfaces of paddy fields contribute to a long-wave length thermal radiation reduction effect.
The average value of the relative humidity is 72.8%, the standard deviation is 7.3%, and a noticeable difference in the measurement results is not shown. Ac-cordingly, the influence that the difference in evaporation heat exchange has on sensational and physiological temperature is considered to be weak. However, taking into account the high-humidity thermal environment, this is considered to cause a humid heat.
Average wind speed was 1.1 m/s and under 3 m/s throughout all observations. The standard deviation is 0.7 m/s, and it may have an effect on thermal sensory perception as a variable factor of environmental change.
Oliveira and Andrade [14] states that wind speed has the strongest influence overall on thermal comfort. Kurazumi et al.[9][17] considers the influence of the air current in both summer and winter seasons to be a factor that causes the outdoor thermal environment to affect the thermal sensation and thermal com-fort of the human body. The human body may experience discomcom-fort due to changing environmental factors, and so this experience can be thought to induce the condition of relative comfort. Accordingly, changes with an effect that miti-gates thermal function are considered to be possible variables for discomfort with regards to other environmental factors also.
DOI: 10.4236/eng.2019.118034 488 Engineering radiant heat transfer coefficient and convective heat transfer coefficient of the human body. The Hendler et al.[44] value of 0.98 found from the reflectance of skin in electromagnetic waves of wavelength 3 μm or more was used for the emissivity of the human body. The short-wave length solar radiation heat gain is affected by the solar radiation absorption factor. According to VDI3787-2 [45], the absorptivity of a clothed human body is 0.7. However, Watanabe et al.[46]
shows the absorptivity of a human body wearing black clothing to be 0.76 and that of one wearing white clothing to be 0.38. It also considers solar radiation absorptivity for other combinations of clothing or ordinary clothing to be within the range of the absorptivity of human body wearing black clothing or white clothing. In this study, the Hendler et al.[44] and Elam et al.[47] value of 0.70 found from the reflectance of skin in electromagnetic waves of wavelength 3 μm or less was used for the solar radiation absorption factor of the human body. Concerning the skin wettedness, values calculated by the Kurazumi et al. [48]
behavioral thermoregulation model were used because it was difficult to find the perspiration quantity. For the missing physiological quantities, values calculated by the behavioral thermoregulation model of Kurazumi et al. [48] were used. Moreover, the activity metabolic heat production was calculated using the ratio while seated position of Kurazumi et al.[49]. The outdoor thermal environment evaluation index ETFe theoretically proposed and verified by Kurazumi et al.[9] [12] was calculated from weather observation values, and the skin temperature and clo value of the human body.
4. Discussion
4.1. Relationship between ETFe and Thermal Sensation
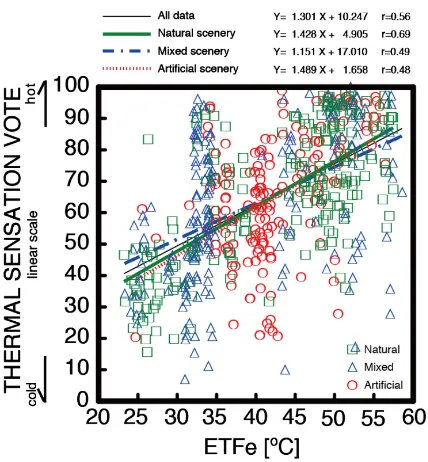
Figure 2 shows the relationship between ETFe and thermal sensation. There is a spread in the psychological reaction of the human body in an outdoor environ-ment due to many disturbances, but as the ETFe increases, the distribution of thermal sensation increases and the tendency for the sensation of hot to increase is shown. Significant spread in the psychological response of the human body is considered to occur due to the degree of freedom of mobilization in an outdoor space. The spread in thermal sensation becomes large in outdoor spaces due to the influence of environmental stimuli in addition to the psychological response to thermal action in the outdoor space. Although it can be thought of as a ther-mal adaptation, in this study experiments were carried out with the subjects in-structed to give thermally unique evaluations of psychological reactions. How-ever, in outdoor spaces that differ from laboratory tests, it is considered that the potential for environmental factors such as sight and hearing to impact on psy-chological response becomes high and this is expressed as a spread in evaluation values.
DOI: 10.4236/eng.2019.118034 489 Engineering
Figure 2. Relationship between ETFe and thermal sensation.
subjects is evaluated in the vicinity of the measurement instruments, it is excee-dingly difficult to have multiple subjects exposed to identical environmental sti-muli due to the effect of the influence of short-wave length solar radiation heat gain such as solar radiation shielding and the orientation of the human body with respect to the solar azimuth angle, and fluctuations in the air current, etc. The microclimate around the subjects may have affected the subjects’ thermal sensa-tion due to the difference in these environmental factors.
The outdoor thermal environmental factors of short-wave length solar radia-tion, long-wave length thermal radiation and the air current are nonuniform and non-targeted evaluation factors. These evaluation factors may contribute as a local effect on the human body, even if the heat balance in the whole human body is the same. Horikoshi et al.[50] clarifies that the psychological reactions of the human body in a heterogeneous/asymmetric thermal radiation environ-ment have directionality which changes under the effect of local thermal radia-tion. Kurazumi et al.[51][52] clarify that a parameter exists for the heterogene-ous/asymmetric thermal environmental factors in the thermal environment evaluation factors that evaluate the effect on the human body in a heterogene-ous/asymmetric thermal radiation environment. They show that there is a large spread in the response of the human body due to the effect of this parameter. That is, the spread in thermal sensory perception becomes large in outdoor spaces due to the influence of environmental stimuli in addition to the psychological re-sponse to thermal action in the outdoor space.
DOI: 10.4236/eng.2019.118034 490 Engineering makes it easy to explain the interaction. Accordingly, the relationship between ETFe and thermal sensation was examined by the green factor classification of Kurazumi et al.[53].
In a study to measure the psychological and physiological reactions in the outdoor environment, as a rule of thumb, good results have been obtained if there is about 0.4 coefficient of correlation [9][10][11][17][18][19][20][53] [54]. In other words, the coefficient of determination is less than about 0.16. Therefore, it can be said that the measurement result in this research is appro-priate.
Focusing on the regression line, the Thermal sensation tends to be higher as the ETFe becomes higher. Mixed scenery shows the tendency of the highest en-vironmental mitigation effect. Looking at the difference in green factor at almost the same ETFe, mixed scenery shows a slightly different tendency from natural scenery and artificial scenery. When ETFe is low, the thermal sensation is high. Meanwhile, when ETFe is high, the thermal sensation is low.
Given the measurement results of thermal environment factors in Table 2, the mixed scenery observation point with high ETFe is 18 Paddy side. The condition of 18 is strong short-wave length solar radiation and long-wave length thermal radiation from the ground surface. Nishida et al. [30] considers the environ-mental mitigation effect of the surface of paddy field to be related to water depth and water flow. The measurement period is at the ripening stage of the head of the rice, so the short-wave length solar radiation shielding rate on the water sur-face is high, but due to the fact that there is no flow of water and the heat capac-ity is high, in the time period when there is a large cumulative amount of short-wave length solar radiation, long-wave length thermal radiation may in-crease.
As pointed out by Kurazumi et al.[53], it is conjectured that there is also a visual influence due to the natural surface coverage by vegetation, etc. However, natural scenery shows a thermal sensation slightly hotter than mixed scenery, giving a result whereby the effect of natural surface coverage by vegetation, etc. is not apparent. Fukagawa et al.[55] and Kurazumi et al.[56][57][58] consider a landscape of thick vegetation with a high green factor to have a strong feeling of confinement, which makes it somewhat hot and somewhat uncomfortable thermal environment due to the sense of stagnation. In this study too, it can be conjectured that thermal sensation increased due to the influence of the green factor enhancing this sense of confinement.
Similarly, given the measurement results of thermal environment factors in
DOI: 10.4236/eng.2019.118034 491 Engineering strong. Both the concrete wall surface of the building and the stone wall of the revetment are close to the human body, so the angle factor with the human body is large and it is conjectured that the long-wave length thermal radiation heat gain increased. 6 is considered to have strong long-wave length thermal radia-tion from paddy fields in the time period when accumulated amount of short-wave length solar radiation becomes large, as a result of the high heat ca-pacity of paddy fields. For 5, it is conjectured that the feeling of confinement caused by the surrounding wisteria promoting a sense of heat and increased the thermal sensation.
Therefore, it can be said that ground surface features with a high heat capacity and situations that evoke a feeling of confinement tend to increase the thermal sensation by promoting the sensation of hot.
An inspection of the parallelism of the regression lines gave p > 0.10 (RMSE = 17.95, F = 1.64, p = 0.19), indicating no significant difference in the parallelism of the regression lines. An inspection of the homogeneity of regression gave p < 0.10 (RMSE = 21.64, F = 2.52, p = 0.08), indicating a significant difference in the homogeneity of the regression lines. As a result of multiple comparison by Tu-key-Kramer, natural scenery and mixed scenery were p < 0.10 (p = 0.08), show-ing a significant difference. Therefore, it can be considered that the influence of the green factor was expressed in the thermal sensation.
Focusing on the regression line for all experimental results, the ETFe that gives a neither hot nor cold, thermally neutral thermal sensation of 50 is 30.6˚C. As identified by Humphreys [1], Brager and de Dear [2], and Kurazumi et al.[9] [10] [11], the sense of expectation that the thermal environment of an indoor space will be more comfortable than the air temperature of an outdoor space has an effect and it is considered possible that the neutral temperature for the indoor space will change. Unlike indoor spaces, the sense of expectation with regards to comfort in outdoor spaces is low to begin with and they are not judged to be comfortable thermal environments, so it is conceivable that this permissibility raised the neutral temperature, even for thermal environment conditions whe-reby ETFe is high. In this study on rural and suburban regions, the ETFe that gives a neutral thermal sensation of 50 is low in comparison to the subject expe-riments in the urban environment in Kurazumi et al.[9] [10][11]. Compared with the urban environment, it is conceivable that the difference in the percep-tual environment, whereby it is subconsciously assumed to be a comfortable thermal environment, had an effect in the rural and suburban regional environ-ment.
4.2. Relationship between ETFe and Thermal Comfort
DOI: 10.4236/eng.2019.118034 492 Engineering
Figure 3. Relationship between ETFe and thermal comfort.
instructed the subjects instructed to give thermally unique evaluations of psy-chological reactions. However, in outdoor spaces that differ from laboratory tests, it is considered that the potential for environmental factors such as sight and hearing to impact on psychological response becomes high and this is ex-pressed as a spread in evaluation values.
As stated in “Relationship between ETFe and thermal sensation”, environ-mental stimuli in outdoor spaces are in a heterogeneous and unsteady state. The human body may experience discomfort due to changing environmental factors, and so this experience can be thought to induce the condition of relative comfort. Accordingly, changes with an effect that mitigates thermal function are considered to be variables for discomfort with regards to other environmental factors also
[9][10][11].
Focusing on the regression line, the Thermal comfort tends to be lower as ETFe becomes higher. The tenancy was shown for artificial scenery to have the strongest level of discomfort. As identified by Kurazumi et al.[53], it is conjec-tured that there is also a visual influence due to the natural surface coverage by vegetation, etc.
influ-DOI: 10.4236/eng.2019.118034 493 Engineering ence of green factor was expressed in the thermal comfort.
Focusing on the regression line for all experimental results, the ETFe that gives a neither comfortable nor uncomfortable thermal comfort of 50 is 35.5˚C. As already stated, the environmental stimuli in an outdoor space may evoke a human body response that differs to an indoor space. Also, unlike the relation-ship acquired for indoor spaces, the sense of expectation with regards to comfort in outdoor spaces is low to begin with and they are not judged to be comfortable thermal environments, so it is conceivable that even thermal environment con-ditions with high ETFe are permitted. In this study on rural and suburban re-gions, the ETFe that gives a neither comfortable nor uncomfortable thermal comfort of 50 is low in comparison to the subject experiments in the urban en-vironment in Kurazumi et al.[9][10][11]. Compared with the urban environ-ment, it is conceivable that the difference in the perceptual environenviron-ment, whe-reby it is subconsciously assumed to be a comfortable thermal environment, had an effect in the rural and suburban regional environment.
[image:19.595.252.494.446.705.2]4.3. Relationship between Mean Skin Temperature and Thermal
Sensation
Figure 4 shows the relationship between mean skin temperature and thermal sensation. The trend is shown for the distribution of thermal sensation to in-crease as the mean skin temperature rises, and for sensation of hot to become strong. Significant spread in the psychological response of the human body in the outdoor space can be considered to occur due to the degree of freedom of mobilization in the experiment environment.
DOI: 10.4236/eng.2019.118034 494 Engineering
Figure 5. Relationship between mean skin temperature and thermal comfort.
As identified by Kurazumi et al. [59], when the measurement site of skin temperature is receiving strong short-wave length solar radiation and faces the azimuth angle of the short-wave length solar radiation, skin temperature exceeds 40˚C, and mean skin temperature is also significantly higher. In this study, it is considered that individual differences in mean skin temperature resulted from whether or not the skin temperature measurement site on the subject exposed to the thermal environment surrounding the environmental measuring instrument was directly facing the solar azimuth. It is considered essential to investigate the measurement site of the mean skin temperature in outdoor environments taking into account parts in the sun and in shade. From the measurement results of the above thermal environment factor, it is conceivable that the influence of short-wave length solar radiation and long-wave length thermal radiation is strong. Focusing on the regression line, the thermal sensation tends to be higher as the mean skin temperature becomes higher. The slope of natural scenery is the largest and the variation of thermal sensation with respect to the change of mean skin tempera-ture is large. As stated in “Relationship between ETFe and thermal sensation”, a situation that tends to generate a sense of confinement can be considered to in-crease thermal sensation by promoting the sensation of hot.
show-DOI: 10.4236/eng.2019.118034 495 Engineering ing a significant difference. Similar to the relationship between ETFe and ther-mal sensation, it can be considered that the influence of green factor was ex-pressed in the thermal sensation.
Focusing on the regression line for all experimental results, the mean skin temperature that gives a neither hot nor cold, thermally neutral thermal sensa-tion of 50 is 33.0˚C. In the subject experiments of Tsuchikawa et al.[60] on sub-jects in an indoor space, the mean skin temperature by which a standing human experiences a neither hot nor cold, thermally neutral sensation is reported to be 32.5˚C. In subject experiments of Kurazumi et al.[11] on subjects in an outdoor space, the mean skin temperature by which a standing human experiences a neither hot nor cold, thermally neutral sensation is reported to be 33.3˚C. The difference in mean skin temperature that gives a thermally neutral sensation between the urban environment and the rural and suburban environment is not large, but mean skin temperature is higher in the outdoor space than in the in-door space.
4.4. Relationship between Mean Skin Temperature and Thermal
Comfort
Figure 5 shows the relationship between mean skin temperature and thermal comfort. The trend is shown for the distribution of thermal comfort to decrease as the mean skin temperature rises, and for discomfort to become strong. Signif-icant spread in the psychological response of the human body in the outdoor space can be considered to occur due to the degree of freedom of mobilization in the experiment environment.
Focusing on the regression line, the thermal comfort tends to become lower as mean skin temperature increases. The slope of mixed scenery is the smallest and the variation of thermal comfort with respect to the change of mean skin tem-perature is large. The thermal comfort of the mixed scenery is the highest. As stated in “Relationship between ETFe and thermal comfort”, it is conjectured that there is also a visual influence due to the natural surface coverage by vegeta-tion, etc. [53]. However, the green factor classified as natural scenery is likely to produce a sense of confinement, conceivably promoting discomfort and lower-ing thermal comfort.
An inspection of the parallelism of the regression lines gave p > 0.10 (RMSE = 22.45, F = 0.22, p = 0.81), indicating no significant difference in the parallelism of the regression lines. An inspection of the homogeneity of regression gave p < 0.10 (RMSE = 24.15, F = 4.64, p = 0.01), indicating a significant difference in the homogeneity of the regression lines. As a result of multiple comparison by Tu-key-Kramer, mixed scenery and natural scenery, and mixed scenery and artificial scenery were both p < 0.10 (p = 0.02, p = 0.03), showing a significant difference. Similar to the relationship between ETFe and thermal comfort, it can be consi-dered that the influence of green factor was expressed in the thermal comfort.
com-DOI: 10.4236/eng.2019.118034 496 Engineering fort of 50 is 34.0˚C. In the subject experiments of Tsuchikawa et al.[60] on sub-jects in an indoor space, the mean skin temperature by which a standing human experiences a neither comfortable nor uncomfortable, thermally neutral sensa-tion is reported to be 33.0˚C. As stated in “The relasensa-tionship ETFe and thermal sensation”, unlike indoor spaces, the sense of expectation for the degree of fort in outdoor spaces is low to begin with and they are not judged to be com-fortable thermal environments, so it is conceivable that even thermal environ-ment conditions in which mean skin temperature becomes high were permitted. In addition, the effect of variations of the environmental factors is considered to contribute to mitigating the effect of discomfort.
[image:22.595.254.492.446.705.2]4.5. Relationship between Thermal Sensation and Thermal
Comfort
Figure 6 shows the relationship between thermal sensation and thermal com-fort. The trend is shown for the distribution of thermal comfort to decrease as the thermal sensation increases, and for discomfort to become strong. Signifi-cant spread in the psychological response of the human body in the outdoor space can be considered to occur due to the degree of freedom of mobilization in the experiment environment.
Focusing on the regression line, the thermal comfort of the mixed scenery is the highest. An inspection of the parallelism of the regression lines gave p > 0.10 (RMSE = 17.16, F = 0.11, p = 0.90), indicating no significant difference in the parallelism of the regression lines. An inspection of the homogeneity of regres-sion gave p < 0.10 (RMSE = 24.15, F = 4.64, p = 0.01), indicating a significant
DOI: 10.4236/eng.2019.118034 497 Engineering difference in the homogeneity of the regression lines. As a result of multiple comparison by Tukey-Kramer, mixed scenery and natural scenery, and mixed scenery and artificial scenery were both p < 0.10 (p = 0.03, p = 0.02), showing a significant difference. Similar to the relationship between ETFe and thermal comfort, the comfort of mixed scenery is relatively high. Therefore, it can be considered that the influence of green factor was expressed in the thermal com-fort.
Focusing on the regression line for all experimental results, the thermal sensa-tion that gives a neither comfortable nor uncomfortable thermal comfort of 50 is the neither hot nor cold thermally neutral 56.0. When a comfortable ETFe is ob-tained from the relationship between ETFe and thermal sensation according to this condition as shown in Figure 2, ETFe is obtained as 35.2˚C. As stated in Kurazumi et al.[11], the sense of expectation for the degree of comfort in out-door spaces is low to begin with and they are not judged to be comfortable thermal environments, so it is conceivable that even thermal environments with a high ETFe or in which mean skin temperature becomes high were permitted.
Höppe [61], Nikolopoulou and Steemers [5], Spagnolo and de Dear [62], Na-kano and Tanabe [63], Ahmed [64], Oliveira and Andrade [14], Lin and Matza-rakis [65], Cheng et al. [66] and Kurazumi et al. [10] consider the allowable range of comfort in an outdoor space to be wider than that in an indoor space. Also, Kurazumi et al.[10] shows an ETFe of 31.6˚C - 38.5˚C to be a comfortable thermal environment range for outdoor spaces in urban areas.
Kurazumi et al.[53] shows that tolerance limit is higher in an outdoor space than in an indoor space. Compared with the urban environment, the difference in the perceptual environment, whereby it is subconsciously assumed to be a comfortable thermal environment, had an effect in the rural and suburban re-gional environment, resulting in an ETFe lower than the upper limit of comfort in a summer urban environment of Kurazumi et al.[10].
5. Conclusions
Focusing on the rural and suburban regions where paddy fields remain, subject experiments were conducted to clarify the effect of thermal environmental fac-tors on the human body in an outdoor space. The relationship between thermal environment evaluation index (ETFe) and the physiological/psychological re-sponse of the human body was investigated.
DOI: 10.4236/eng.2019.118034 498 Engineering A landscape of thick vegetation with a high green factor may have a strong feeling of confinement, which can make it somewhat hot and somewhat uncom-fortable thermal environment due to the sense of stagnation.
The ETFe that gives a neither hot nor cold, thermally neutral thermal sensa-tion was 30.6˚C. The ETFe that gives neither comfortable nor uncomfortable thermal comfort was 35.5˚C. The mean skin temperature that gives a neither hot nor cold, thermally neutral thermal sensation was 33.0˚C. The mean skin temper-ature that gives neither comfortable nor uncomfortable thermal comfort was 34.0˚C. The sense of expectation for the degree of comfort in outdoor spaces is low to begin with and they are not judged to be comfortable thermal environ-ments, so it is conceivable that even thermal environments with a high ETFe or in which mean skin temperature becomes high were permitted.
The thermal sensation that gives neither comfortable nor uncomfortable ther-mal comfort was a neither hot nor cold therther-mally neutral 56.0. When a comforta-ble ETFe is obtained from the relationship between ETFe and thermal sensation according to this condition, ETFe is obtained as 35.2˚C. Compared with the ur-ban environment, it is conceivable that the difference in the perceptual envi-ronment, whereby it is subconsciously assumed to be a comfortable thermal en-vironment, had an effect on the rural and suburban regional enen-vironment, re-sulting in an ETFe lower than the upper limit of comfort in a summer urban en-vironment.
Acknowledgements
We would like to express our sincerest gratitude to the study subjects who parti-cipated in the present study.
Conflicts of Interest
The authors declare no conflicts of interest regarding the publication of this pa-per.
References
[1] Humphreys, M. (1976) Field Studies of Thermal Comfort Compared and Applied. Building Services Engineer, 44, 5-27.
[2] Brager, G.S. and deDear, R.J. (1998) Thermal Adaptation in the Build Environment: A Literature Review. Energy and Buildings, 27, 83-96.
https://doi.org/10.1016/S0378-7788(97)00053-4
[3] Nikolopoulou, M., Baker, N. and Steemers, K. (2001) Thermal Comfort in Outdoor Urban Spaces, Understanding the Human Parameter. Solar Energy, 70, 227-235. https://doi.org/10.1016/S0038-092X(00)00093-1
[4] de Dear, R.J. and Brager, G.S. (2002) Thermal Comfort in Naturally Ventilated Buildings, Revisions to ASHRAE Standard 55. Energy and Buildings, 34, 549-561. https://doi.org/10.1016/S0378-7788(02)00005-1
DOI: 10.4236/eng.2019.118034 499 Engineering [6] Knez, I. and Thorsson, S. (2006) Influence of Culture and Environmental Attitude
on Thermal, Emotional and Perceptual Evaluations of a Square. International Jour-nal of Biometeorology, 50, 258-268.https://doi.org/10.1007/s00484-006-0024-0 [7] Nikolopoulou, M. and Lykoudis, S. (2006) Thermal Comfort in Outdoor Urban
Spaces: Analysis across Different European Countries. Building and Environment, 41, 1455-1470.https://doi.org/10.1016/j.buildenv.2005.05.031
[8] Kántor, N. and Unger, J. (2011) Benefits and Opportunities of Adopting GIS in Thermal Comfort Studies in Resting Places: An Urban Park as an Example. Land-scape and Urban Planning, 98, 36-46.
https://doi.org/10.1016/j.landurbplan.2010.07.008
[9] Kurazumi, Y., Tsuchikawa, T., Matsubara, N., Kondo, E. and Horikoshi, T. (2011) Evaluation of Enhanced Conduction-Corrected Modified Effective Temperature ETFe as the Outdoor Thermal Environment Evaluation Index. Energy and Build-ings, 43, 2925-2937.https://doi.org/10.1016/j.enbuild.2011.07.019
[10] Kurazumi, Y., Tsuchikawa, T., Kondo, E., Ishii, J., Fukagawa, K., Yamato, Y., Tobi-ta, K., Ando, Y., Matsubara, N. and Horikoshi, T. (2012) Thermal Comfort Zone in Outdoor Environment. Journal of Human and Living Environment, 19, 115-127. [11] Kurazumi, Y., Ishii, J., Kondo, E., Fukagawa, K., Bolashikov, Z.D., Sakoi, T.,
Tsu-chikawa, T., Matsubara, N. and Horikoshi, T. (2014) The Influence of Outdoor Thermal Environment on Young Japanese Female. International Journal of Biome-teorologyogy, 58, 963-974.https://doi.org/10.1007/s00484-013-0681-8
[12] Kurazumi, Y., Fukagawa, K., Yamato, Y., Tobita, K., Kondo, E., Tsuchikawa, T., Horikoshi, T. and Matsubara, N. (2011) Enhanced Conduction-Corrected Modified Effective Temperature as the Outdoor Thermal Environment Evaluation Index upon the Human Body. Building and Environment, 46, 12-21.
https://doi.org/10.1016/j.buildenv.2010.06.012
[13] Givoni, B., Noguchi, M., Saaroni, H., Pochter, O., Yaacov, Y., Feller, N. and Becker, S. (2003) Outdoor Comfort Research Issues. Energy and Buildings, 35, 77-86. https://doi.org/10.1016/S0378-7788(02)00082-8
[14] Oliveira, S. and Andrade, H. (2007) An Initial Assessment of the Bioclimatic Com-fort in an Outdoor Public Space in Lisbon. International Journal of Biometeorolo-gyogy, 52, 69-84.https://doi.org/10.1007/s00484-007-0100-0
[15] Eliasson, I., Knez, I., Westerberg, U., Thorsson, S. and Lindberg, F. (2007) Climate and Behaviour in a Nordic City. Landscape and Urban Planning, 82, 72-84. https://doi.org/10.1016/j.landurbplan.2007.01.020
[16] Ishii, J., Horikoshi, T., Kurazumi, Y., Nagano, K. and Fukagawa, K. (2008) A Field Survey of Thermal Comfort in Outdoor Space. 18th International Congress of Bio-meteorology, Tokyo, 22-26 September 2008, 1-4.
[17] Kurazumi, Y., Kondo, E., Ishii, J., Sakoi, T., Fukagawa, K., Bolashikov, Z.D., Tsu-chikawa, T., Matsubara, N. and Horikoshi, T. (2013) Effect of the Environmental Stimuli upon the Human Body in Winter Outdoor Thermal Environment. Journal of Environmental and Public Health, 2013, Article ID: 418742.
https://doi.org/10.1155/2013/418742
[18] Kurazumi, Y., Ishii, J., Fukagawa, K. and Aruninta, A. (2015) The Influence of Tropical Urban Climate upon the Human Body. International Joint-Conference of SENVAR-iNTA-AVAN, Johor, 24-26 November 2015, 105-114.
DOI: 10.4236/eng.2019.118034 500 Engineering https://doi.org/10.4236/ajcc.2016.51007
[20] Kurazumi, Y., Ishii, J., Fukagawa, K., Kondo, E., Nyilas, A. and Aruninta, A. (2017) Seasonal Differences of Psychological and Physiological Responses in Tropical Ur-ban Climate. Health, 9, 896-920.https://doi.org/10.4236/health.2017.96064
[21] Murakawa, S., Sekine, T., Narita, K. and Nishina, D. (1988) Study on the Effect of River on Thermal Environment in Urban Area. Journal of Architecture, Planning and Environmental Engineering, 393, 25-34.https://doi.org/10.3130/aijax.393.0_25 [22] Murakawa, S., Sekine, T., Narita, K., Nishina, D. and Senda, K. (1988) Study on the
Effect of River on Thermal Environment in Urban Area (Part 2). Journal of Archi-tecture, Planning and Environmental Engineering, 415, 9-19.
[23] Gao, W., Miura, S. and Ojima, T. (1994) Site Survey on Formation of Thermal Cool Island Due to Park and Inner River in Koto-Ku, Tokyo, Thermal Effects of the Open Space with Green Area on the Urban Environment Part II. Journal of Archi-tecture, Planning and Environmental Engineering, 456, 75-83.
https://doi.org/10.3130/aija.59.75_1
[24] Hashimto, T. and Horikoshi, T. (2003) The Effects of Shonai and Shinkawa Rivers Running around the Outskirts of Nagoya as “Wind Trail” of the Sea Breeze on the Urban Thermal Environment. Journal of Environmental Engineering, 571, 55-62. https://doi.org/10.3130/aije.68.55_2
[25] Kiyota, T., Taniguchi, A., Kiyota, N. and Nakamura, Y. (2006) The Study on Coun-termeasures against the Heat Island Phenomenon in the Urban Area: Part 1 The Characteristics of Air Temperature in the Urban Area of Hiroshima among Calm, Sea Breeze and Land Breeze. Journal of Environmental Engineering, 602, 69-75. https://doi.org/10.3130/aije.71.69_1
[26] Sasaki, K., Junimura, Y., Mochida, A., Watanabe, H. and Yoshino, H. (2007) Field Measurements of Regional Climate in a Provincial Coastal City along the Pacific in Tohoku Region in Summer, Influence of Wind Condition, Such as Yamase, and Green Coverage Ratio on Air Temperature. Journal of Environmental Engineering, 613, 99-85.https://doi.org/10.3130/aije.72.79_1
[27] Ishii, A., Katayama, T., Nishida, M., Hayashi, T., Shiozuki, Y., Tutsumi, J., Kitaya-ma, H, TakayaKitaya-ma, K., Murooka, H. and Ooguro, M. (1989) Thermal Environment in the Urban Area around the Park with a Large Pond, Comparison of When Water Filing and When Water Pumped out for Cleaning the Bed. Summaries of Technical Papers of Annual Meeting Architectural Institute of Japan, D Environmental Engi-neering, 1087-1088.
[28] Fukagawa, K., Shimazawa, T., Muranaka, S., Koshikawa, Y. and Ando, M. (2006) A Study of the Differences on the Formation of Temperature among Urban Areas, Rural Areas, and around Irrigation Ponds in a Developing City. Journal of Envi-ronmental Engineering, 605, 95-102. https://doi.org/10.3130/aije.71.95_2
[29] Fukagawa, K., Murakawa, S., Nishida, D. and Shimazawa, T. (2008) Formation of the Temperature in Summer beside Agricultural Irrigation Ponds Located in Urban Area. Journal of Environmental Engineering, 626, 503-510.
https://doi.org/10.3130/aije.73.503
[30] Nishida, K., Mitsuyasu, M., Yoshida, S. and Shirozawa, S. (2017) Relationship be-tween Water Depth and Water and Soil Temperature in a Paddy Field during Rice Ripening Period. Irrigation, Drainage and Rural Engineering Journal, 305, 253-263. [31] World Medical Association (2018) WMA Declaration of Helsinki—Ethical
Prin-ciples for Medical Research Involving Human Subjects.
https://www.wma.net/policies-post/wma-declaration-of-helsinki-ethical-principles-DOI: 10.4236/eng.2019.118034 501 Engineering
for-medical-research-involving-human-subjects/
[32] Kurazumi, Y., Horikoshi, T., Tsuchikawa, T. and Matsubara, N. (1994) The Body Surface Area of Japanese. Japanese Journal of Biometeorology, 31, 5-29.
[33] Kurazumi, Y., Tsuchikawa, T., Yamato, Y., Kakutani, K., Matsubara, N. and Hori-koshi, T. (2003) The Posture and Effective Thermal Convection Area Factor of the Human Body. Japanese Journal of Biometeorology, 40, 3-13.
[34] Hanada, K., Mihira, K. and Ohhata, K. (1981) Studies on the Thermal Resistance of Women’s Underweares. Journal of the Japan Research Association for Textile End-Use, 22, 430-437.
[35] Hanada, K., Mihira, K. and Sato, Y. (1983) Studies on the Thermal Resistance of Men’s Underweares. Journal of the Japan Research Association for Textile End-Use, 24, 363-369.
[36] Horikoshi, T. and Kobayashi, Y. (1985) Corrected Humid Operative Temperature as an Index of Combined Influences of Thermal Conditions upon the Human Body. Journal of Architecture, Planning and Environmental Engineering, 355, 12-19. https://doi.org/10.3130/aijax.355.0_12
[37] Horikoshi, T., Kobayashi, Y. and Tsuchikawa, T. (1991) Indices of Combined and Independent Effect of Thermal Environmental Variable upon the Human Body. ASHRAE Transactions, 97, 228-238.
[38] Kurazumi, Y., Tsuchikawa, T., Torii, T., Kakutani, K., Matsubara, N. and Horikoshi, T. (2004) Weighting Coefficients for Calculating Mean Skin Temperature When Considering Convective Heat Transfer Areas. Journal of the Human-Environmental System, 7, 19-28.https://doi.org/10.1618/jhes.7.19
[39] Kurazumi, Y., Matsubara, N., Furukawa, N., Fujiwara, M., Ue, A., Ueki, Y., Nagai, H. and Yamamoto, S. (1998) Japanese Weighting Coefficients for Calculating Mean Skin Temperature in Relation to Posture. Japanese Journal of Biometeorology, 35, 121-132.
[40] Kurazumi, Y., Tsuchikawa, T., Kakutani, K., Torii, T., Matsubara, N. and Horikoshi, T. (2003) Evaluation of the Calculation Formula for the Body Surface Area of the Human Body. Japanese Journal of Biometeorology, 39, 101-106.
[41] Kurazumi, Y., Tsuchikawa, T., Matsubara, N. and Horikoshi, T. (2008) Effect of Posture on the Heat Transfer Areas of the Human Body. Building and Environ-ment, 43, 1555-1565.https://doi.org/10.1016/j.buildenv.2007.09.001
[42] Miyamoto, S., Horikoshi, T. and Hirokawa, Y. (1998) Projected Area Factors of the Human Body at Standing Posture under Different Clothing Conditions. Journal of Architecture, Planning and Environmental Engineering, 513, 47-52.
https://doi.org/10.3130/aija.63.47_4
[43] Kuwabara, K., Mochida, T., Kondo, M. and Matsunaga, K. (2003) Measurement of Man’s Convective Heat Transfer Coefficient by Using a Thermal Manikin in the Middle Wind Velocity Region. Journal of Human and Living Environment, 8, 27-32. [44] Hendler, E., Crosbie, R. and Hardy, J.D. (1958) Measurement of Heating of the Skin
during Exposure to Infrared Radiation. Journal of Applied Physiology, 12, 177-185. https://doi.org/10.1152/jappl.1958.12.2.177
[45] VDI (2008) VDI 3787-2, Environmental Meteorology—Methods for the Human Biometeorological Evaluation of Climate and Air Quality for Urban and Regional Planning at Regional Level—Part 1: Climate. Beuth, Berlin.
Biomete-DOI: 10.4236/eng.2019.118034 502 Engineering orology, 47, 165-173.
[47] Elam, R., Goodwin, D.W. and Lloyd Williams, K. (1963) Optical Properties of the Human Epidermis. Nature, 198, 1001-1002.https://doi.org/10.1038/1981001a0 [48] Kurazumi, Y., Sakoi, T., Tsuchikawa, T., Fukagawa, K., Bolashikov, Z.D. and
Hori-koshi, T. (2014) Behavioral Thermoregulation Model for Evaluation of Outdoor Thermal Environment. Journal of Ergonomics, 4, 1-14.
https://doi.org/10.4172/2165-7556.1000125
[49] Kurazumi, Y., Nakamura, R. and Matsubara, N. (2000) Effect of Different Postures on the Resting Metabolic Rate of Young Japanese at Operative Temperature of 28 ˚C. Japanese Journal of Biometeorology, 37, 27-37.
[50] Horikoshi, T., Kurazumi, Y., Hirayama, K., Tsuchikawa, T. and Kobayashi, Y. (1989) Indication of the Effect of Asymmetric Thermal Radiation of the Human Physiological and Psychological Responses. The Second World Congress on Heat-ing, Ventilating, Refrigerating and Air Conditioning, Sarajevo, 27 August-1 Sep-tember 1989, 188-193.
[51] Kurazumi, Y., Horikoshi, T., Hirayama, K., Tsuchikawa, T. and Kobayashi, Y. (1993) The Influence of Asymmetric and Uneven Thermal Radiation Environments upon the Human Body, in the Case of Constant Operative Temperature. Journal of Architecture, Planning and Environmental Engineering, 447, 17-26.
https://doi.org/10.3130/aijax.447.0_17
[52] Kurazumi, Y., Saito, K. and Horikoshi, T. (1994) The Influence of Asymmetric Thermal Radiation Environments upon the Human Body, in the Case of Constant Operative Temperature and Right and Left, Back and Forth Asymmetry. Japanese Journal of Biometeorology, 31, 75-84.
[53] Kurazumi, Y., Matsubara, N., Tsuchikawa, T., Kondo, E., Ishii, J., Fukagawa, K., Ando, Y., Yamato, Y., Tobita, K. and Horikoshi, T. (2011) Psychological Effects of the Environmental Stimuli on Thermal Sense in Outdoor Spaces. Japanese Journal of Biometeorology, 48, 129-144.
[54] Kurazumi, Y., Fukagawa, K., Kondo, E., Yamato, Y. and Tobita, K. (2015) The In-fluence of Solar Radiation upon the Human Body. The 15th Science Council of Asia Conference and International Symposium, Siem Reap City, 15-16 May 2015, 154-158.
[55] Fukagawa, K., Kurazumi, Y., Yamato, Y., Tobita, K., Hase, H., Han, S., Oishi, H. and Cao, Z. (2010) The Effect of Visual Stimulus on Thermal Comfort, Analysis of the Visual Factor by Experiment. The 7th International Cost Engineering Council World Congress & The 14th Pacific Association of Quantity Surveyors Congress, Singapore, 23-27 July 2010, 1-10.
[56] Kurazumi, Y., Fukagawa, K., Kondo, E. and Sakoi, T. (2014) Effects of Visual Sti-muli upon Thermal Sense under Air Conditioning in Summer. Journal of Ergo-nomics, 4, 1-7.
[57] Kurazumi, Y., Kondo, E., Fukagawa, K., Hashimoto, R., Nyilas, A., Sakoi, T. and Tsu-chikawa, T. (2017) The Influence of Foliage Plants on Psychological and Physiological Responses. Health, 9, 601-621.https://doi.org/10.4236/health.2017.94043
[58] Kurazumi, Y., Hashimoto, R., Nyilas, A., Yamashita, K., Fukagawa, K., Kondo, E., Yamato, Y., Tobita, K. and Tsuchikawa, T. (2018) Effect of Visual Stimuli of Indoor Floor Plants upon the Human Responses. Health, 10, 928-948.
https://doi.org/10.4236/health.2018.107069