Munich Personal RePEc Archive
Gender differences and the effect of
facing harder competition
John, June
Stanford University, Graduate School of Education
22 August 2017
1
Gender differences and the effect of facing harder competition
June Park John
Graduate School of Education 520 Galvez Mall, Stanford, CA 94305
Stanford University [email protected]
Abstract:
Gender differences in competition have been demonstrated in a variety of contexts, yet it remains unclear how people respond to competitors they perceive to be hard or easy, and
whether gender differences exist in this response. I run an experiment in eighteen public high school classrooms to study the effect of competing in a math task against different levels of competitors. I exploit natural sorting within grade levels in Malaysian public schools to randomly assign competitors of different perceived difficulty levels. Using a standard
competition measure, males are significantly more competitive than females. However, when students face harder competitors, males respond by lowering performance while the performance of females does not vary significantly by level of competition.
Keywords: gender differences; competition; gender performance; tournament; piece-rate; information
JEL Codes: I20, J16, J24.
* I am especially grateful to Muriel Niederle for her mentorship and guidance. I thank Douglas Bernheim, Al Roth, Charlie Sprenger, Erin Fahle, and participants in the behavioral economics and CEPA seminars for their valuable feedback. I thank the editor and referees who provided helpful comments. I am grateful to the staff and students at the five schools. Mary John and K.J. John provided access for all the schools in the study. Johann John, Kimberly Gan and Sheng Wei Chiam provided excellent research assistance. The research reported here was supported by the Freeman Spogli Institute of International Studies through the Mentored Global Research
Fellowship and the Institute of Education Sciences, U.S. Department of Education, through Grant R305B090016 to the Board of Trustees of the Leland Stanford Junior University. The opinions expressed are those of the author and do not represent views of the Institutes or the U.S. Department of Education.
2
1.
Introduction
Many studies have shown that females are less competitive than males in stereotypically
male tasks (see Niederle and Vesterlund, 2011 for review), which explains some of the gender
differences in later education and career outcomes (Almås et al., 2016; Buser et al., 2014; Buser
et al., 2017; Ors et al., 2013; Zhang, 2013). One important aspect of competition is the perceived
difficulty of the competitors: people may react differently in competition when facing easier or
harder opponents. Gender differences in these reactions can help explain dynamics of
competition and inform policy decisions about the characteristics of competitions in schools or
the workplace. Existing research on the perceived difficulty of the competition primarily relies
on information provided in a laboratory context which may have limited applicability in the
field. In the current study, I exploit natural sorting within grade levels to randomly assign
competitors of different perceived difficulty levels to examine the effect of facing harder
competitors by gender in addition to replicating the standard gender gap on a math task in
Malaysian public schools.
Gender gaps in competition have been categorized by both choice and performance.
Females are shown to be less likely than males to choose into competition, a well-established
finding in the literature (Niederle and Vesterlund, 2007). Recent research explores how factors
such as task or information affect this gender gap (see Niederle, 2016 for review). There is less
consistent evidence, however, of gender differences in performance in competitive
environments. A seminal paper finds that females perform worse than males when solving
puzzles under a competitive incentive scheme, although there is no difference in performance
under a non-competitive incentive scheme (Gneezy et al., 2003). Other studies use similar
designs and puzzle tasks with similar results (Datta Gupta et al., 2013; Günther et al., 2010).
Niederle et al. (2013) finds that males outperform females in math tasks under competition.
However, other studies show no gender differences in performance under either non-competitive
or competitive incentives in math tasks (Ertac and Szentes, 2011; Niederle and Vesterlund, 2007;
Wozniak et al., 2014).
The literature indicates that gender differences in competitive performance cannot be
simply explained by differential ability, which has shifted some recent literature to study how
3
competition is how people respond to harder or easier competitors and whether there are gender
differences in these responses, the focus of the current study.
Prior research has examined reactions to different levels of competition by providing
information or relative feedback during competition1 in a laboratory environment (Buser, 2016;
Cason et al., 2010; Eriksson et al., 2009; Ertac and Szentes, 2011; Gill and Prowse, 2014;
Kuhnen and Tymula, 2011; Wozniak et al., 2014), with one recent study conducted in a field
setting (Wozniak et al., 2016). In these studies, information about either random competitors or
deliberately lower- or higher-performing competitors is given to subjects prior to subsequent
competition decisions and performance.
Rational behavior predicts that people would be more reluctant to enter into competition
against more difficult competition. Cason et al. (2010) created groups of relatively weaker,
stronger, or superstar competition and the study finds that, as expected, the fraction of entry into
a tournament is highest against the weaker group and lowest against the superstar group. No
breakdown by gender is provided, although there is some indication of gender differences--
females under-enter a proportional pay tournament given their expected payout, with no gender
difference in under- or over-entry for the winner-take-all tournament. A clear gender difference
in choice of competition is demonstrated in an unpublished study by Niederle and Yestrumskas
(2008), which shows that females choose a less difficult and less lucrative task than males;
however, both genders receive lower payout than if they had optimally chosen their task
difficulty.
There is consistent evidence that information about target or relative score provided to
subjects decreases or even eliminates the gender gap in entry into competition (Ertac and
Szentes, 2011; Wozniak et al., 2014), although Wozniak et al. (2016) finds a persistent gender
gap in competition entry among low-ability participants even after information is provided.
However, the effect of information on gender differences in performance is less clear.
When subjects must compete, there are mixed results in reactions to information about
competitors. Eriksson et al. (2009) finds that feedback on relative performance does not
significantly change performance. The study reports positive peer effects in tournaments;
1 The following discussion of existing literature focuses on studies that involve competition in a math-related task
4
frontrunners do not slack off and underdogs rarely quit, although continuous feedback reduces
the quality but not quantity of effort for underdogs. However, Gill and Prowse (2014) finds that
subjects reduce effort after a loss, although males reduce effort only after failing to win large
prizes. Buser (2016) shows somewhat different results depending on gender. Buser created three
groups based on random pairing in a first round winner-take-all tournament: winners, losers, and
those who receive scores, which he refers to as the no information group. Losers from the first
round seek harder challenges, are less successful in the challenges and overall make less money
in the second round compared to the winners. While there are no gender differences in average
outcomes, such as the challenge level selected or performance in the challenge, males react to
losing by becoming more challenge-seeking than winners and females react by lowering their
performance.
The findings in these previous studies are contingent on random or contrived information
about competitors to elicit a reaction from subjects. Although there is a range in the type of
information provided, from relative scores to more direct messages of winning or losing, the
explicit information acts as a treatment. The use of explicit information may contribute to results
in the previous studies-- a study shows that the possibility of receiving feedback induces subjects
to work harder even when they are not compensated for the extra effort, which demonstrates how
responsive subjects can be to explicit information (Kuhnen and Tymula, 2011).
I focus on the effect of competitor level on competition performance, a relatively less
understood aspect of gender differences in competition. I explore reactions to a subtler but
realistic scenario of the perception of competitor difficulty, since people often compete with
incomplete information about their competitors. For example, students may not know their
rankings in class prior to taking a test; even if these rankings are known from a prior test, they do
not perfectly transfer to another subject or even another test in the same subject. Despite this
uncertainty, students must perform on assignments or tests. Thus, it is important to explore how a
noisier yet realistic signal of competitor difficulty affects performance in competition. Although
the context is essentially a lab-in-field environment rather than an actual school competition, the
school setting allows students to compete against meaningful categories of competitors instead of
relying on artificial competitors created by researchers.
By closely following Buser et al.’s (2014) protocol used in secondary schools in the
5
context. Cultural context is demonstrated to play a role in gender differences in competition
(Gneezy et al., 2009), although not necessarily in expected ways (Cárdenas et al., 2012); thus, it
is important to acknowledge potential cultural influences on these differences. Nearly all of the
studies use university subject pools in Western countries. To the author’s knowledge, this is the
first such experiment performed in a Muslim country and one of few performed in Asia. While
this paper highlights several differences in the Science, Technology, Engineering & Math
(STEM) and gender context particular to Malaysia, the findings are suggestive of gender
stereotypes and differences in competition in STEM generally found in the literature.
The results of this study demonstrate that in a context where the standard gender
difference in competition entry exists, males appear to be affected by the level of competition
while females are not. When students face harder competitors, males respond by lowering
performance while the performance of females does not vary significantly by level of
competition. These somewhat surprising findings suggest that policies that require females to
enter into more difficult competitive situations may not be detrimental to their performance in
these situations.
The rest of the article proceeds as follows. Section 2 provides an overview of the study
details, including context, data collection procedures and study design. The results from the
study are detailed in Section 3. First, I provide descriptive analyses of the behavioral
characteristics and other control variables used in later analyses. Then, I provide the analyses of
the standard gender differences in competition (within class competitions). Lastly, I provide
analyses of the response to different levels of competition (between class competitions). Section
4 discusses the significance and potential mechanisms of these findings. Section 5 concludes.
2.
Study Overview
2.1Context
Gender differences in competition appear to exist at a young age (Eccles et al., 1993;
Gneezy and Rustichini, 2004; Harbaugh et al., 2002; Sutter and Glätzle-Rützler, 2014). These
early differences may affect the trajectories of individuals’ future decisions and outcomes. To
understand competition phenomena in a relevant setting, this study uses a sample of high school
6
This study takes place in public schools in Malaysia, a multicultural developing country
in Southeast Asia with a majority Muslim population. Malaysia is a useful context for this study
for several reasons. First, the informal but widespread ranking system within grades in public
schools provides a unique opportunity to exogenously vary the level of competitor within
classrooms, which will be discussed further in Section 2.2. Second, the STEM context in
Malaysia appears to favor females compared to the populations used in prior studies, although
standard male stereotypes of STEM seem to persist. Several studies view stereotypes associated
with tasks as potential explanations for gender differences in math task competitions (Dreber et
al., 2014; Kamas and Preston, 2010; Grosse and Riener, 2010; Günther et al., 2010; Shurchkov,
2012), thus any competitive differences found in the Malaysian context could help bring insight
into whether gender differences in competition are similar in an environment with greater female
STEM participation.
The Malaysian education system consists of six years of primary school and five years of
secondary school; during the last two years of secondary school, or upper secondary school2,
students are placed into academic tracks with different associated prestige: the arts track (less
prestigious) and the science track (more prestigious). Although there is no official tracking
policy prior to the last two years of secondary school, many secondary schools use unofficial
methods3 of ranking and sorting students into classrooms within grade levels. Enrollment in
preschool, primary school and secondary school is gender-balanced (49%-50% of enrollment is
female). However, there are differences in gender proportions in the upper secondary school
academic tracks. In upper secondary school, females constitute about half (47-49%) of the arts
stream and the majority (about 58-59%) of students in the science streams4. Thus, there are more
females than males in the most prestigious science track at the upper secondary level (Ministry
of Education Malaysia, 2014). A similar gender distribution is found in the lower secondary
Form 35 classes in this study, prior to the official academic tracking (see Section 2.2 for details).
The female advantage continues in tertiary education. Malaysia has a slightly lower ratio
than the U.S. of females to males in tertiary education, although in both countries, females make
2 Form 4 & 5 are known as upper secondary and are equivalent to grades 10 & 11. 3 For example, sorting students into classrooms based solely on overall test scores.
4 Science and arts streams are the two most common streams; some schools offer “sub-science” or “sub-arts” as
well.
7
up the majority of tertiary students (Malaysia: 1.21 to US: 1.36). However, nearly half of
Malaysian female students (46%) versus less than a third of U.S. female students (30%) major in
STEM fields (World Economic Forum, 2014). In fact, Malaysian females make up the majority
of entrants, enrollments and graduates in most fields of study in the public universities including
about two-thirds of graduates in Science, Mathematics and Computer; the only field in which
females are a minority is Engineering, Manufacturing and Construction (Ministry of Education
Malaysia, 2015). A qualitative study of the University of Malaya’s6 Computer Science and
Information Technology department reveals that the majority of faculty, heads of department and
dean were women in 2001 (Mellström, 2009). Mellström hypothesizes that computer science
professions may be considered more suitable for females because of the office rather than field
nature of the work; however, labor market data is limited such that it is not possible to identify
the percentages of women in these fields.
Thus, females in Malaysia appear to face a more positive STEM climate in education
than in many other countries. Nevertheless, gendered stereotypes for STEM and reading exist
(see Section 3.1). Furthermore, prevailing gender norms may discourage females from being too
“aggressive”, which could influence gender responses to competition (Curriculum Development
Division, 2016). These features demonstrate that multiple components of culture create a
complex atmosphere that may affect gender dynamics in competition.
2.2Data Collection
This experiment was conducted in public secondary schools in one school district in
Selangor, the largest and most urban state in Malaysia. I invited co-educational secondary
schools in this district to participate in this study, asking for one classroom period of time; five
schools agreed to participate. All schools in this study sort students into classes within grades by
prior achievement, a widespread practice in Malaysia, and have a minimum of five classes in
Form 37 to ensure sufficient variation in competition levels. Three to five classes from Form 3
were selected from each school to participate. The data collection was conducted over the span
of one month, from July-August 2015. For a given school, the experiments in different
classrooms8 were conducted during the same day and often at the same time. Not every
6Malaysia’s oldest and most prestigious public university.
7 9th grade equivalent; last year of lower secondary school and prior to academic track specializations.
8 The experiment for one classroom at one school was conducted about three weeks after the rest of the classrooms
8
classroom in Form 3 in a school participated, experiments were often conducted at the same time
within a school, and the bulk of the classroom experiments in the entire sample was conducted
within one week, so there is little reason to worry that students knew about the experiment and
strategized prior to participating. Students were paid two weeks after the experiment through
sealed envelopes; there was no fixed participation fee and the average payout was RM10.269,
with a minimum of RM0 and maximum of RM71.
Four of the five schools provided administrative information including student gender
and midterm grades (the most recent official grades). The study was conducted during regular
classroom instruction time in eighteen classrooms10. Each school engaged in some form of
classroom rankings such that the classrooms were ordered according to student achievement,
prior to official academic tracking practices at the end of Form 3. Students are well aware of this
ranking, similar to how students in other countries such as the U.S. are aware of being in
advanced or remedial classes. For example, in three of the five schools, classes are named in
alphabetical order from top to bottom class. The top class, bottom class, and one to three
middle-ranked classes in Form 3 of each school participated in this study. There were 562 secondary
school students in Form 3 who participated in this study, but one student was dropped because
there was no gender information available, leaving a sample of 561 students (290 males and 271
females). In the sample, females make up 40% of the bottom classes, 48% of the middle classes
and 54% of the top classes11. The analyses of the effect of facing a different level of competition
(i.e., easier or harder competition) are limited to the sample of middle classes (266 students),
which were oversampled for this purpose.
The schools in this study represent over a fifth of the 24 public co-educational secondary
schools12 in the district. Although they may not be representative of the country as a whole, the
schools appear to be similar on average to Malaysian public secondary schools. The average
classroom size in the schools in the sample is 35.28, similar to the national average lower
9 Currency was given in Malaysian Ringgit (MYR), which has a similar purchasing power to USD although the
exchange rate was roughly 4 MYR:1 USD in summer 2015.
10 One additional classroom was dropped due to technical problems.
11 Post hoc ANOVA comparisons using the Sidak (p=0.036), Bonferroni (p=0.036), Scheffe (p=0.043) and Tukey
(p=0.032) methods indicate that only the bottom and top classes have a statistically significant different proportion of females at the p<0.10 significance level.
12 Most students in Malaysia attend co-educational schools. Wiseman (2008) finds that 14.67% of schools (indexed
by 8th grade math classrooms) were sex-segregated, which was not statistically different from the international mean
9
secondary classroom size of 34 (Ministry of Education Malaysia, 2014). Females make up 48%
of the sample, similar to the national percentage of 50% (2015 data) in Form 3 (Ministry of
Education Malaysia, 2015).
2.3Study design
The objective of this experiment is to measure the rates of entering a competition when
competing against classroom peers, and in a subsequent round, to measure differences in
performance when forced to compete against students from another higher- or lower-ranked class
in the same grade and school.
The experiment has four rounds of tests with varying incentive structures followed by a
survey, similar to the design first used in Niederle and Vesterlund (2007). The test instrument for
each round was a five-minute math test with 40 double digit multiplication questions, which is a
slightly longer and more difficult task than the one used by Niederle and Vesterlund, in order to
enable more variance in scores due to an additional incentivized round in this study. This task
was designed to measure the level of effort, not mathematical knowledge or attitudes. None of
the questions repeat in the study and all numbers with zeroes were removed in order to keep the
level of difficulty comparable across each test. There were no penalties for incorrect answers.
Students were not allowed to use calculators but were given pieces of scratch paper to solve
problems on. Directions about the specific incentive system of the round’s test were read out
loud in Malay, the language of instruction, prior to each test. All documents were given in both
English and Malay. Students were told not to speak during the duration of the study, and had to
place their pens down and stand up when the end of each test was announced. Furthermore,
students were informed that only 1 out of the 4 rounds of tests would be compensated, randomly
chosen at the end of the session, in order to avoid hedging and to encourage each student to try
his/her best during each round. Thus, at the end of each session, a representative from the class
picked a ball numbered from 1-4 out of an opaque bag to choose which round was paid out for
that entire class.
Test 1 was scored according to a piece-rate incentive; for this test, students were paid
RM0.50 per each correct answer. Test 2 was scored according to a winner-take-all tournament
incentive (i.e. a competitive incentive). For this test, students were told they would be competing
10
obtained the highest score (i.e. first place), they received a payment of RM2 per each correct
answer, but if they did not obtain the highest score, they received nothing13.
Prior to Test 3, students were given the choice of how they wanted to be compensated for
the third test. Each student chose between one of the prior two incentive schemes, marked the
choice on a form, then inserted the form into an envelope. Students were informed prior to
decision-making that if they chose the winner-take-all tournament incentive, they would compete
against a new set of three randomly selected competitors’ scores from Test 2 so they could be
competing against any of their classmates, not just those who chose the tournament incentive
(see Niederle and Vesterlund, 2007). Test 3 proceeded after every student selected a choice and
put away the form in an envelope.
Prior to Test 4, students were given slips of paper that informed them which class they
would be competing against in the fourth test. Thus, in the fourth round of the study, students
were told they would be competing in a winner-take-all tournament, competing against three
randomly selected students from the other class, under the same incentive structure as Test 2 but
using only Test 4 scores. In each class, students were randomly assigned to one of two other
classes in their grade (e.g. bottom or top class if the student were in a middle class); classes were
referred to by their official school names with no explicit reference to positioning within the
grade level. However, as described earlier, students are well aware of the implicit differences
between classes.
After Test 4, students completed a survey which included incentivized questions on
levels of confidence and risk aversion, in addition to non-incentivized questions about their
attitudes, opinions and family background. Students never received information about their
scores during the experiment. Students could estimate how they had performed only after they
were given their payments, a couple weeks after the experiment had been completed.
3.
Results
3.1 Same-Class Competition Analyses
The following section presents results from the first three rounds of the study, which
replicates the design from Buser et al. (2014). First, I provide the descriptive results of the
11
performance, competition choice, behavioral and other individual characteristics of students. I
then present the regression results that confirm the gender gap in competition.
There is no gender gap in performance for this multiplication task, whether students are
under piece-rate or tournament incentive against their classroom peers. A table of descriptive
characteristics shows the performance and competition choice prior to Test 3, when all students
are under the same incentive structures (Table 1). Although it is not a focus of this paper, there is
evidence that the sorting mechanism into classrooms by student prior achievement resulted in
classes with overall differences in student performance, which is an important component of the
analyses of performance against other classes. The average number of questions correct for the
first test, under the piece-rate incentive, is 10.141 although this varies between 5.937 in the
bottom classes to 12.432 in the top classes. The average number of questions correct for the
second test, under the winner-takes-all tournament incentive, is significantly higher at 12.041,
ranging from 7.746 in the bottom classes to 14.444 in the top classes14. Overall, females appear
to outperform males on these first two tests, though these gender differences disappear when
taking into account the class level and corresponding differences in gender distribution across
class levels. Thus, it is established that there are no gender differences in performance under
either of the incentives for this task.
Furthermore, both genders increase performance under the competition incentive. The
different incentive structures between Test 1 and Test 2 affects both genders; the average number
of answers correct between Test 1 and Test 2 statistically significantly increases for both males
and females (Appendix A-1). This increase could indicate learning with successive tests
(discussed further in Section 3.2); however, a recent study finds that the order of piece-rate and
tournament rounds does not significantly affect the difference in performance under the two
incentives in a similar experiment (Wozniak et al., 2016). Therefore, we can interpret the
positive increase as the response to competition.
Unlike performance on the tests, there is a clear difference in the rates at which males and
females choose competition, both overall and at each class level. Overall, less than a third of
students (29.6%) choose competition for the incentive structure of Test 3. Females choose into
14 The numbers of correct answers for both Test 1 and Test 2 are different between all three class levels according to
12
competition at almost half the rate of males, with an average of 20.7% of females versus 37.9%
of males choosing competition, with the greatest difference in the top classes (18.5% of females
versus 46.8% of males).
The choice into competition for Test 3 does not appear to incentivize students to perform
better than those who did not choose into competition for Test 3. There is no difference in the
increase in number of correct answers from Test 2 to Test 3 for those who chose competition and
those who chose piece-rate (Table 2). This can indicate either insensitivity to the choice, or poor
measurement of effort (e.g. ceiling effects) on performance. Subsequent increased performance
on Test 4 discussed in Section 3.2 implies that students did not respond to choice, rather than the
task failing to measure changes in effort.
Other factors such as confidence, risk-aversion, academic performance, attitudes and
expectations towards math/science, and socio-economic status may be influential in students’
choice of competition. A summary of student behavioral and personal characteristics is shown in
Table 3 (Appendix A-2 for detail). There are several characteristics that differ by gender.
Males are more confident and over-confident than females in competitions against their
own class. Confidence is measured by two questions on the survey, similar to what is used in
Niederle and Vesterlund (2007). These questions ask what rank (1-first place to 4-last place)
students think they had achieved for the two forced competition rounds, Test 2 (against own
class) and Test 4 (against other class). Students received RM1 per correct answer for these
questions. Overconfidence is defined as the difference between actual rank15 and guessed rank,
with a range of -3 to 3. This measure provides the student’s level of confidence for the particular
task rather than a more generalized measure (e.g. soliciting student perceptions about class rank).
The average guessed rank of males against their own class is 2.441 versus 2.715 for females
(p=0.001); thus, males guessed that they obtained a better rank than females guessed. After
accounting for actual ranks, females are under-confident while males’ guessed ranks are closer to
their actual ranks (slightly under-confident against their own class and slightly over-confident
against another class).
15 Actual rank is constructed from 1000 simulations of random draws of 3 other students from the appropriate class
13
It appears that males are more accurate in their rankings, although both males and
females appear less confident about winning than other studies have found (e.g. Niederle and
Vesterlund, 2007). However, the male percentage is roughly in line with what was found in a
sample of similarly-aged students (Buser et al., 2014). About 21% of males and 9% of females
believe that they won the tournament in Test 2 (p<0.001), while 30% of males and 24% of
females actually win the tournament, with no significant difference.
Males are more risk-seeking than females according to both risk measures in this study.
Risk preference is measured in two ways on the survey. First, students answered an incentivized
question based on a modified question used by Eckel and Grossman (2002) that asked them to
choose between an option with 100% certainty (RM2) or one of four 50/50 lottery options based
on a flip of a coin at the end of the study: RM3 or RM1.50, RM4 or RM1, RM5 or RM0.50 or
RM6 or RM0. The coin was flipped in front of the classroom at the end of the study and the
individual’s choice was paid out with the rest of his/her earnings. Second, students answered a non-incentivized risk preference question taken from the 2004 wave of the German
Socio-Economic Panel Study following Dohmen and Falk (2011), who find that this question predicts
incentivized lottery choices. The question is: How do you see yourself: Are you generally a
person who is fully prepared to take risks or do you try to avoid taking risks? Check ONE box on
the scale, where the value 0 means: ‘unwilling to take risks’ and the value 10 means: ‘fully
prepared to take risks’. Males choose a more risky lottery option and also choose a higher level
of risk to describe themselves. In this sample, the correlation between these two measures is
0.243 overall, 0.208 for males and 0.230 for females (p<0.001 in both cases).
Females and males perform similarly on their school math midterm grades16; there is no
gender difference (Appendix A-3 for detail). However, there is a significant female advantage
for overall midterm grades: females have a 5 percentage point higher overall midterm grade than
males (57.436 versus 52.414, p=0.005). Despite this academic context, the student survey
responses show that male-favoring stereotypes exist for math and science and female-favoring
stereotypes exist for reading, similar to Western stereotypes (Appendix A-4 for detail).
Females and males have similar levels of enjoyment of math; 74.3% of males and 69.7%
of females agree or strongly agree that they like math (no significant difference) although a
14
higher percentage of males than females like science while a higher percentage of females than
males like reading (p=0.015, p<0.001 respectively). In addition, a higher percentage of males
believe they are good at math; almost half of males (47.2%) versus a little over a third of females
(36.8%) agree or strongly agree that they are good at math (p=0.014). A similar pattern follows
for science although it is reversed for reading; over three-quarters of females (77.2%) versus
two-thirds of males (67.5%) think they are good at reading (p=0.010).
The science and math fields are most prestigious; 71.4% of all students rate the Science
track as the best academic track in upper secondary school, with no statistically significant
gender differences. A marginally higher percentage of males than females think that they will
end up in the Science track in the next academic year, 47.6% versus 40.6% (p=0.097). On
average, students believe that boys are better at math and science while girls are better at
reading; males tend to rate boys as better in each of these subjects (Appendix A-4 for detail).
There do not appear to be gender differences in socioeconomic status (SES), using
parental education as a proxy. On average, 45.1% of students’ fathers and 36.7% of students’
mothers hold at least bachelor’s degrees (Appendix A-5).
Given that these variables may contribute to an individual’s decision to enter into
competition, it is important to control for these variables when determining whether there is a
gender difference in competitiveness; that is, choosing competition for Test 3. The measure of
competitiveness in this paper is similar to the measure first used in Niederle and Vesterlund
(2007). Student choice of whether to enter into competition or piece-rate compensation prior to
Test 3, controlling for other variables, is used as the measure of competitiveness (choosing
competition is used interchangeably with choosing the tournament incentive for Test 3).
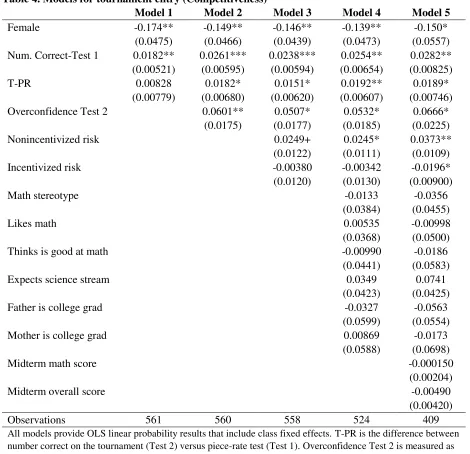
When controlling for only the score on the piece-rate test (Test 1) and the difference
between the tournament and piece-rate scores (Test 2-Test 1), females are 17.4 percentage points
less likely than males are to choose competition (Table 4, Model 1). When adding in the level of
overconfidence, the difference decreases to 14.9 percentage points, which is different from the
coefficient in Model 1 at the <0.001 level17 (Model 2). This difference remains largely stable
when adding in both measures of risk preferences (Model 3), and is not significantly different
17 Comparisons of the coefficient for female use seemingly unrelated estimations with clustered standard errors (not
exact standard errors from main analyses, since Stata’s suest command does not accept xtreg models). The
15
from Model 2.When student attitudes and SES are added, the gender gap is 13.9 percentage
points, although none of the coefficients for these characteristics appear to influence competition
entry (Model 4). Lastly, although one school did not provide midterm scores, the gender gap
remains when including math and overall midterm grades in addition to all the other covariates
(Model 5).
Similar results hold for the previous models when this school is excluded from the
analyses (Appendix A-6) or when session fixed effects are used instead of class fixed effects to
account for simultaneous experimental sessions (Appendix A-7). Thus, the gender gap is still
significant although the power from the reduced sample size is lower, and is very similar to the
gap found in a similar age sample of ninth-grade students in the Netherlands, 11.7 percentage
points (Buser et al., 2014).
Secondary students in Malaysia show the standard gender gap in choosing competition
that has been demonstrated in many different contexts. When only controlling for previous
performance, the gender gap is 17.4 percentage points. The gender gap is reduced a total of about
20% when controlling for confidence, risk preferences, student attitudes about math and
socioeconomic status, but females are still 13.9 percentage points less likely than males to
choose competition (p<0.05).
3.2 Other-Class Competition Analysis
The previous analysis confirms that the standard gender gap in choosing into math
competition exists for this sample of secondary school students. This section focuses on the
novel contribution of this paper: how students react to different levels of competition. I present
several descriptive findings of the difference in performance when facing different competitors. I
then present the experimental results in addition to exploring heterogeneity in these results and
whether changes in questions answered or accuracy led to these results.
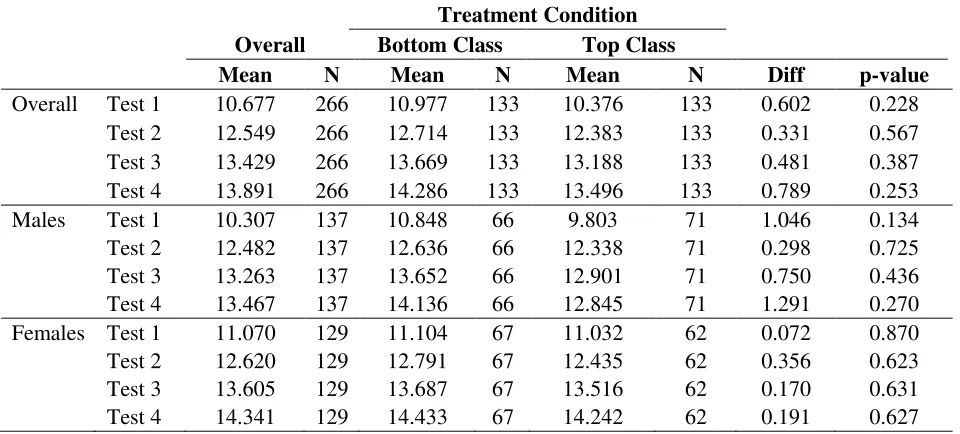
The sample for the following analyses is restricted to the middle-ranked (middle) classes
so that there are both easier (bottom class) and harder (top class) competitors. There are 266
students in 8 middle classes (137 male and 129 female), which represents a little less than half
the number of students in the original sample. As described in Section 2.3, students in the middle
classes were randomized to compete against either the top ranked class or the bottom ranked
16
not directly prime students to the level of their competitors. Students received a slip of paper
informing them which class their competitors would come from, and were told to put the slip of
paper in an envelope and not talk so that treatment assignments remained concealed.
As in the overall sample, there is a general upward trend in the number of correct answers
in successive tests, which suggests that learning18 could play a role in the observed scores (Table
5). This brings up concerns about whether the observed scores reflect learning or ability rather
than the effort put into the task. The randomization should alleviate these concerns for this last
round, unless learning or ability is not balanced within genders across treatment groups. The
randomization produced balanced groups competing against higher and lower competitors across
all observable baseline characteristics (gender, math midterm score and overall midterm score).
In addition, most student characteristics measured prior to treatment are balanced across groups,
including scores on Test 2, Test 3, the difference between Test 2 and Test 1, and the competition
choice. Treatment assignment predicts the score on Test 1 at the 10% significance level, although
there is no significant correlation between treatment and Test 1 score within gender (Appendix
A-8). The following analyses control for Test 1 score, difference between Test 1 and Test 2
score, and competition choice as robustness checks.
Although the upward trend in scores on successive tests is clear in the treatment against
the bottom class, it is less apparent for those who competed against the top class. However, the
incentives between the third and fourth test vary by student choice thus it is most relevant to
compare results from Test 4 against Test 2.
In the following analyses, the primary variable of interest is the difference between
performance in Test 2 and Test 4. Similar variables are constructed for the difference between
total number of questions answered and the difference in accuracy of answers, which are used to
explore the main results. Thus, a student’s performance against another class (Test 4) is
compared against performance against a student’s own class (Test 2). This within-subject design
18 A limitation of this study is the difficulty in separating out learning effects and response to incentives, given that
17
allows us to see the effect of a different level of competitor using each subject’s baseline value
(i.e. performance on Test 2). The average value of the difference in the number of correct
answers from Test 2 to Test 4 is 1.34 with a standard deviation of 2.90 and a range of -7 to 10.
As Figure 1 shows, there is no gender difference in the change in performance when the
competitors are from the bottom class. Both genders perform about 1.5 questions better.
However, when matched against competitors from the top class, females increase the number of
correct answers by significantly more than males, 1.806 correct answers compared to 0.521
correct answers (Appendix A-9, p=0.018).
Since treatment is randomized within class, the following equation can be used to
determine the effect of the treatment.
𝑦𝑖𝑗 = Γ𝑗+ 𝛽1𝑇𝑟𝑒𝑎𝑡𝑚𝑒𝑛𝑡𝑖𝑗 + 𝛽2𝐹𝑒𝑚𝑎𝑙𝑒𝑖𝑗+ 𝛽3(𝑇𝑟𝑒𝑎𝑡𝑚𝑒𝑛𝑡 ∗ 𝐹𝑒𝑚𝑎𝑙𝑒)𝑖𝑗+ 𝜃Χij+ 𝜖𝑖𝑗
where:
𝑦𝑖𝑗 is the difference in number of correct answers between other and own class (Test 4 - Test 2) for student i in class j
Γ𝑗 is the class fixed effects
Treatment is 1 if assigned to the top class and 0 if assigned to the bottom class for student i in class j
Female is 1 if female and 0 if male for student i in class j
Treatment * Female is 1 if student i in class j is assigned to the top class and is female; 0 otherwise. This represents the gender difference in the effect of treatment on the difference of
performance between other and own class
Χij is a vector of student attributes
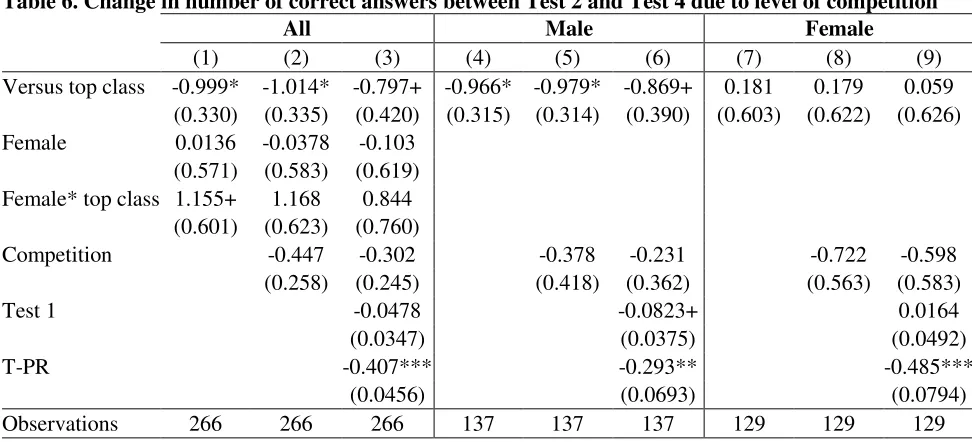
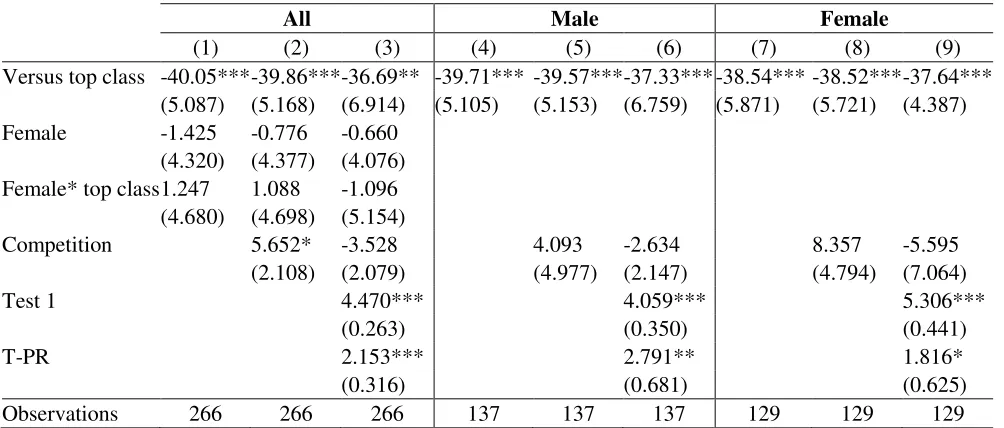
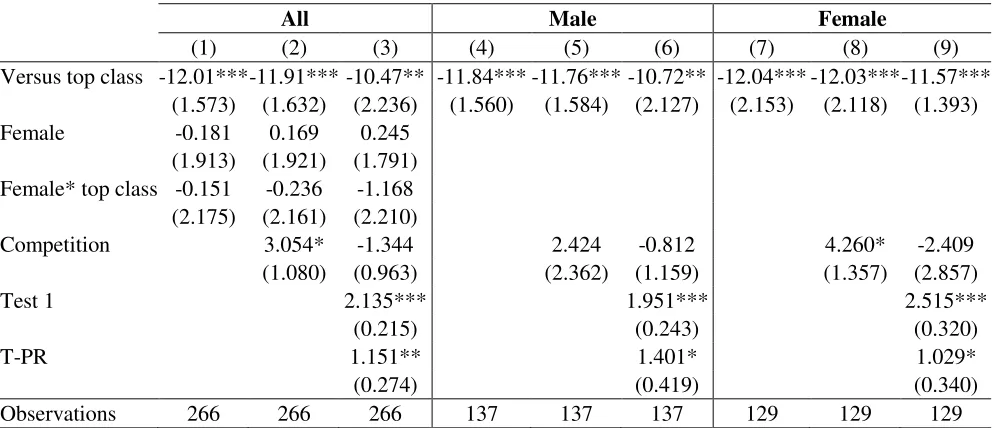
The regressions in Table 6 show the effects of competing against the top class
(competition against bottom class as reference group), relative to competing against own class.
Since the treatments were randomly assigned, the estimates of the effect of the treatment can be
directly interpreted. Baseline covariates are included in subsequent models, which lowers the
precision of the estimates (Columns 2-3). The regressions are also performed separately for
males (Columns 4-6) and females (Columns 7-9).
18
-0.999 (p<0.05) (Table 6, Column 1). However, the interaction effect of being female and facing
the top class is positive and similar in magnitude to this negative effect, 1.155 (p<0.10). When
adding in baseline variables including Test 1 performance, response to competition incentive
(difference in Test 1 and Test 2 performance), and competition choice, the pattern remains
similar; there is a stable negative main effect although precision decreases so that the female
interaction effect is not statistically significantly different from zero (Table 6, Column 3).
The gender difference in response to harder competition is clearer when examining the
regression results separately by gender (Table 6, Columns 4-9). The effect of facing the top class
instead of the bottom class is consistently negative and close to 1 question for males after
controlling for behavior and performance from prior rounds19, ranging from -0.966 to -0.869
(Table 6, Columns 4-6). On the other hand, females do not seem affected by facing the top class
as opposed to the bottom class; the effect is not statistically different from zero (Table 6,
Columns 7-9). These findings indicate that males are negatively affected by facing a difficult
competitor while females are not. Qualitatively similar results hold when the whole sample of
students is included and treatment is defined as competing against any higher class (Appendix
A-10), session fixed effects are used (Appendix A-11) or absolute score on Test 4 is used
controlling for Test 2 performance and other variables (Appendix A-12). Males perform worse
when competing against the top class rather than the bottom class, even after controlling for prior
performance and competitive behavior, while there is no evidence that females perform
differently according to the level of their competitors.
To explore these results, I examine heterogeneity in the sample in addition to whether the
effects are due to differential numbers of questions answered or a change in the accuracy of
answers.
An important characteristic of this sample is the variance in performance both within
schools (e.g. average scores in middle classes compared to top classes) and across schools. All
previous results include class fixed effects, which help capture this heterogeneity. However, it is
also instructive to view these results in a more easily comparable manner such as the chance of
winning against the top class. The chance of winning against the top class conditional on the
number of correct answers varies by school; for example, with 18 correct answers, a student in a
19 When the baseline variables are added in models 3, 6 and 9, the difference between Test 1 and Test 2 performance
19
middle class at School 4 has an 83% chance of winning, while a student in a middle class at
School 5 has a 9% chance of winning (Table 7). When the chances of winning are used as
controls instead of the numbers of answers correct, the effects of facing harder competition
remain negative for males and null for females (Appendix A-13).
These effects of facing more difficult competitors appear to differ along the distribution
of baseline performance by gender. For males, the difference between Test 2 and Test 4 score is
greatest at the best and worst quintiles of the baseline (Test 1) performance distribution (Figure
2). Males at the best and worst quintiles who face the top class perform about two questions
worse than males who face the bottom class. Females in the top two quintiles perform similarly
when facing either the top or bottom class, although females in the bottom two quintiles who
face the top class appear to perform a little better than those who face the bottom class. Overall,
it appears that males from the top and bottom of the performance distributions respond most to
the level of competition.
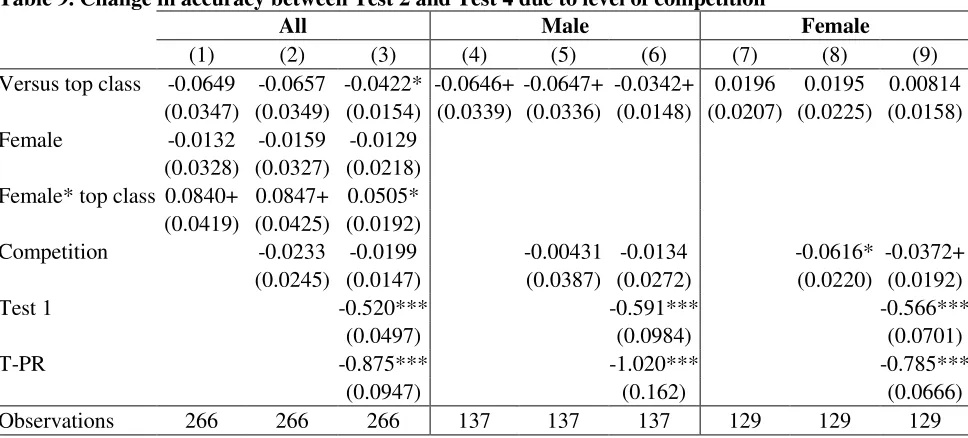
The change in performance from Test 2 to Test 4 could be due to a combination of the
quantity and accuracy of answered questions. For example, individuals can obtain a higher score
by answering more questions with the same (or lower) level of accuracy or by answering the
same number (or fewer) of questions with higher accuracy. It appears that competitor difficulty
has no effect on the number of questions answered; there is a negative effect for males that is not
significant after controlling for prior number of questions answered and competitive behavior
(Table 8). However, males but not females are less accurate when facing more difficult
competitors; the difference between females and males when facing harder competition is about
5 percentage points and significant at the 5% level (Table 9, column 3). After controlling for
prior accuracy and competitive behavior, the accuracy of males who face harder competitors is a
little over 3 percentage points (significant at the 10% level) less than the accuracy of males who
face easier competitors (Table 9, column 6). Thus, it appears that males change the quality
(accuracy) of performance rather than the quantity of effort against more difficult competition.
4
Discussion
This study shows the robustness of the gender gap in competition. Overall, females
choose into competition at about half the rate of males—20.7% versus 37.9%. After controlling
for student performance, confidence, risk preferences, and other student characteristics, females
20
This gender gap is very similar to what is found in the Netherlands with a similar age group and
experiment protocol, although the overall rates of competition are lower in Malaysia.
There is another gender gap that emerges when facing different levels of competitors.
The performance of females is not affected by facing harder competitors. However, males
perform almost one question worse when facing competitors from the top class (about one-third
of a standard deviation) than when competing against the bottom class. It appears that accuracy
decreases for males when facing the top class compared to the bottom class. There may be
several explanations for the gender difference in performance against harder competitors, such as
the gender composition of groups, differential expectations when facing different classes or
changes in the chance of winning or expected earnings.
One possible explanation for these results may be the gender composition of the
competitor groups. Existing research indicates that the gender composition of competitors can
affect performance in competitions (Booth and Nolen, 2012; De Paola et al., 2015; Gneezy et al.,
2003; Kuhnen and Tymula, 2011). Thus, the perceived gender composition of the competitors
could also play a role in these results. As noted in Section 2.2, there is a higher proportion of
females in the top classes than in the middle or bottom classes, although the difference is not
statistically significant between the top and middle classes, which is the relevant comparison in
these analyses. The range in female composition of the top class across the five schools in the
study is reasonably small, from 48.48% to 60.71%. These factors make it unlikely that the
female composition of the top classes affected results.
These results could also be explained by different expectations between genders when
competing against harder or easier competition, and a corresponding differential change in effort.
For example, Kuhnen and Tymula (2011) use gender composition of the group as a proxy for
perceived difficulty of competitor and find that females have lower output, worse expected rank
and worse actual rank with more males in their group while males are not affected by the gender
composition of the group. However, gender composition of the group may be an inappropriate
proxy for perceived difficulty of competitors. It is worth noting that they observe that males
expect better rankings than females (similar to this study) yet males also outperform females
(different from this study).
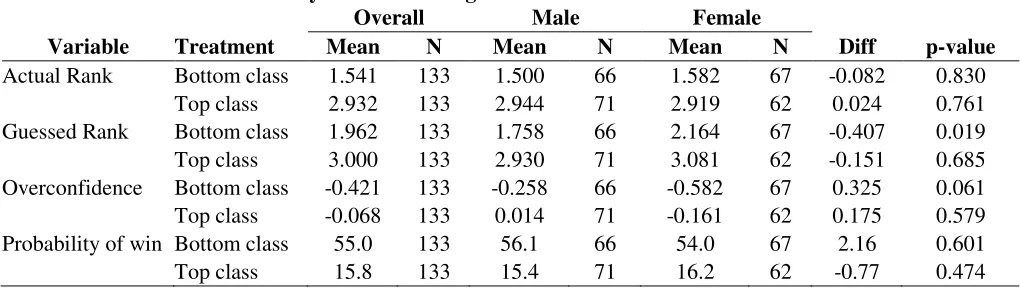
I use a similar task but more clearly designated groups of easier or harder competitors
21
gender differences in the actual rankings in either treatment condition, although both genders
guess a better rank when competing against the bottom class (Table 10). These rankings also
confirm that the difficulty levels of competitors are appropriately categorized; students in the
sample have a 55% chance of winning the tournament against the bottom class and a 16% chance
of winning against the top class, with no gender difference. However, males guess they are a
better rank than females do and are more overconfident when facing the bottom class (p-values
0.019 and 0.061, respectively). There are no gender differences in guessed rank or
overconfidence when facing the top class, although males are slightly overconfident and females
are under-confident. Since baseline measures of confidence against different classes were not
elicited in this study in order to prevent priming, it is not possible to distinguish whether the
treatment of facing more difficult competition changed male and female priors about their
performance differentially. Nevertheless, these ex-post elicited measures of confidence could
indicate a possible mechanism difference between genders; that is, males may lower
performance because they expect to do worse against harder competition (on par with females’
confidence), relative to their confidence against easier competition (more confident than
females).
Finally, there is a negative effect on the chance of winning (Table 11) and expected
earnings (Table 12) when facing harder competition for both females and males. The relatively
lower performance of males when facing harder competition does not appear to result in a lower
chance of winning or decreased expected earnings for males. Thus, the lower performance of
males may reflect greater efficiency (i.e. lower performance for the same financial outcomes).
The gender difference in performance under more difficult competition is somewhat
surprising, given findings from previous literature which generally show an equal response if not
female disadvantage when encountering difficult competition. For example, Eriksson et al.
(2009) finds that relative information does not affect performance, Gill and Prowse (2014) finds
that both genders lower performance after a loss and Buser (2016) finds that females lower their
performance after a loss but males do not.
However, this study design does not depend on explicit information, as previous studies
have used, but a more realistic yet less certain competitive situation. The experiment exploited
pre-existing differences in levels of competitors without an explicit message about relative
22
males may have lowered expectations when facing harder competition, although the gender gap
in the effect of facing harder competition on performance does not appear to extend to a gender
difference in the chance of winning or expected earnings.
5
Conclusion
This paper presents experimental evidence that females and males have different
reactions to more difficult competitors—males lower their performance while females’
performance does not change. In addition, it appears that standard gender differences in
competitive behavior apply even within a STEM context with more female participation. Given
the similar gender gaps in competition choice, it is reasonable to believe that the new findings
about reacting to harder competition apply in broader contexts.
The results from this study confirm the gender gap in choosing into competition in a math
task similar to those that have been linked to future educational choices. Although several
previous studies have found that females perform worse than males in competition, the current
study adds to the body of literature that finds no gender difference in competitive performance.
Furthermore, the within-subject study design shows a gender difference in the response to harder
or easier competition.
These findings have implications for policies designed to attract females into more
competitive environments. Existing research clearly indicates that, when given a choice, females
choose into competition less than males do. There are many situations in which people face
competition choices, such as which courses to take in school or which jobs to apply for. Early
decisions could have lasting consequences; for example, there may be prerequisite courses for
certain majors which are required to pursue certain occupations (e.g. advanced math/science
courses required for engineering degrees to become an engineer). If females differentially
decline to enter into competition early, gender gaps may widen over time as fewer opportunities
remain open.
However, it appears that females may not be negatively affected by the level of
competition once they are in a more competitive situation. Thus, if females do not perform worse
in more competitive environments even when they do not choose into these environments,
perhaps policies can be designed to compel people into more difficult competitive environments.
23
mandatory leadership programs, which would require females who may not otherwise choose
those programs to participate in them. Then, they may thrive in the more competitive
environment. On the other hand, it is important to ensure that males do not perform worse in
these more demanding situations where there could be negative outcomes from lowered
performance. The results of this study are found in a sample of students in middle-ranked classes
with no gender differences in performance, thus these proposed policies may not apply among
high or low performance individuals or when gender differences in performance exist. These
policies also do not address other barriers such as chilly climates that females face in competitive
environments.
Future research could look at the generalizability of and possible mechanisms underlying
the results. This study was conducted among secondary students in middle-ranked classes in an
Asian country; it would be illuminating to see whether the results hold among different ages,
performance levels or cultural contexts. In addition to addressing generalizability, future studies
can examine more deeply the potential mechanisms for these results, such as a differential
change in expectations when facing different levels of competition. Other possibilities from the
psychology literature could be differences in persistence or grit; for example, females may be
grittier than males in learning environments. Thus, even if females would not choose more
competitive environments, they could persist and succeed in them. Understanding these
mechanisms could help design policies that could result in greater participation and performance
24
References
Almås, I., Cappelen, A. W., Salvanes, K. G., Sørensen, E. Ø., & Tungodden, B. (2016). What Explains the Gender Gap in College Track Dropout? Experimental and Administrative Evidence. American Economic Review, 106(5), 296–302.
Azmat, G., & Iriberri, N. (2010). The importance of relative performance feedback information: Evidence from a natural experiment using high school students. Journal of Public
Economics, 94(7–8), 435–452.
Booth, A., & Nolen, P. (2012). Choosing to compete: How different are girls and boys? Journal of Economic Behavior & Organization, 81(2), 542–555.
Buser, T. (2016). The Impact of Losing in a Competition on the Willingness to Seek Further Challenges. Management Science, 62(12), 3439–3449.
Buser, T., Niederle, M., & Oosterbeek, H. (2014). Gender, Competitiveness, and Career Choices.
The Quarterly Journal of Economics, 129(3), 1409–1447.
Buser, T., Peter, N., & Wolter, S. C. (2017). Gender, Competitiveness, and Study Choices in High School: Evidence from Switzerland. American Economic Review, 107(5), 125–130.
Cárdenas, J.-C., Dreber, A., von Essen, E., & Ranehill, E. (2012). Gender differences in
competitiveness and risk taking: Comparing children in Colombia and Sweden. Journal of Economic Behavior & Organization, 83(1), 11–23.
Cason, T. N., Masters, W. A., & Sheremeta, R. M. (2010). Entry into winner-take-all and proportional-prize contests: An experimental study. Journal of Public Economics, 94(9– 10), 604–611.
Cotton, C., McIntyre, F., & Price, J. (2013). Gender differences in repeated competition: Evidence from school math contests. Journal of Economic Behavior & Organization,
86(C), 52–66.
Curriculum Development Division, Ministry of Education Malaysia. 2016. Sharing Malaysian Experience in Participation of Girls in STEM Education. Geneva, Switzerland, UNESCO International Bureau of Education (IBE).
Datta Gupta, N., Poulsen, A., & Villeval, M. C. (2013). Gender Matching and Competitiveness: Experimental Evidence. Economic Inquiry, 51(1), 816–835.
De Paola, M., Gioia, F., & Scoppa, V. (2015). Are females scared of competing with males? Results from a field experiment. Economics of Education Review, 48(C), 117–128.
25
Dreber, A., Essen, E., & Ranehill, E. (2014). Gender and competition in adolescence: task matters. Experimental Economics, 17(1), 154–172.
Eccles, J., Wigfield, A., Harold, R. D., & Blumenfeld, P. (1993). Age and gender differences in
children’s self-and task perceptions during elementary school. Child Development, 64(3), 830–847.
Eckel, C. C., & Grossman, P. J. (2002). Sex Differences and Statistical Stereotyping in Attitudes Toward Financial Risk. Evolution and Human Behavior, 23(4), 281–295.
Eriksson, T., Poulsen, A., & Villeval, M. C. (2009). Feedback and incentives: Experimental evidence. Labour Economics, 16(6), 679–688.
Ertac, S., & Szentes, B. (2011). The Effect of Information on Gender Differences in
Competitiveness: Experimental Evidence (Koç University-TUSIAD Economic Research Forum Working Paper No. 1104). Koc University-TUSIAD Economic Research Forum.
Gill, D., & Prowse, V. (2014). Gender differences and dynamics in competition: The role of luck. Quantitative Economics, 5(2), 351–376.
Gneezy, U., Leonard, K. L., & List, J. A. (2009). Gender Differences in Competition: Evidence From a Matrilineal and a Patriarchal Society. Econometrica, 77(5), 1637–1664.
Gneezy, U., Niederle, M., & Rustichini, A. (2003). Performance in Competitive Environments: Gender Differences. The Quarterly Journal of Economics, 118(3), 1049–1074.
Gneezy, U., & Rustichini, A. (2004). Gender and Competition at a Young Age. American Economic Review, 94(2), 377–381.
Grosse, N. D., & Riener, G. (2010). Explaining Gender Differences in Competitiveness: Gender- Task Stereotypes (Jena Economic Research Paper No. 2010-017). Friedrich-Schiller- University Jena, Max-Planck-Institute of Economics.
Günther, C., Ekinci, N. A., Schwieren, C., & Strobel, M. (2010). Women can’t jump?--An experiment on competitive attitudes and stereotype threat. Journal of Economic Behavior & Organization, 75(3), 395–401.
Harbaugh, W., Krause, K., & Vesterlund, L. (2002). Risk Attitudes of Children and Adults: Choices Over Small and Large Probability Gains and Losses. Experimental Economics, 5(1), 53–84.
Kamas, L., & Preston, A. (2010). Are Women Really Less Competitive Than Men? Working Paper, Santa Clara University.
26
Mellström, U. (2009). The Intersection of Gender, Race and Cultural Boundaries, or Why is Computer Science in Malaysia Dominated by Women? Social Studies of Science, 39(6), 885–907.
Ministry of Education Malaysia. (2014). Quick Facts 2014. Retrieved 19 February 2016 from http://www.moe.gov.my/cms/upload_files/publicationfile/2014/pubfile_file_002100.pdf
Ministry of Education Malaysia. (2015). Quick Facts 2015. Retrieved 19 February 2016 from http://www.moe.gov.my/cms/upload_files/publicationfile/2015/pubfile_file_002101.pdf
Niederle, M. (2016). Gender. In J. Kagel & A. E. Roth (Eds.), Handbook of Experimental Economics (2nd ed., pp. 481–553). Princeton University Press.
Niederle, M., Segal, C., & Vesterlund, L. (2013). How costly is diversity? Affirmative action in light of gender differences in competitiveness. Management Science, 59(1), 1–16.
Niederle, M., & Vesterlund, L. (2007). Do Women Shy Away from Competition? Do Men Compete Too Much? The Quarterly Journal of Economics, 122(3), 1067–1101.
Niederle, M., & Vesterlund, L. (2011). Gender and Competition. Annual Review in Economics,
3, 601–630.
Niederle, M., & Yestrumskas, A. H. (2008). Gender Differences in Seeking Challenges: The Role of Institutions (Working Paper No. 13922). National Bureau of Economic Research. Retrieved from http://www.nber.org/papers/w13922
Ors, E., Palomino, F. & Peyrache, E. (2013). Performance Gender Gap: Does Competition Matter? Journal of Labor Economics, 31(3), 443–499.
Shurchkov, O. (2012). Under Pressure: Gender Differences in Output Quality and Quantity Under Competition and Time Constraints. Journal of the European Economic Association, 10(5), 1189–1213.
Sutter, M., & Glätzle-Rützler, D. (2014). Gender Differences in the Willingness to Compete Emerge Early in Life and Persist. Management Science, 61(10), 2339–23354.
Wiseman, A. W. (2008). A culture of (in) equality?: A cross-national study of gender parity and gender segregation in national school systems. Research in Comparative and
International Education, 3(2), 179–201.
World Economic Forum. (2014). The Global Gender Gap Report 2014. Retrieved from http://reports.weforum.org/global-gender-gap-report-2014/
27
Feedback Alter Gender Differences in Competitive Choices. Journal of Labor Economics, 32(1), 161 – 198.
Wozniak, D., Harbaugh, W. T., & Mayr, U. (2016). The Effect of Feedback on Gender Differences in Competitive Choices. (SSRN Scholarly Paper No. ID 1976073).
28
Table 1. Descriptive statistics of number of correct answers and competition choice, by class level
Variable Class level Overall Male Female Diff p-value
Test 1 (Piece-Rate) Overall 10.141 9.693 10.620 -0.927 0.040
Bottom 5.937 5.908 5.980 -0.072 0.948
Middle 10.677 10.307 11.070 -0.763 0.173
Top 12.432 12.338 12.511 -0.173 0.847
Test 2 (Tournament) Overall 12.041 11.710 12.395 -0.684 0.082
Bottom 7.746 7.789 7.680 0.109 0.785
Middle 12.549 12.482 12.620 -0.138 0.650
Top 14.444 14.208 14.641 -0.434 0.354
T-PR Overall 1.898 2.014 1.770 0.239 0.591
Bottom 1.810 1.882 1.700 0.182 0.469
Middle 1.872 2.175 1.550 0.625 0.208
Top 2.006 1.857 2.13 -0.273 0.365
Competition choice Overall 0.296 0.379 0.207 0.173 <0.001
Bottom 0.325 0.395 0.220 0.175 0.041
Middle 0.271 0.321 0.217 0.104 0.057
Top 0.314 0.468 0.185 0.283 <0.001
Number of observations are from the whole sample: 561 overall, with 290 males and 271 females overall. The gender breakdown is: 76 males and 50 females in the bottom classes; 137 males and 129 females in the middle classes; 77 males and 92 females in the top classes. T-PR is the difference between number correct on the tournament (Test 2) versus piece-rate test (Test 1). Competition choice is the proportion that chose the tournament rather than the piece-rate incentive. P-values are from Mann-Whitney U tests.
Table 2. Change in number of correct answers between Test 2 and Test 3
Overall Chose
Piece-rate
Chose
Competition
Mean N Mean N Mean N Diff p-value
Overall 0.720 561 0.681 395 0.813 166 -0.132 0.518
Male 0.638 290 0.600 180 0.700 110 -0.100 0.771
Female 0.808 271 0.749 215 1.036 56 -0.287 0.385
[image:29.612.86.485.498.583.2]