http://www.scirp.org/journal/abb ISSN Online: 2156-8502
ISSN Print: 2156-8456
DOI: 10.4236/abb.2017.810025 Oct. 13, 2017 343 Advances in Bioscience and Biotechnology
Optimization Techniques and Development of
Neural Models Applied in Biosurfactant
Production by
Bacillus subtilis
Using
Alternative Substrates
Juliana Ferrari Ferreira Secato
1*, Brunno Ferreira dos Santos
2,
Alexandre Nunes Ponezi
3, Elias Basile Tambourgi
11School of Chemical Engineering (FEQ), Department of Chemical Systems Engineering (DESQ), University of Campinas,
Campinas, Brazil
2Department of Chemical and Materials Engineering (DEQM), Pontifical Catholic University of Rio de Janeiro,
Rio de Janeiro, Brazil
3Research Center for Chemistry, Biology and Agriculture (CPQBA), University of Campinas,
Campinas, Brazil
Abstract
Bacillus subtilis was investigated as production of biosurfactant using a combination based on waste of candy industry and glycerol from biodiesel production process as only substrate. The experimental design chosen for optimization by response surface methodology was a central composite ro-tatable design (CCRD) and dry weight (DW) and crude biosurfactant (CB) concentrations were selected as responses in analysis. Two techniques were implemented response surface methodology (RSM) and artificial neural network (ANN). First challenge of study was to assess the effects of the in-teractions between variables and reach optimum values. With the CCRD results, RSM and ANN models were developed, optimizing the production of biosurfactant. The correlation coefficients (R2) of RSM models explained 88% for DW and 73% for CB of the interactions among substrate concentra-tions, while ANN models explained 99% for DW and 98% for CB, demon-strating that developed ANN models were more accurate and consistent in predicting optimized conditions than RSM model. The maximum DW and CB produced in the optimum conditions were 25.60 ± 5.0 g/L and 668 ± 40 mg/L, respectively. The crude biosurfactant also showed applications in ces of oil spreading in water due to clear zone produced in Petri dishces as-says.
How to cite this paper: Secato, J.F.F., dos Santos, B.F., Ponezi, A.N. and Tambourgi, E.B. (2017) Optimization Techniques and Development of Neural Models Applied in Biosurfactant Production by Bacillus subtilis Using Alternative Substrates. Advances in Bioscience and Biotechnology, 8, 343-360. https://doi.org/10.4236/abb.2017.810025
Received: August 22, 2017 Accepted: October 10, 2017 Published: October 13, 2017
Copyright © 2017 by authors and Scientific Research Publishing Inc. This work is licensed under the Creative Commons Attribution International License (CC BY 4.0).
DOI: 10.4236/abb.2017.810025 344 Advances in Bioscience and Biotechnology
Keywords
Biosurfactant, Bacillus subtilis, Response Surface Methodology, Artificial Neural Network, Oil Spreading, Waste Management
1. Introduction
Biosurfactants are amphiphilic compounds produced mainly by aerobic micro-organisms, such as bacteria, yeasts and filamentous fungi [1], with wide use in detergents, laundry formulations, household cleaning products, cosmetics, her-bicides, or pesticides, besides in food, pharmaceutical, textile, paper and petro-leum industries, among others [2] [3]. Bacillus species produce a broad spectrum of lipopeptide biosurfactants. Among them, surfactin, a lipoheptapeptide pro-duced by Bacillus subtilis strains, is one of the most effective biosurfactants known [4].
Biosurfactants were becoming the focus of extensive researches and applica-tions [5], because it present many advantages, such as high environmental com-patibility, biodegradability and produced from renewable raw materials, besides, they have specific activity at extreme temperature, pH, salinity, and the ability to synthesize them from renewable food stocks [1] [6]. These advantages have made the biosurfactants focus of many research and industrial applications [7].
The use of biosurfactant is not widely encouraged yet, because of the cost in-volved in production and purification [8] [9] [10]. The biotechnological processes underlying microbial surfactants production should be based on the supplementation in culture broth with cheap substrates, such as waste or by-products from the agro-industry, making commercialization possible [10] [11]. Thus, in order to reduce the production costs, biosurfactant produced by Bacil-lus strains has been studied using different substrates, such as molasses [12], ca-shew apple juice [13], residual glycerol [14], residue from processing of pineap-ple [15] or agro-industrial by-product corn steep liquor [4]. However, although several kinds of agro-industrial waste have been evaluated as substrates for the biosurfactants production, the waste from candy industry was not evaluated yet.
DOI: 10.4236/abb.2017.810025 345 Advances in Bioscience and Biotechnology lower production costs, since it is not necessary to heat treatment process. Therefore, it is very interesting from an economic point of view and environ-mental preservation to use the industrial waste bullets for biosurfactant production.
Response surface methodology (RSM) is a classical method to develop models through regression coefficients and its significance is established due to analysis of variance. This statistical approach is largely implemented as seen [16] [17] [18]. RSM is a modeling taken into account relationship between factors in ex-perimental domain described by least squares. This implies, in most of cases, in sensitive models to variation in experimental errors, estimating no well experi-mental data, appropriately. Alternatively, artificial neural network can be used to improve the predictions of steady behavior and have several advantages over sta-tistical methods. ANN has been successfully, comparing with stasta-tistical model, implemented in modeling optimization process, such as [19] [20] [21] [22].
In this context, this study aims to identify maximum biosurfactant production through fermentation by Bacillus subtilis using alternative substrates, i.e., glyce-rol from biodiesel production process combined with waste from candy indus-try. The waste concentrations interactions were assessed by experimental design strategies. RSM and ANN analysis of optimum points were carried out and models were developed to predict dry weight and crude biosurfactant concentra-tions. The crude biosurfactant produced was used in oil spreading to reveal ap-plications on remediation.
2. Material and Methods
2.1. Inoculum Preparation and Standardization
Bacillus subtilis CBMAI 369 (ATCC) was obtained from the Brazilian Collection of Environmental and Industrial Microorganisms at Research Center for Che-mistry, Biology and Agriculture-CPQBA/State University of Campinas, São Paulo, Brazil. The culture was maintained in Nutrient Broth (Difco) and initially a pre-inoculum was prepared in 15 mL Nutrient Broth in 50 mL Erlenmeyer flask, and incubation in an orbital shaker for 6 h at 37˚C and 100 rpm. Then, the inoculum (100 mL of sterile nutrient broth in a 250-mL Erlenmeyer flask) re-ceived the pre-inoculum culture (10 mL) and it was incubated for 16 h at same conditions.
2.2. Biomass and Crude Biosurfactant Production
At the end of the assays, a sample of 30 mL from the culture broth was centri-fuged (10,000 rpm, 10 min, 4˚C). The biomass obtained was dried at 50˚C for 24 h and the weight evaluated.
DOI: 10.4236/abb.2017.810025 346 Advances in Bioscience and Biotechnology
2.3. Application of Crude Biosurfactant in Oil Spreading
According to described by [16] oil spreading was evaluated by adding 20 mL dis-tilled water on a Petri dish followed by addition of 50 µL of oil to its surface. Then, 40 µL of cell-free culture broth was dropped on the crude oil surface and the diameter of clear zone produced on the oil surface was assessed and com-pared to a negative control (culture medium).
2.4. Response Surface Methodology (RSM)
The biosurfactant production was investigated using the following waste sub-strates: waste of candy industry (X1) and glycerol from biodiesel production (X2). An experimental design tool was used in order to find optimal conditions for the biosurfactant production. All designs were developed and analyzed by
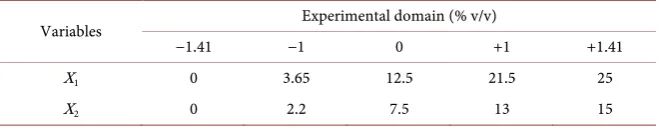
STATISTICA 7 software based on Shapiro-Wilk, Kolmogorov-Smirnov, p-value and analysis of variance. The desired response was the dry weight (g/L) and crude biosurfactant (mg/L). To evaluate the combined effect of two different medium components, a central composite rotatable design of 22 plus 3 center points plus 4 axial points totaling 11 runs, according to Table 1.
The experiments were performed 100 mL fermentation medium in 250 mL Erlenmeyer flasks in an orbital shaker, at 100 rpm, 37˚C, for 96 h. The values of the dependent response (dry weight and crude biosurfactant) were the mean of two replications.
2.5. RSM Models
A second-order polynomial regression (Equation (1)) was used in this study for the estimation of all main and joint effects while central and axial points were for providing replication and curvature terms in the model.
2 0 j j j i j ij i j j jj j
y=β +
∑
β x +∑
< β x x +∑
β x +e (1)where x1 and x2 are the input variables which are known to affect the re-sponse y and β0, βj, βij, βjj, are the relevant constants of the effects.
Analysis of variance (ANOVA) was evaluated to validate the RSM model. The ANOVA tables were built from the second-order polynomial coefficients and a probability value of <0.1 was used as criterion for statistical significance.
2.6. Modeling with Artificial Neural Network (ANN)
[image:4.595.210.541.662.729.2]ANN was used to obtain the relationship between media components (X1 and X2) and dependent variables (dry weight and crude biosurfactant) through
Table 1. Values used in central composite rotatable design (CCRD).
Variables Experimental domain (% v/v)
−1.41 −1 0 +1 +1.41
X1 0 3.65 12.5 21.5 25
DOI: 10.4236/abb.2017.810025 347 Advances in Bioscience and Biotechnology steady model. The experimental data were divided into three sets: training (60%), test (20%) and validation (20%) to avoid over-parameterization. The val-ues of input and output data were normalized between −1 and 1 to avoid any numerical overflow. The hyperbolic, logistic and linear functions were used as activation functions in hidden and output layers.
When a network is able to perform as well on validation set inputs as on set training set inputs, the goal was reached. The training by ANN consists to better adjusting weights to minimize the error between the observed and predicted outputs. The training process was done by specific algorithms, such as: trainlm that updates weight and bias according to Levenberg-Marquardt optimization; traingdx that updates weight and bias values according to gradient descent mo-mentum and an adaptive learning rate; trainbr that updates the weight and bias values according Levenberg-Marquardt optimization and minimizes a combina-tions of squared errors and weights, the process is called Bayesian regularization; traincgb that updates weight and bias values according to conjugate gradient backpropagation with Powell-Beale restarts; and trainoss that updates weight and bias values according to the one-step secant method.
The number of neurons in the hidden layer was defined based on amount of neurons in input layer without variation to avoid increasing the number of ef-fective parameters.
The performance of models was evaluated by coefficient of determination (R2) and the analysis of statistical indices curves were through mean squared error (MSE) defined according to Equation (2):
(
)
21
1 N
i i
i
MSE t a
N =
=
∑
− (2)where N represents the total number of patterns in corresponding set (training),
i
t represents the ith neural network target (observed data) and ai represents
the ith neural network response (predicted data).
3. Results and Discussion
3.1. Biosurfactant Production Investigation
DOI: 10.4236/abb.2017.810025 348 Advances in Bioscience and Biotechnology
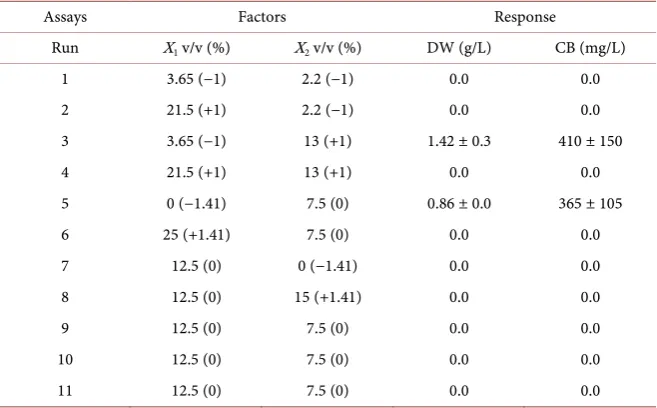
Table 2. CCRD combinations of factors and the response variables.
Assays Factors Response
Run X1 v/v (%) X2 v/v (%) DW (g/L) CB (mg/L)
1 3.65 (−1) 2.2 (−1) 0.0 0.0
2 21.5 (+1) 2.2 (−1) 0.0 0.0
3 3.65 (−1) 13 (+1) 1.42 ± 0.3 410 ± 150
4 21.5 (+1) 13 (+1) 0.0 0.0
5 0 (−1.41) 7.5 (0) 0.86 ± 0.0 365 ± 105
6 25 (+1.41) 7.5 (0) 0.0 0.0
7 12.5 (0) 0 (−1.41) 0.0 0.0
8 12.5 (0) 15 (+1.41) 0.0 0.0
9 12.5 (0) 7.5 (0) 0.0 0.0
10 12.5 (0) 7.5 (0) 0.0 0.0
11 12.5 (0) 7.5 (0) 0.0 0.0
The results of the table indicated there was biosurfactant production in the conditions 3 and 5. It is suggested the composition of culture broth affected the growth microbial by presence of any element in combined assays. When the waste of candy industry concentration increased, the results showed responses zero, indicating that the excess of the glucose concentration affected negatively the biosurfactant production. [23] examined different concentrations of glucose and concluded that 40 g/L was the best concentration and with higher glucose concentrations, biosurfactants production was significantly decreased.
The assay 5 was the only with absence of waste of candy industry that pro-duced biosurfactant. This, probably, is due to glycerol (from biodiesel propro-duced by soybean oil) used as carbon and mineral (calcium, phosphorus, magnesium and sodium) sources.
The waste of candy negatively affects the biosurfactant production (Table 2) for the two studied variables. The negative influence may be explained by over glucose concentration (in waste of candy) present in the culture broth, which in-hibited the microorganism growth. [24] confirmed the enhancing glucose con-centration negatively affects biosurfactant production. On other hand, raw gly-cerol demonstrated positive effects for dry weight and crude biosurfactant, which indicate enhancing its concentration. The interactions between the va-riables (1Lby2L) in the two responses have positive effect, proving that the com-bination of them is important, waste of candy to lowest level (−1.41 to −1) while raw glycerol to highest level (+1 to +1.41), reaching the best responses.
Based on these results, the matrix was evaluated, enabling the calculation of regression coefficient with p-value limit 0.10. The behavior of dry weight and crude biosurfactant was assessed, for practical purposes, two models were ad-justed through re-parameterization, to make it as simple as possible, with the fewest possible parameters, without losing its accuracy (Equations (3) and (4)):
(
)
21 1 2 1 2
DOI: 10.4236/abb.2017.810025 349 Advances in Bioscience and Biotechnology
(
)
2
1 1 2 1 2
Crude biosurfactant mg L
2.5 115.93X 93.72X 51.40X 102.50X X
= − + + − (4)
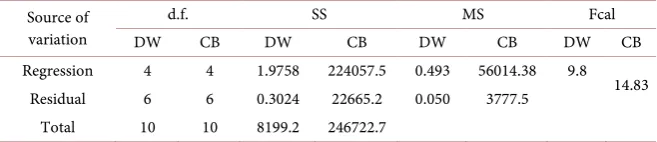
The analysis of variance (ANOVA) was performed to ensure confidence of the generated model to dry weigh and crude biosurfactant (Table 3).
ANOVA shows that the model is valid and highly significant, as is evident from the fisher F test, explaining 86.72% for dry weigh and 90.81% for crude biosurfactant of the behavior of the variables and Fcal is three and almost five times larger than Ftab, respectively. The models were acceptable and similar to the model developed in this study.
The graph of the response surface represented the optimization domain of the statistical model. The Figure 1 shows the graph of the response surface, devel-oped in this study, for the dry weight and crude biosurfactant, besides graph of the contour curves.
(a)
[image:7.595.211.537.285.562.2](b)
Figure 1. Response surface and contour curves graphs: (a) dry weight predictions; (b) crude biosurfactant predictions.
Table 3. Analysis of variance (ANOVA) for the dry weight and crude biosurfactant.
Source of variation
d.f. SS MS Fcal
DW CB DW CB DW CB DW CB
Regression 4 4 1.9758 224057.5 0.493 56014.38 9.8 14.83 Residual 6 6 0.3024 22665.2 0.050 3777.5
Total 10 10 8199.2 246722.7
DW: F4; 6; 0.10 = 3.18; Correlation Coefficient: R2 = 86.72%. CB: F4; 6; 0.10 = 3.18; Correlation Coefficient:
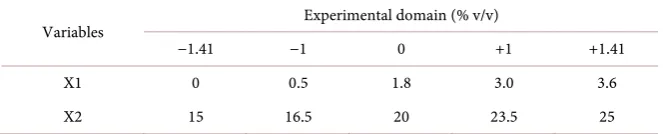
[image:7.595.210.539.627.698.2]DOI: 10.4236/abb.2017.810025 350 Advances in Bioscience and Biotechnology Even the models with good agreement, the investigations about the optimal point were carried out via conditions determined first matrix (Table 2), waste of candy was conducted from 0% to 3.6% v/v while raw glycerol was conducted from 15% to 25% v/v. Thus, another experimental domain was evaluated, ac-cording to Table 4.
The matrix with new scenario of investigation can be seen in Table 5.
The changes made in experimental domain were able to reach response dif-ferent of zero (seen previously). From new CCRD results, the assay 2 showed highest value of crude biosurfactant (around 670 mg/L) and assay 6 showed highest value of dry weight (around 43.21 g/L).
Based on matrix, the calculation of regression coefficient with p-value limit 0.10 allowed evaluating polynomial models. The behavior of dry weight and crude biosurfactant was assessed, for practical purposes, two models were ad-justed through re-parameterization (as previously), to make it as simple as poss-ible, with the fewest possible parameters, without losing its accuracy (Equations (5) and (6)):
(
)
2 21 1 2 2 1 2
Dry Weight g L =30.76 0.92+ X +1.74X +1.36X −0.44X −1.15X X (5)
(
)
1 2 [image:8.595.209.541.390.457.2]Crude Biosurfactant mg L =645.05 67.50− X X (6)
Table 4. Values used in central composite rotatable design (CCRD).
Variables Experimental domain (% v/v)
−1.41 −1 0 +1 +1.41
X1 0 0.5 1.8 3.0 3.6
X2 15 16.5 20 23.5 25
Table 5. CCRD combinations of factors and the response variable.
Assays Factors Response
Run X1 v/v (%) X2 v/v (%) DW (g/L) CB (mg/L)
[image:8.595.200.539.489.734.2]DOI: 10.4236/abb.2017.810025 351 Advances in Bioscience and Biotechnology Therefore, the results of the polynomial model in the form of analysis ANOVA was analyzed in these new scenarios. Table 6 shows the calculated val-ues.
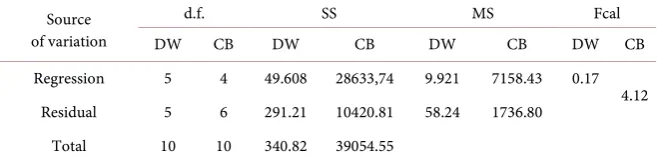
The ANOVA of the models (dry weight and crude biosurfactant) showed that F-test were 0.17 and 4.12, not suitable for the models. These results indicated that the regression model was insignificant, because the lack of fit showed higher values. The fit of the model was evaluated by the determination of coefficient R2 values, 0.88 and 0.73, confirming no good agreement of models. Although these results are not promising, the model can indicate through surface response where the optimal point is, Figure 2.
[image:9.595.210.539.296.377.2]The CCRD can validate with other models, for this purpose it was developed strategies of the use of artificial neural network (ANN) as predictor model.
Table 6. Analysis of variance (ANOVA) for the crude biosurfactant and reduction ratio of surface tension.
Source of variation
d.f. SS MS Fcal
DW CB DW CB DW CB DW CB
Regression 5 4 49.608 28633,74 9.921 7158.43 0.17 4.12 Residual 5 6 291.21 10420.81 58.24 1736.80
Total 10 10 340.82 39054.55
DW: F5; 5; 0.10 = 3.45; Correlation Coefficient: R2 = 88.41%. CB: F4; 6; 0.10 = 3.18; Correlation Coefficient:
R2 = 73.31%.
(a)
(b)
[image:9.595.212.537.415.691.2]DOI: 10.4236/abb.2017.810025 352 Advances in Bioscience and Biotechnology
3.2. ANN-Based Modeling
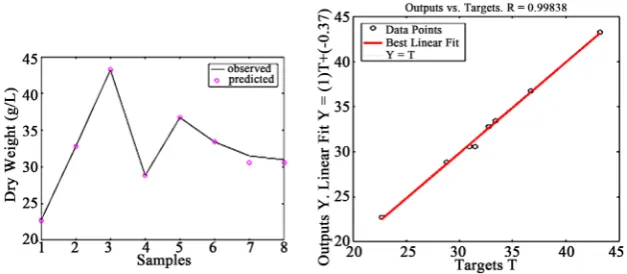
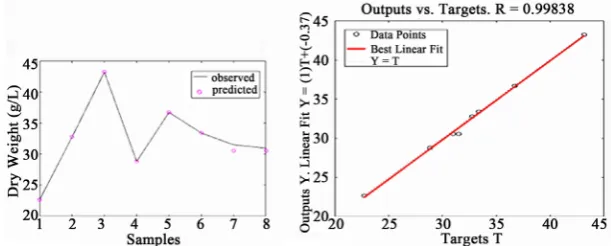
The experiments used as input data for developing an ANN based model is given in Table 5 through CRRD combinations. The experiments were conducted in duplicate thus, the total data set of 33 points divided into a training set of 25 and a test set of 8 data points. The outputs for each model were given by dry weight and crude biosurfactant (seen in Table 5), which demonstrate the functional re-lationship between media component (waste of candy and glycerol) and biosur-factant production. The number of neurons in hidden layer was fixed on 4 for every situation in modeling to ensure that number of effective parameters were not higher than number of vector in input layer, discarding the appearance of overfitting. All of topologies of ANN model were 2-4-1. It was implemented dif-ferent training algorithms, as seen in Figures 3-12 (expressed by dispersion and regression graph). The Figures 3-6 represent all the conditions of model-prediction of dry weight (g/L) using logsig as activation function.
[image:10.595.217.531.370.507.2]Although the most of situation of modeling has shown good values of correla-tion coefficient, the situacorrela-tion of Figure 3 was chosen, R2 of 0.998, besides of MSE 0.1579. The MSE was considered small and comparable magnitudes of the aver-age prediction error (seen all dry weight predictions), which suggest that the model possesses good approximation and generalization characteristics.
Figure 3. Predicted data and regression graph of test ANN using 2 × 4 × 1 topology and
trainlm algorithm.
Figure 4. Predicted data and regression graph of test ANN using 2 × 4 × 1 topology and
[image:10.595.220.531.556.692.2]DOI: 10.4236/abb.2017.810025 353 Advances in Bioscience and Biotechnology
Figure 5. Predicted data and regression graph of test ANN using 2 × 4 × 1 topology and
[image:11.595.220.528.241.357.2]trainbr algorithm.
Figure 6. Predicted data and regression graph of test ANN using 2 × 4 × 1 topology and
traincgb algorithm.
Figure 7. Predicted data and regression graph of test ANN using 2 × 4 × 1 topology and
trainoss algorithm.
Figure 8. Dispersion and regression graph of test ANN using 2 × 4 × 1 topology and
[image:11.595.219.525.405.528.2] [image:11.595.220.526.577.690.2]DOI: 10.4236/abb.2017.810025 354 Advances in Bioscience and Biotechnology
Figure 9. Dispersion and regression graph of test ANN using 2 × 4 × 1 topology and
[image:12.595.218.529.236.356.2]traingdx algorithm.
Figure 10. Dispersion and regression graph of test ANN using 2 × 4 × 1 topology and
traingdx algorithm.
Figure 11. Dispersion and regression graph of test ANN using 2 × 4 × 1 topology and
traincgb algorithm.
Figure 12. Dispersion and regression graph of test ANN using 2 × 4 × 1 topology and
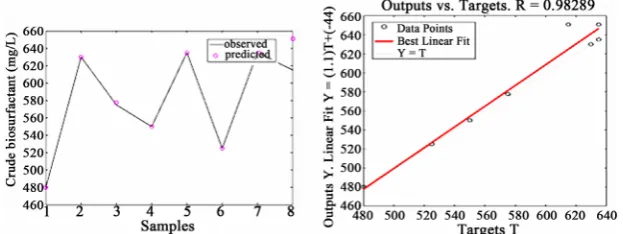
[image:12.595.217.528.404.524.2] [image:12.595.218.529.570.693.2]DOI: 10.4236/abb.2017.810025 355 Advances in Bioscience and Biotechnology The Figures 8-12 represent all the conditions of model-prediction of crude biosurfactant using tansig as activation function.
To de second model was chosen as previously, by the best values of correlation coefficient and MSE. The situation plotted in Figure 9, ANN using 2 × 4 × 1 to-pology and traingdx algorithm, was considered to form model with R2 of 0.982 and MSE 0.067.
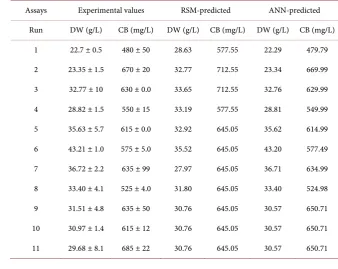
The performance of both of ANN-models was consistent as it resulted in sim-ilar values of predicted and observed data. The results obtained are very impor-tant, because they very clearly reveal the sufficiency and representativeness of waste of candy and glycerol concentrations v/v as relevant input variables for prediction. To prove the steady prediction performance, it was shown ANN and RSM predictions (Table 7).
The predictions performance of the ANN models for the experimental design data set confirms theirs superior generalization capacity when comparing RSM models. Analysis of the results demonstrated that the neural modeling approach is a useful tool for accurate modeling of two dependent variables and has shown a sum of errors of 2.30 and 88.48 for de dry weight and crude predictions while for RSM model sum of errors were 43.40 and 560.50, respectively.
[image:13.595.199.538.466.735.2][22] developed a similar strategy to investigate bioethanol production. It was used RSM and ANN models for bioethanol yield and volume fraction. The re-sults showed that ANN was better than RSM in data fitting with correlation coefficient of 1 and 0.98 and absolute average deviation of 0.09% and 1.67%, re-spectively.
Table 7. Experimental values and model-predicted values of dry weight (DW) and crude biosurfactant (CB).
Assays Experimental values RSM-predicted ANN-predicted
Run DW (g/L) CB (mg/L) DW (g/L) CB (mg/L) DW (g/L) CB (mg/L)
1 22.7 ± 0.5 480 ± 50 28.63 577.55 22.29 479.79
2 23.35 ± 1.5 670 ± 20 32.77 712.55 23.34 669.99
3 32.77 ± 10 630 ± 0.0 33.65 712.55 32.76 629.99
4 28.82 ± 1.5 550 ± 15 33.19 577.55 28.81 549.99
5 35.63 ± 5.7 615 ± 0.0 32.92 645.05 35.62 614.99
6 43.21 ± 1.0 575 ± 5.0 35.52 645.05 43.20 577.49
7 36.72 ± 2.2 635 ± 99 27.97 645.05 36.71 634.99
8 33.40 ± 4.1 525 ± 4.0 31.80 645.05 33.40 524.98
9 31.51 ± 4.8 635 ± 50 30.76 645.05 30.57 650.71
10 30.97 ± 1.4 615 ± 12 30.76 645.05 30.57 650.71
DOI: 10.4236/abb.2017.810025 356 Advances in Bioscience and Biotechnology
3.3. Validation in Optimal Points
The optimum values were found to be 3.2% (v/v) for waste of candy and 16% (v/v) raw glycerol concentrations. The maximum dry weight and crude biosur-factant in these optimum conditions was 25.60 ± 5.0 g/L and 668 ± 40 mg/L, re-spectively. The models were used to compare with the observed data. To RSM models were reached 33.36 g/L of dry weight and 731.24 mg/L of crude biosur-factant and to ANN models were 27.45 g/l and 671.56 mg/L, respectively. The validation experiments confirm that ANN models are powerful approach to pre-dict steady behavior of biosurfactant production, because their prepre-dictions are within of experimental errors.
Fermentation process are very complex, especially when using waste sub-strates, it is believed that the performance of RSM models had not good statistical significance due to the great variation of experimental errors, high non-linearity. ANNs are known by the accuracy, the generalization ability and the robustness of the models, in these types of study theirs use is more appropriate.
It is important to highlight, in this study, that production of biosurfactant us-ing only alternative sources (waste of candy and glycerol from biodiesel process) presented similar results to other researches that used synthetic culture broth, such as [25]. The authors evaluated biosurfactant production by Bacillus subtilis through response surface methodology, using as factors glucose, K2HPO4 and urea. The results showed a maximum predicted biosurfactant concentration of 2.93 g/L and experimental result was 3.1 g/L. Several works treat of biosurfactant production incorporating waste in the culture broth synthetic. [26] produced biosurfactant using by Bacillus subtilis LAMI005, using residual glycerol from biodiesel production as a carbon source. The culture medium was (in g/L): (NH4)2SO4 (1.0); Na2HPO4∙7H2O (7.2); KH2PO4 (3.0); NaCl (2.7); MgSO4∙7H2O (0.6); glycerol (20.0).
3.4. Application of Crude Biosurfactant in Oil Spreading
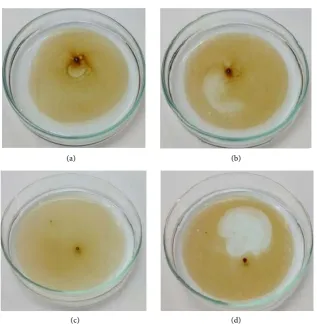
In order to confirm the presence of biosurfactant by using the optimum condi-tion, experiments were conducted (Figure 13) simulating the recovery oil spreading in water.
The results revealed applications for produced biosurfactant. There is a little information about oil displacement areas brought about by biosurfactants pro-duced by Bacillus subtilis in the literature. Nevertheless, it is noticed larger clear zone, compared with negative control, when added biosurfactant. [27] tested produced biosurfactant by Bacillus subtilis in application of the oil spreading. [28] also checked oil displacement area formed when added produced biosur-factant by Cunninghamella echinulata.
4. Conclusion
DOI: 10.4236/abb.2017.810025 357 Advances in Bioscience and Biotechnology
(a) (b)
[image:15.595.216.534.63.388.2]
(c) (d)
Figure 13. Oil spreading test: (a) sample without negative control; (b) sample with nega-tive control; (c) sample without crude biosurfactant; (d) sample with crude biosurfactant.
two alternative residues (waste of candy industry and glycerol from biodiesel process) without supplementations and the responses were dry weight (g/L) and crude biosurfactant (mg/L) in 96 h of fermentation. RSM and ANN models were employed to predict the mentioned responses of experimental matrix. ANN provided more accurate predictions than RSM seen by higher R2 and lower sum of errors from predicted values. Validation of optimum points were similar to predicted values by ANN models. To our knowledge, this is first study to report on use of combinations among two substrates based on waste of candy and gly-cerol from biodiesel for the purpose of biosurfactant production, besides, to de-velop a multiple criteria analysis based on statistical and intelligence modeling. An application in remediation of oil spreading was simulated and crude biosur-factant was able to produce a clear zone. Additionally, all the results indicated success to use waste, showing good agreement with environment. But there are lots of researches about this theme to be elucidated, such as: scale up assay, using the best conditions; to add others waste; to study the oxygen influence and ki-netics parameters; and others.
Acknowledgements
DOI: 10.4236/abb.2017.810025 358 Advances in Bioscience and Biotechnology Council of Technological and Scientific Development).
Coordenação de Aperfeiçoamento de Pessoal de Nível Superior (CAPES-Coor- dination for the Improvement of Higher Education Personnel).
References
[1] Kapadia, S.G. and Yagnik, B.N. (2013) Current Trend and Potential for Microbial Biosurfactants. Asian Journal of Experimental Biological Sciences, 4, 1-8.
[2] Geys, R., Soetaert, W. and Van, B.I. (2014) Biotechnological Opportunities in Bio-surfactant Production. Current Opinion in Biotechnology, 30, 66-72.
https://doi.org/10.1016/j.copbio.2014.06.002
[3] Rebello, S., Asok, A.K., Mundayoor, S. and Jisha, M.S. (2014) Surfactants: Toxicity, Remediation and Green Surfactants. Environmental Chemistry Letters, 12, 275-287.
https://doi.org/10.1007/s10311-014-0466-2
[4] Gudiña, E.J., Fernandes, E.C., Rodrigues, A.I., Teixeira, J.A. and Rodrigues, L.R. (2015) Biosurfactant Production by Bacillus subtilis Using Corn Steep Liquor as Culture Medium. Frontiers in Microbiology, 6, 59.
https://doi.org/10.3389/fmicb.2015.00059
[5] Liu, J., Mbadinga, S.M., Yang, S., Gu, J. and Mu, B. (2015) Chemical Structure, Property and Potential Applications of Biosurfactants Produced by Bacillus subtilis
in Petroleum Recovery and Spill Mitigation. International Journal of Molecular Sciences, 16, 4814-4837. https://doi.org/10.3390/ijms16034814
[6] Santos, D.K.F., Rufino, R.D., Luna, J.M., Santos, V.A., Salgueiro, A.A. and Sarubbo, L.A. (2013) Synthesis and Evaluation of Biosurfactant Produced by Candida Lipoly-tica Using Animal Fat and Corn Steep Liquor. Journal of Petroleum Science and Engineering, 105, 43-50.
[7] Randhawa, K.K.S. and Rahman, P.K.S.M. (2014). Rhamnolipid Biosurfac-tants—Past, Present, and Future Scenario of Global Market. Frontiers in Microbi-ology, 5, 1-7.
[8] Santos, B.F., Ponezi, A.N. and Fileti, A.M.F. (2014) Strategy of Using Waste for Biosurfactant Production through Fermentation by Bacillus subtilis. Chemical En-gineering Transactions, 37, 727-732.
[9] Luna, J.M., Rufino, R.D., Sarubbo, L.A. and Takaki, G.M.C. (2013) Characteriza-tion, Surface Properties and Biological Activity of a Biosurfactant Produced from Industrial Waste by Candida Sphaerica UCP0995 for Application in the Petroleum Industry. Colloids and Surfaces B: Biointerfaces, 102, 202-209.
[10] Banat, I.M., Satpute, S.K., Cameotra, S.S., Patil, R. and Nyayanit, N.V. (2014) Cost Effective Technologies and Renewable Substrates for Biosurfactants Production.
Frontiers in Microbiology, 5, 697. https://doi.org/10.3389/fmicb.2014.00697
[11] Makkar, R.S., Cameotra, S.S. and Banat, I.M. (2011) Advances in Utilization of Re-newable Substrates for Biosurfactant Production. Applied Microbiology and Bio-technology, 1, 1-19.
[12] Al-Bahry, S.N., Al-Wahaibi, Y.M., Elshafie, A.E., Al-Bemani, A.S., Joshi, S.J. and Al-Makhmari, H.S. (2013) Biosurfactant Production by Bacillus subtilis B20 Using Date Molasses and Its Possible Application in Enhanced Oil Recovery. International Biodeterioration and Biodegradation, 81, 141-146.
https://doi.org/10.1016/j.ibiod.2012.01.006
DOI: 10.4236/abb.2017.810025 359 Advances in Bioscience and Biotechnology Bacillus subtilis LAMI005 Grown in Clarified Cashew Apple Juice. Colloids and Surfaces B, 101, 34-43. https://doi.org/10.1016/j.colsurfb.2012.06.011
[14] Sousa, M., Dantas, I.T., Feitosa, F.X., Alencar, A.E.V., Soares, S.A., Melo, V.M.M., Gonçalves, L.R.B. and Sant'ana, H.B. (2014) Performance of a Biosurfactant Pro-duced by Bacillus subtilis LAMI005 on the Formation of Oil/Biosurfactant/Water Emulsion: Study of the Phase Behaviour of Emulsified Systems. Brazilian Journal of Chemical Engineering, 31, 613-623.
https://doi.org/10.1590/0104-6632.20140313s00002766
[15] Ehrhardt, D.D., Secato, J.F.F. and Tambourgi, E.B. (2015) Biosurfactant Production by Bacillus subtilis Using the Residue from Processing of Pineapple, Enriched with Glycerol, as Substrate. Chemical Engineering Transactions, 43, 277-282.
[16] Mouafi, F.E., Abo Elsouda, M.M. and Moharam, M.E. (2016) Optimization of Bio-surfactant Production by Bacillus brevis Using Response Surface Methodology.
Biotechnology Reports, 9, 31-37. https://doi.org/10.1016/j.btre.2015.12.003
[17] Deepika, K.V., Kalam, S., Sridhar, P.R., Podile, A.R. and Bramhachari, P.V. (2016) Optimization of Rhamnolipid Biosurfactant Production by Mangrove Sediment Bacterium Pseudomonas aeruginosa KVD-HR42 Using Response Surface Metho-dology. Biocatalysis and Agricultural Biotechnology, 5, 38-47.
https://doi.org/10.1016/j.bcab.2015.11.006
[18] Awad, S., Paraschiv, M., Varuvel, E.G. and Tazerout, M. (2013) Optimization of Biodiesel Production from Animal Fat Residue in Wastewater Using Response Sur-face Methodology. Bioresource Technology, 129, 315-320.
https://doi.org/10.1016/j.biortech.2012.11.086
[19] Pal, M.P., Vaidya, B.K., Desai, K.M., Joshi, R.M., Nene, S.N. and Kulkarni, B.D. (2009) Media Optimization for Biosurfactant Production by Rhodococcus erythro-polis MTCC 2794: Artificial Intelligence versus a Statistical Approach. Journal of Industrial Microbiology and Biotechnology, 36, 747-756.
https://doi.org/10.1007/s10295-009-0547-6
[20] Dhanarajan, G., Mandal, M. and Sen, R. (2014) A Combined Artificial Neural Net-work Modeling-Particle Swarm Optimization Strategy for Improved Production of Marine Bacterial Lipopeptide from Food Waste. Biochemical Engineering Journal, 54, 59-65. https://doi.org/10.1016/j.bej.2014.01.002
[21] Singh, D., Ganesh, A. and Mahajani, S. (2015) Heterogeneous Catalysis for Biodiesel Synthesis and Valorization of Glycerol. Clean Technologies and Environmental Policy, 17, 1103-1110. https://doi.org/10.1007/s10098-014-0858-9
[22] Betiku, E., Okunsolawo, S.S., Ajala, S.O. and Odedele, O.S. (2015) Performance Evaluation of Artificial Neural Network Coupled with Generic Algorithm and Re-sponse Surface Methodology in Modeling and Optimization of Biodiesel Production Process Parameters from Shea Tree (Vitellaria paradoxa) Nut Butter. Renewable Energy, 76, 408-417. https://doi.org/10.1016/j.renene.2014.11.049
[23] Ghribi, D. and Chaabouni, S.E. (2011) Enhancement of Bacillus subtilis Lipopeptide Biosurfactants Production through Optimization of Medium Composition and Adequate Control of Aeration. Biotechnology Research International, 653-654. [24] Rocha, M.V.P., Mendes, J.S., Giro, M.E.A., Melo, V.M.M. and Gonçalves, L.R.B.
(2014) Biosurfactant Production by Pseudomonas aeruginosa MSIC02 in Cashew Apple Juice Using a 24 Full Factorial Experimental Design. Chemical Industry & Chemical Engineering Quarterly, 20, 49-58.
https://doi.org/10.2298/CICEQ120518100R
DOI: 10.4236/abb.2017.810025 360 Advances in Bioscience and Biotechnology
Culture Using Response Surface Methodology. Biotechnology Research Interna-tional, Article ID: 795430.
[26] Sousa, M., Dantas, T., Feitosa, F.X., Alencar, A.E.V., Soares, S.A., Melo, V.M.M., Gonçalves, L.R.B. and Sant'ana, H.B. (2014) Performance of a Biosurfactant Pro-duced by Bacillus subtilis LAMI005 on the Formation of Oil/Biosurfactant/Water Emulsion: Study of the Phase Behaviour of Emulsified Systems. Brazilian Journal of Chemical Engineering, 31, 613-623.
https://doi.org/10.1590/0104-6632.20140313s00002766
[27] Saimmai, A., Sobhon, V. and Maneerat, S. (2011) Molasses as a Whole Medium for Biosurfactants Production by Bacillus Strains and Their Application. Applied Bio-chemistry and Biotechnology, 165, 315-335.
https://doi.org/10.1007/s12010-011-9253-8