Effects of Creativity and Cluster Tightness on Short Text Clustering
Performance
Catherine Finegan-Dollak1 Reed Coke1 Rui Zhang1 Xiangyi Ye2 Dragomir Radev1
{cfdollak, reedcoke, ryanzh, yexy, radev}@umich.edu 1Department of EECS, University of Michigan, Ann Arbor, MI USA
2Department of Mechanical Engineering, University of Michigan, Ann Arbor, MI USA
Abstract
Properties of corpora, such as the diver-sity of vocabulary and how tightly related texts cluster together, impact the best way to cluster short texts. We examine several such properties in a variety of corpora and track their effects on various combinations of similarity metrics and clustering algo-rithms. We show that semantic similar-ity metrics outperform traditionaln-gram and dependency similarity metrics for k-means clustering of a linguistically cre-ative dataset, but do not help with less creative texts. Yet the choice of simi-larity metric interacts with the choice of clustering method. We find that graph-based clustering methods perform well on tightly clustered data but poorly on loosely clustered data. Semantic similarity met-rics generate loosely clustered output even when applied to a tightly clustered dataset. Thus, the best performing clustering sys-tems could not use semantic metrics.
1 Introduction
Corpora of collective discourse—texts generated by multiple authors in response to the same stimulus—have varying properties depending on the stimulus and goals of the authors. For instance, when multiple puzzle-composers write crossword puzzle clues for the same word, they will try to write creative, unique clues to make the puzzle in-teresting and challenging; clues for “star” could be “Paparazzi’s target” or “Sky light.” In contrast, people writing a descriptive caption for a photo-graph can adopt a less creative style. Corpora may also differ on how similar texts within a particular
class are to one another, compared to how simi-lar they are to texts from other classes. For ex-ample, entries in a cartoon captioning contest that all relate to the same cartoon may vary widely in subject, while crossword clues for the same word would likely be more tightly clustered.
This paper studies how such text properties af-fect the best method of clustering short texts. Choosing how to cluster texts involves two ma-jor decisions: choosing a similarity metric to de-termine which texts are alike, and choosing a clustering method to group those texts. We hy-pothesize that creativity may drive authors to ex-press the same concept in a wide variety of ways, leading to data that can benefit from different similarity metrics than less creative texts. At the same time, we hypothesize that tightly clus-tered datasets—datasets where each text is much more similar to texts in its cluster than to texts from other clusters—can be clustered by power-ful graph-based methods such as Markov Cluster-ing (MCL) and Louvain, which may fail on more loosely clustered data. This paper explores the in-teraction of these effects.
Recently, distributional semantics has been popular and successful for measuring text simi-larity (Socher et al., 2011; Cheng and Kartsaklis, 2015; He et al., 2015; Kenter and de Rijke, 2015; Kusner et al., 2015; Ma et al., 2015; Tai et al., 2015; Wang et al., 2015). Word embeddings rep-resent similar words in similar locations in vector space: “cat” is closer to “feline” than to “bird.” It would be natural to expect such semantics-based approaches to be useful for clustering, particu-larly for corpora where authors have tried to ex-press similar ideas in unique ways. And indeed, this paper will show that, depending on the choice of clustering method, semantics-based similarity
measures such as summed word embeddings and deep neural networks can have an advantage over more traditional similarity metrics, such as n-gram counts, n-gram tf-idf vectors, and dependency tree kernels, when applied to creative texts.
However, unlike in most text similarity tasks, in clustering the choice of similarity metric inter-acts with both the choice of clustering method and the properties of the text. Graph-based cluster-ing techniques can be quite effective in clustercluster-ing short texts (Rangrej et al., 2011), yet this paper will show that they are sensitive to how tightly clustered the data is. Moreover, the tightness of clusters in a dataset is a property of both the un-derlying data and the similarity metric. We show that when the underlying data can be clustered tightly enough to use powerful graph-based clus-tering methods, using semantics-based similarity metrics actually creates a disadvantage compared to methods that rely on the surface form of the text, because semantic metrics reduce tightness.
The remainder of this paper is organized as fol-lows. Section 2 summarizes related work. Section 3 describes four datasets of short texts. In Sec-tion 4, we describe the similarity metrics and clus-tering methods used in our experiments, as well as the evaluation measures. Section 5 shows that semantics-based similarity metrics have some ad-vantage when clustering short texts from the most creative dataset, but ultimately do not perform the best when graph-based clustering is an option. In Section 6, we demonstrate the powerful effect that tightness of clusters has on the best combination of similarity metric and clustering method for a given dataset. Finally, Section 7 draws conclusions.
2 Related Work
The most similar work to the present paper is Shrestha et al. (2012), which acknowledged that the similarity metric and the clustering method could both contribute to clustering results. It com-pared four similarity methods and also tested four clustering methods. Unlike the present work, it did not consider distributional semantics-based simi-larity measures or simisimi-larity measures that incor-porated deep learning. In addition, it reported that the characteristics of the corpora “overshadow[ed] the effect of the similarity measures,” making it difficult to conclude that there were any significant differences between the similarity measures.
Several papers address the choice of similarity
metric for short text clustering without varying the clustering method. Yan et al. (2012) proposed an alternative term weighting scheme to use in place of tf-idf when clustering using non-negative ma-trix factorization. King et al. (2013) used the cosine similarity between feature vectors that in-cluded context word and part-of-speech features and spelling features and applied Louvain cluster-ing to the resultcluster-ing graph. Xu et al. (2015) used a convolutional neural network to represent short texts and found that, when used with the k-means clustering algorithm, this deep semantic represen-tation outperformed tf-idf, Laplacian eigenmaps, and average embeddings for clustering.
Other papers focused on choosing the best clus-tering method for short texts, but kept the simi-larity metric constant. Rangrej et al. (2011) com-pared k-means, singular value decomposition, and affinity propagation for tweets, finding affinity propagation the most effective, using tf-idf with cosine similarity or Jaccard for a similarity mea-sure. Errecalde et al. (2010) describe an AntTree-based clustering method. They used the cosine similarity of tf-idf vectors as well. Yin (2013) also use the cosine similarity of tf-idf vectors for a two-stage clustering algorithm for tweets.
One common strategy for short text clustering has been to take advantage of outside sources of knowledge (Banerjee et al., 2007; Wang et al., 2009a; Petersen and Poon, 2011; Rosa et al., 2011; Wang et al., 2014). The present work relies only on the texts themselves, not external information.
3 Datasets
Collective discourse (Qazvinian and Radev, 2011; King et al., 2013) involves multiple writers gen-erating texts in response to the same stimulus. In a corpus of texts relating to several stimuli, it may be desirable to cluster according to which stimulus each text relates to—for instance, grouping all of the news headlines about the same event together. Here, we consider texts triggered by several types of stimuli: photographs that need descriptive cap-tions, cartoons that need humorous capcap-tions, and crossword answers that need original clues. Each need shapes the properties of the texts.
Pat-tern Analysis, Statistical Modeling, and Computa-tional Learning (PASCAL) Visual Object Classes Challenge (Everingham et al., 2010).
PAS includes twenty categories of images (e.g., dogs, as in Example (1)) and 4998 captions. Each category has fifty images with approximately five captions for each image. We use the category as the gold standard cluster. The 8K ImageFlickr set includes 38,390 captions for 7663 photographs; we treat the image a caption is associated with as the gold standard cluster. To keep dataset sizes comparable, we use a randomly selected subset of 5000 captions (998 clusters) from ImageFlickr (hereinafter FLK).
(1)
“a man walking a small dog on a very wavy beach” “A person in a large black coats walks a white dog on the beach through rough waves.”
“Walking a dog on the edge of the ocean”
This task did not encourage creativity; instruc-tions said to “describe the image in one complete but simple sentence.” This could lead to sentences within a cluster being rather similar to each other. However, because photographs may contain over-lapping elements—for instance, a photograph in the “bus” category of PAS might also show cars, while a photograph in the “cars” category could also contain a bus—texts in one cluster can also be quite similar to texts from other clusters. Thus, these datasets should not be very tightly clustered.
New Yorker Cartoon Captions. The New Yorker magazine has a weekly competition in which readers submit possible captions for a captionless cartoon (Example (2)) (Radev et al., 2015). We use the cartoon each caption is associ-ated with as its gold standard cluster.
The complete dataset includes over 1.9 million captions for 366 cartoons. For this work, we use a total of 5000 captions from 20 randomly selected cartoons as the “TOON” dataset.
(2)
“Objection, Your Honor! Alleged killer whale.” “My client maintains that the penguin had a gun!” “I demand a change of venue to a maritime court!” Since caption writers seek to stand out from the crowd, we expect high creativity. This may en-courage a more varied vocabulary than the FLK and PAS captions that merely describe the image. We also expect wide variation in the meanings of captions for the same cartoon, due to the dif-ferent joke senses submitted for each, leading to low intra-cluster similarity. Moreover, some users may submit the same caption for more than one cartoon, so we can expect surprisingly high inter-cluster similarity despite the wide variation in car-toon prompt images. We therefore do not expect TOON to be tightly clustered.
Crossword Clues. A dataset of particularly creative texts is comprised of crossword clues.1 We use the clues as texts and the answer words as their gold standard cluster; all of the clues in Example (3) belong to the “toe” cluster.
(3) Part of the foot Little piggy
tic-tac-The third O of OOO
The complete crossword clues dataset includes 1.7M different clues corresponding to 174,638 unique answers. The “CLUE” dataset includes 5000 clues corresponding to 20 unique answers selected by randomly choosing answers that have 250 or more unique clues, and then randomly choosing 250 of those clues for each answer.
Since words repeat, crossword authors must be creative to come up with clues that will not bore cruciverbalists. CLUE should thus contain many alternative phrasings for essentially the same idea. At the same time, there is likely to be relatively little overlap between clues for different answers, so CLUE should be tightly clustered.
4 Method
Here we describe the similarity metrics and clus-tering methods, as well as evaluation measures.
4.1 Similarity Metrics
We hypothesize that creative texts with wide vo-cabularies will benefit from similarity metrics based on semantic representation of the text, rather than its surface form. We therefore compare three metrics that rely on surface forms of words—n -gram count vectors, tf-idf vectors, and dependency tree segment counts—to three semantic ones— summed Word2Vec embeddings, LSTM autoen-coders, and skip-thought vectors. In each case, we represent texts as vectors and find their cosine sim-ilarities; if cosine similarity can be negative, we add one and normalize by two to ensure similarity in the range [0, 1].
N-Gram Counts. First we consider n-gram count vectors. We use three variations: (1) un-igrams, (2) unigrams and bun-igrams, and (3) uni-grams, biuni-grams, and trigrams.
N-Gram tf-idf. We also consider weighting
n-grams by tf-idf, as calculated by sklearn (Pe-dregosa et al., 2011).
Dependency Counts. Grammatical informa-tion has been found to be useful in text, particu-larly short text, similarity. (Liu and Gildea, 2005; Zhang et al., 2005; Wang et al., 2009b; Heilman and Smith, 2010; Tian et al., 2010; ˇSari´c et al., 2012; Tai et al., 2015). To leverage this infor-mation, previous work has used dependency ker-nels (Tian et al., 2010), which measure similarity by the fraction of identical dependency parse seg-ments between two sentences. Here, we accom-plish the same effect using a count vector for each sentence, with the dependency parse segments as the vocabulary. We define the set of segments for a dependency parse to consist of, for each word, the word, its parent, and the dependency relation that connects them as shown in Example (4). (4) Part of shoe
a. Segment 1: (part, ROOT, nsubj) b. Segment 2: (of, part, prep) c. Segment 3: (shoe, of, pobj)
Word2Vec. For each word, we obtain, if possi-ble, a vector learned via Word2Vec (Mikolov et al., 2013) from the Google News corpus.2 We
repre-2https://code.google.com/archive/p/
word2vec/
sent a sentence as the normalized sum of its word vectors.
LSTM Autoencoder. We use Long Short-Term Memory (LSTM) networks (Hochreiter and Schmidhuber, 1997) to build another semantics-based sentence representation. We train an LSTM autoencoder consisting of an encoder network and a decoder network. The encoder reads the in-put sentence and produces a single vector as the hidden state at the last time step. The decoder takes this hidden state vector as input and at-tempts to reconstruct the original sentence. The LSTM autoencoder is trained to minimize the re-construction loss. After training, we extract the hidden state at the last time step of encoder as the vector representation for a sentence. We use 300-dimensional word2vec vectors pretrained on GoogleNews and generate 300-dimensional hid-den vectors. LSTM autoencoders are separately trained for each dataset with 20% for validation.
Skip-thoughts (Kiros et al., 2015) trains encoder-decoder Recurrent Neural Networks (RNN) without supervision to predict the next and the previous sentences given the current sentence. The pretrained skip-thought model computes vectors as sentence representations.
4.2 Clustering Methods
We explore five clustering methods: k-means, spectral, affinity propagation, Louvain, and MCL. K-meansis a popular and straightforward clus-tering algorithm (Berkhin, 2006) that takes a pa-rameter k, the number of clusters, and uses an expectation-maximization approach to findk cen-troids in the data. In the expectation phase points are assigned to their nearest cluster centroid. In the maximization phase the centroids of are re-computed for each cluster of assigned points. K-means is not a graph-based clustering algorithm, but rather operates in a vector space.
k-means for the subsequent clustering step. Affinity propagationfinds exemplars for each cluster and then assigns nodes to a cluster based on these exemplars (Frey and Dueck, 2007). This involves updating two matricesR andA, respec-tively representing the responsibility and availabil-ity of each node. A high value forR(i,k)indicates that nodexiwould be a good exemplar for cluster
k. A high value forA(i,k) indicates that node xi
is likely to belong to clusterk. We use the default implementation provided by sklearn.
Louvain initializes each node to be its own cluster, then greedily maximizes modularity (Sec-tion 6.1) by iteratively merging clusters that are highly interconnected (Blondel et al., 2008).
Markov Cluster Algorithm (MCL) simulates flow on a network via random walk (Van Dongen, 2000). The sequence of nodes is represented via a Markov chain. By applying inflation to the tran-sition matrix, the algorithm can maintain the clus-ter structure pronounced in the transition matrix of this random walk—a structure that would oth-erwise disappear over time.3
4.3 Evaluation Methods
Adjusted Rand Index We use the sklearn im-plementation of the Adjusted Rand Index (ARI)4 (Hubert and Arabie, 1985):
ARI= maxRIRI−Expected RI−Expected RI (1)
whereRIis the Rand Index,
RI = T P +F PT P ++F NT N+T N (2)
T P is the number of true positives, T N is true negatives, and F P and F N are false positives and false negatives, respectively. The Rand Index ranges from 0 to 1. ARI adjusts the Rand Index for chance, so that the score ranges from -1 to 1. Random labeling will achieve an ARI score close to 0; perfect labeling achieves an ARI of 1.
Purity is a score in the [0,1] range that indi-cates to what extent sentences in the same pre-dicted cluster actually belong to the same cluster. Given Ω = {ω1, ω2, ..., ωK}, the predicted
clus-ters,C={c1, c2, ..., cJ}, the true clusters, andN,
the number of examples, purity is Purity(Ω, C) = N1 X
k∈K max
j∈J |ωk∩cj| (3)
3We use the implementation fromhttp://micans.
org/mcl/with inflation=2.0.
4Equivalent to Cohen’s Kappa (Warrens, 2008).
Normalized Mutual Information (NMI). We use the sklearn implementation of NMI:
NMI(Ω, C) = pMI(Ω, C)
H(C)·H(Ω) (4)
The numerator is the mutual information (MI) of predicted cluster labels Ωand true cluster labels
C. MI describes how much knowing what the predicted clusters are increases knowledge about what the actual classes are. Using marginal en-tropy (H(x)), NMI normalizes MI so that it ranges from 0 to 1. IfC andΩare identical—that is, if the clusters are perfect—NMI will be 1.
5 Vocabulary Width
5.1 Descriptive Statistics for Vocabulary Width
We predict that creative texts have a wider vocabu-lary than functional texts. We use two measures to reflect this wide vocabulary: the type/token ratio in the dataset (TTR), and that ratio normalized by the mean length of a text in the dataset.
TTR is an obvious estimate of the width of the vocabulary of a corpus. However, all other things being equal, a corpus of many very short texts triggered by the same stimulus would have more repeated words, proportional to the total num-ber of tokens in the corpus, than would a corpus of a smaller number of longer texts. We might therefore normalize the ratio of types to tokens by dividing by the mean length of a text in the dataset, leading to the normalized type-to-token ratio (NTTR) and TTR values shown in Table 1.
CLUE TOON PAS FLK
TTR 0.1680 0.1064 0.0625 0.0561
NTTR 0.0377 0.0086 0.0058 0.0047
Table 1: Vocabulary properties of each dataset
5.2 Experiments
We hypothesize that if a dataset uses a wide va-riety of words to express the same ideas, sim-ilarity metrics that rely on the surface form of the sentence will be at a disadvantage compared to similarity metrics based in distributional se-mantics. Thus, word2vec, LSTM autoencoders, and skip-thoughts ought to perform better than then-gram-based methods and dependency count method when applied to CLUE, but should enjoy no advantage when applied to PAS.
We begin by comparing the performance of all similarity metrics on PAS and CLUE, using k-means for clustering. We then also examine their performance with MCL.
5.3 Results and Discussion
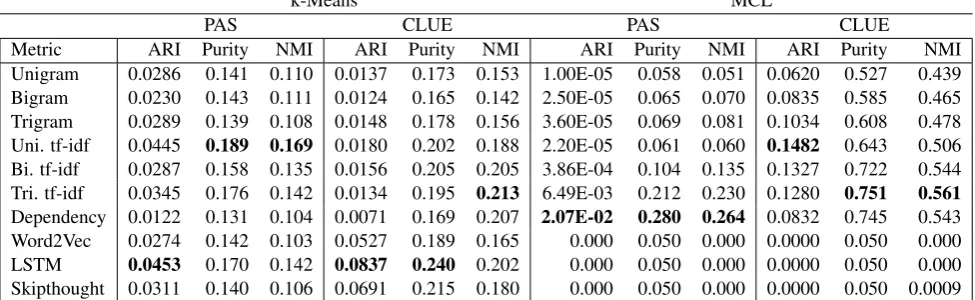
Table 2 compares the performance of all similar-ity metrics on PAS and CLUE using k-means and MCL. Using k-means on PAS, the unigram tf-idf similarity metric gives the strongest performance for purity and NMI and came in a close second for ARI. LSTM slightly outperformed the other similarity metrics on ARI, but had middle-of-the-road results on the other evaluations. Overall, the semantics-based similarity metrics gave reason-able but not exceptional ARI and purity results, but were at the low end on NMI. This is consis-tent with our hypothesis that when authors are not trying to express creativity by using a wider vo-cabulary, surface-based similarity metrics suffice.
For k-means on CLUE, the picture is quite different: the semantics-based similarity met-rics markedly outperformed any other similar-ity metric on ARI. LSTM also provides the best purity score, followed by skip-thought. The semantics-based metrics do not stand out for NMI, though. Based on these results, we conclude that semantics-based measures provide a signifi-cant advantage over traditional similarity metrics when using k-means on the wide-vocabulary, cre-ative CLUE.
When clustering with MCL, however, the semantics-based methods perform exceptionally poorly on both datasets. Interestingly, then -gram-based similarity metrics performed very well when paired with MCL on CLUE—outperforming the best of the k-means scores—while the same metrics performed terribly with MCL on PAS.
We hypothesize that the semantics-based sim-ilarity metrics produce less tightly clustered data
than the surface-form-based metrics do, and that this may make clustering difficult for some graph-based clustering methods. The next section de-scribes how we test this hypothesis.
6 Tightness of Clusters
6.1 Descriptive Statistics for Tightness Two pieces contribute to cluster tightness: the dataset itself and the choice of similarity metric. To illustrate, we represent each text with the vector for its similarity metric—for instance, the sum of its word2vec vectors or the unigram tf-idf vector— and reduce it to two dimensions using linear dis-criminant analysis. We plot five randomly selected gold standard clusters. Plots for unigram tf-idf and word2vec representations of PAS and CLUE are shown in Figures 1 and 2. These support the in-tuition that semantics-based similarity metrics are not as tightly clustered as n-gram-based metrics. Note also that the CLUE unigram tf-idf clusters appear tighter than the PAS unigram tf-idf clus-ters.
To quantify this, we compute modularity (New-man, 2004; New(New-man, 2006):5
Q= 1 2m
X
ij
Aij− k2imkj
δ(ci, cj) (5)
Aij is the edge weight between nodes i and j.
δ(ci, cj) indicates whether iand j belong to the
same cluster. mis the number of edges. ki is the
degree of vertexi, so kikj
2m is the expected number
of edges betweeniandjin a random graph. Thus, modularity is highest when nodes in a cluster are highly interconnected, but sparsely connected to nodes in different clusters. We use this statistic in an unconventional way, determining the modular-ity of the golden clusters.
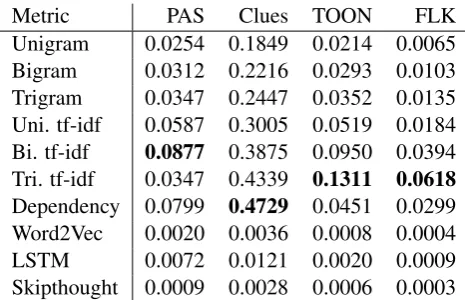
Table 3 shows the modularities for all four datasets using the unigram, trigram, unigram tf-idf, trigram tf-tf-idf, dependency, word2vec, and skipthoughts similarity metrics. As suggested by Figures 1 and 2, the CLUE surface-form-based similarities have the highest modularity by far. The surface-form-based similarities for all datasets have much higher modularity than any of the semantics-based similarities; indeed, the 5Newman (2010) notes that modularity for even a
k-Means MCL
PAS CLUE PAS CLUE
Metric ARI Purity NMI ARI Purity NMI ARI Purity NMI ARI Purity NMI Unigram 0.0286 0.141 0.110 0.0137 0.173 0.153 1.00E-05 0.058 0.051 0.0620 0.527 0.439 Bigram 0.0230 0.143 0.111 0.0124 0.165 0.142 2.50E-05 0.065 0.070 0.0835 0.585 0.465 Trigram 0.0289 0.139 0.108 0.0148 0.178 0.156 3.60E-05 0.069 0.081 0.1034 0.608 0.478 Uni. tf-idf 0.0445 0.189 0.169 0.0180 0.202 0.188 2.20E-05 0.061 0.060 0.1482 0.643 0.506 Bi. tf-idf 0.0287 0.158 0.135 0.0156 0.205 0.205 3.86E-04 0.104 0.135 0.1327 0.722 0.544 Tri. tf-idf 0.0345 0.176 0.142 0.0134 0.195 0.213 6.49E-03 0.212 0.230 0.1280 0.751 0.561
Dependency 0.0122 0.131 0.104 0.0071 0.169 0.207 2.07E-02 0.280 0.264 0.0832 0.745 0.543 Word2Vec 0.0274 0.142 0.103 0.0527 0.189 0.165 0.000 0.050 0.000 0.0000 0.050 0.000
LSTM 0.0453 0.170 0.142 0.0837 0.240 0.202 0.000 0.050 0.000 0.0000 0.050 0.000
[image:7.595.54.542.68.218.2]Skipthought 0.0311 0.140 0.106 0.0691 0.215 0.180 0.000 0.050 0.000 0.0000 0.050 0.0009
Table 2: A comparison of all similarity metrics on PAS and CLUE datasets, clustered using k-means and MCL. For all evaluations, higher scores are better.
Figure 1: Plots of unigram tf-idf (left) and word2vec (right) vectors representing five randomly selected clusters of CLUE: clues for words “ets,” “stay,” “yes,” “easel,” and “aha.”
Figure 2: Plots of unigram tf-idf (left) and word2vec (right) vectors representing five randomly selected clusters of PAS: im-ages containing “bus,” “boat,” “car,” “bird,” and “motorbike.”
semantics-based similarities rarely have modular-ity much higher than zero. Thus, we conclude both that CLUE is more tightly clustered than the other datasets and that surface-form-based mea-sures yield tighter clusters than semantics-based measures.
CLUE’s tight clustering could be due in part to its particularly short texts. Additionally, it might
reflect the semantics of the dataset: words that the clues hint at may be less similar to one another than the categories in PAS are to each other. For instance, some images in PAS’s “bus” category in-clude cars, and vice-versa.
yes-or-Metric PAS Clues TOON FLK
Unigram 0.0254 0.1849 0.0214 0.0065
Bigram 0.0312 0.2216 0.0293 0.0103
Trigram 0.0347 0.2447 0.0352 0.0135
Uni. tf-idf 0.0587 0.3005 0.0519 0.0184
Bi. tf-idf 0.0877 0.3875 0.0950 0.0394
Tri. tf-idf 0.0347 0.4339 0.1311 0.0618
Dependency 0.0799 0.4729 0.0451 0.0299
Word2Vec 0.0020 0.0036 0.0008 0.0004
LSTM 0.0072 0.0121 0.0020 0.0009
[image:8.595.66.299.61.211.2]Skipthought 0.0009 0.0028 0.0006 0.0003
Table 3: Modularity for all datasets
no question to surface-form-based metrics, but a question of degree to semantics-based ones. Ac-cording to semantics-based methods, “cat” is more similar to “feline” than it is to “dog,” but more similar to “dog” than to “motorcycle.” This creates some similarity between texts from different clus-ters, blurring the lines between them. Thus, “The man walks his dog” and “A woman with a cat” are entirely dissimilar according to surface form methods, but not according to the semantics-based measures. Even if the nodes in a cluster are highly interconnected, if the connections between nodes in different clusters are too strong, modularity will be low.
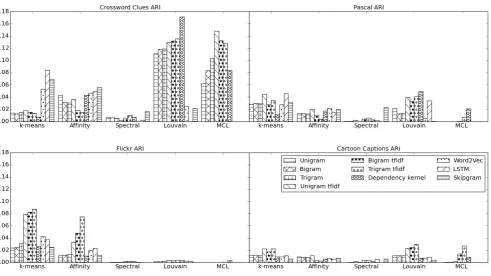
To determine whether cluster tightness influ-ences the best clustering method, we tested all clustering methods on all four datasets using unigram, trigram, unigram tf-idf, trigram tf-idf, word2vec, and skipthought similarity metrics.
6.2 Results and Discussion
As can be seen in Figure 3, the best ARI results by a large margin were those on the tightly clustered CLUE. Louvain, which provides the best ARI for CLUE, and MCL, which provides the second best, both performed most strongly when paired with the surface-form-based similarity metrics (n-gram counts, tf-idf, and dependency count), which had high modularity relative to the semantics-based metrics. Although CLUE also differs from the other datasets in that it has the shortest mean text length, text length by itself cannot explain the ob-served differences in performance, since the pat-tern of graph-based clustering methods working best with modular data is consistent within each dataset as well as between datasets.
CLUE is also the only dataset where the
semantics-based similarity metrics performed ex-ceptionally well with any of the clustering meth-ods. Recall from Table 1 that CLUE had a markedly wider vocabulary than any other dataset. This further supports our findings in Section 5.3 regarding how creativity affects the usefulness of semantics-based similarity metrics.
FLK, which had the lowest modularity, cannot be clustered by the spectral, Louvain, or MCL al-gorithms. K-means provides the strongest perfor-mance, followed by affinity propagation.
TOON has the worst ARI results. Its best-performing clustering methods are the graph-based Louvain and MCL methods. Both perform well only when paired with the most modular sim-ilarity metrics. Louvain seems less sensitive to modularity than MCL does. MCL’s best perfor-mance by far for TOON is when it is paired with trigram tf-idf, which also had the highest modular-ity; its performance when paired with the lower-modularity similarity metrics rapidly falls away. In contrast, Louvain fares reasonably well with the lowern-gram tf-idfs, which also had lower modu-larity than trigram tf-idf.
Louvain and MCL follow a similar pattern on PAS: both perform at their peak on the most mod-ular similarity metric (dependency), but Louvain handles slightly less modular similarity metrics nearly as well as the most modular one, while MCL quickly falters.
K-means’ performance is not correlated with modularity. This makes sense, as k-means is the only non-graph-based method. Methods like MCL, which is based on a random walk, may be stymied by too many highly-weighted paths between clusters; the random walk can too eas-ily reach a different neighborhood from where it started. But k-means relies on how close texts are to centroids, not to other texts, and so would be less affected.
The fact that k-means nevertheless performs poorly on TOON suggests that this dataset may be particularly difficult to cluster. An interesting test would be to measure inter-annotator agreement on TOON.
7 Conclusions and Future Work
distri-Figure 3: All similarity metrics and all clustering methods for the four datasets.
butional semantics outperformed those that relied on surface forms. We also showed that semantics-based methods do not provide a notable advantage when applying k-means to less creative datasets. Since traditional similarity metrics are often faster to calculate, use of slower semantics-based meth-ods should be limited to creative datasets.
Unlike most work on clustering short texts, we examined how the similarity metric interacts with the clustering method. Even for a creative dataset, if the underlying data is tightly clustered, the use of semantics-based similarity measures can actu-ally hurt performance. Traditional metrics applied to such tightly clustered data generate more mod-ular output that enables the use of sophisticated, graph-based clustering methods such as MCL and Louvain. When either the underlying data or the similarity metrics applied to it produce loose clus-ters with low modularity, the sophisticated graph clustering algorithms fail, and we must fall back on simpler methods.
Future work can manipulate datasets’ text prop-erties to confirm that a specific property is the cause of observed differences in clustering. Such work should alter the datasets TTR and NTTR while holding mean length of texts constant. A pilot effort to use word embeddings to alter the variety of vocabulary in a dataset has so far not
succeeded, but future experiments altering vocab-ulary width or modularity of a dataset and find-ing that the modified dataset behaved like natural datasets with the same properties could increase confidence in causality. Future work can also ex-plore finer clusters within these datasets, such as clustering CLUE by word sense of the answers and TOON by joke sense.
These results are a first step towards determin-ing the best way to cluster a new dataset based on properties of the text. Future work will explore further how the goals of short text authors translate into measurable properties of the texts they write, and how measuring those properties can help pre-dict which similarity metrics and clustering meth-ods will combine to provide the best performance.
Acknowledgments
[image:9.595.59.551.64.340.2]References
Somnath Banerjee, Krishnan Ramanathan, and Ajay Gupta. 2007. Clustering short texts using Wikipedia. InProceedings of the 30th Annual Inter-national ACM SIGIR Conference on Research and Development in Information Retrieval, pages 787– 788. ACM.
Pavel Berkhin. 2006. A survey of clustering data mining techniques. InGrouping Multidimensional Data, pages 25–71. Springer.
Vincent D. Blondel, Jean-Loup Guillaume, Renaud Lambiotte, and Etienne Lefebvre. 2008. Fast un-folding of communities in large networks. Jour-nal of statistical mechanics: theory and experiment, 2008(10):P10008.
Jianpeng Cheng and Dimitri Kartsaklis. 2015. Syntax-aware multi-sense word embeddings for deep com-positional models of meaning. arXiv preprint arXiv:1508.02354.
William E. Donath and Alan J. Hoffman. 1973. Lower bounds for the partitioning of graphs. IBM Journal of Research and Development, 17(5):420–425.
Marcelo Luis Errecalde, Diego Alejandro Ingaramo, and Paolo Rosso. 2010. A new anttree-based al-gorithm for clustering short-text corpora. Journal of Computer Science & Technology, 10.
Mark Everingham, Luc Van Gool, Christopher K. I. Williams, John Winn, and Andrew Zisserman. 2010. The PASCAL visual object classes (VOC) challenge. International Journal of Computer Vi-sion, 88(2):303–338.
Brendan J. Frey and Delbert Dueck. 2007. Clustering by passing messages between data points. Science, 315(5814):972–976.
Hua He, Kevin Gimpel, and Jimmy Lin. 2015. Multi-perspective sentence similarity modeling with con-volutional neural networks. InProceedings of the 2015 Conference on Empirical Methods in Natural Language Processing, pages 1576–1586.
Michael Heilman and Noah A. Smith. 2010. Tree edit models for recognizing textual entailments, para-phrases, and answers to questions. InHuman Lan-guage Technologies: The 2010 Annual Conference of the North American Chapter of the Associa-tion for ComputaAssocia-tional Linguistics, HLT ’10, pages 1011–1019, Stroudsburg, PA, USA. Association for Computational Linguistics.
Sepp Hochreiter and J¨urgen Schmidhuber. 1997. Long short-term memory. Neural Computation, 9(8):1735–1780.
Lawrence Hubert and Phipps Arabie. 1985. Compar-ing partitions. Journal of Classification, 2(1):193– 218.
Tom Kenter and Maarten de Rijke. 2015. Short text similarity with word embeddings. InProceedings of the 24th ACM International on Conference on Infor-mation and Knowledge Management, pages 1411– 1420. ACM.
Ben King, Rahul Jha, Dragomir R Radev, and Robert Mankoff. 2013. Random walk factoid annotation for collective discourse. InProceedings of the 51st Annual Meeting of the Association for Computa-tional Linguistics.
Ryan Kiros, Yukun Zhu, Ruslan R. Salakhutdinov, Richard Zemel, Raquel Urtasun, Antonio Torralba, and Sanja Fidler. 2015. Skip-thought vectors. InAdvances in Neural Information Processing Sys-tems, pages 3276–3284.
Matt Kusner, Yu Sun, Nicholas Kolkin, and Kilian Q. Weinberger. 2015. From word embeddings to docu-ment distances. InProceedings of the 32nd Interna-tional Conference on Machine Learning (ICML-15), pages 957–966.
Ding Liu and Daniel Gildea. 2005. Syntactic features for evaluation of machine translation. In Proceed-ings of the ACL Workshop on Intrinsic and Extrin-sic Evaluation Measures for Machine Translation and/or Summarization, pages 25–32.
Chenglong Ma, Weiqun Xu, Peijia Li, and Yonghong Yan. 2015. Distributional representations of words for short text classification. In Proceedings of NAACL-HLT, pages 33–38.
Tomas Mikolov, Ilya Sutskever, Kai Chen, Greg S. Cor-rado, and Jeff Dean. 2013. Distributed representa-tions of words and phrases and their compositional-ity. InAdvances in Neural Information Processing Systems, pages 3111–3119.
Mark E. J. Newman. 2004. Analysis of weighted net-works. Physical Review E, 70(5):056131.
Mark E. J. Newman. 2006. Modularity and commu-nity structure in networks. Proceedings of the Na-tional Academy of Sciences, 103(23):8577–8582.
Mark Newman. 2010. Networks: An Introduction. Oxford University Press.
Andrew Y. Ng, Michael I. Jordan, and Yair Weiss. 2001. On spectral clustering: Analysis and an al-gorithm. In Advances in Neural Information Pro-cessing Systems, pages 849–856. MIT Press.
Henry Petersen and Josiah Poon. 2011. Enhancing short text clustering with small external reposito-ries. InProceedings of the Ninth Australasian Data Mining Conference-Volume 121, pages 79–90. Aus-tralian Computer Society, Inc.
Vahed Qazvinian and Dragomir R. Radev. 2011. Learning from collective human behavior to intro-duce diversity in lexical choice. In Proceedings of the 49th Annual Meeting of the Association for Computational Linguistics: Human Language Tech-nologies - Volume 1, HLT ’11, pages 1098–1108, Stroudsburg, PA, USA. Association for Computa-tional Linguistics.
Dragomir R. Radev, Amanda Stent, Joel R. Tetreault, Aasish Pappu, Aikaterini Iliakopoulou, Agustin Chanfreau, Paloma de Juan, Jordi Vallmitjana, Ale-jandro Jaimes, Rahul Jha, and Robert Mankoff. 2015. Humor in collective discourse: Unsupervised funniness detection in the new yorker cartoon cap-tion contest. CoRR, abs/1506.08126.
Aniket Rangrej, Sayali Kulkarni, and Ashish V. Ten-dulkar. 2011. Comparative study of clustering tech-niques for short text documents. In Proceedings of the 20th International Conference Companion on World Wide Web, WWW ’11, pages 111–112, New York, NY, USA. ACM.
Cyrus Rashtchian, Peter Young, Micah Hodosh, and Julia Hockenmaier. 2010. Collecting image annota-tions using amazon’s mechanical turk. In Proceed-ings of the NAACL HLT 2010 Workshop on Creating Speech and Language Data with Amazon’s Mechan-ical Turk, pages 139–147. Association for Computa-tional Linguistics.
Kevin Dela Rosa, Rushin Shah, Bo Lin, Anatole Ger-shman, and Robert Frederking. 2011. Topical clus-tering of tweets. Proceedings of the ACM SIGIR: SWSM.
Frane ˇSari´c, Goran Glavaˇs, Mladen Karan, Jan ˇSnajder, and Bojana Dalbelo Baˇsi´c. 2012. Takelab: Systems for measuring semantic text similarity. In Proceed-ings of the First Joint Conference on Lexical and Computational Semantics, pages 441–448. Associ-ation for ComputAssoci-ational Linguistics.
Jianbo Shi and Jitendra Malik. 2000. Normalized cuts and image segmentation. Technical report.
Prajol Shrestha, Christine Jacquin, and B´eatrice Daille, 2012. Computational Linguistics and Intelligent Text Processing: 13th International Conference, CI-CLing 2012, New Delhi, India, March 11-17, 2012, Proceedings, Part II, chapter Clustering Short Text and Its Evaluation, pages 169–180. Springer Berlin Heidelberg, Berlin, Heidelberg.
Richard Socher, Eric H. Huang, Jeffrey Pennin, Christopher D. Manning, and Andrew Y. Ng. 2011. Dynamic pooling and unfolding recursive autoen-coders for paraphrase detection. In Advances in
Neural Information Processing Systems, pages 801– 809.
Kai Sheng Tai, Richard Socher, and Christopher D. Manning. 2015. Improved semantic representa-tions from tree-structured long short-term memory networks. arXiv preprint arXiv:1503.00075.
Yun Tian, Haisheng Li, Qiang Cai, and Shouxiang Zhao. 2010. Measuring the similarity of short texts by word similarity and tree kernels. In Informa-tion Computing and TelecommunicaInforma-tions (YC-ICT), 2010 IEEE Youth Conference on, pages 363–366. IEEE.
Stijn Van Dongen. 2000. Graph Clustering by Flow Simulation. Ph.D. thesis, University of Utrecht.
Jun Wang, Yiming Zhou, Lin Li, Biyun Hu, and Xia Hu. 2009a. Improving short text clustering perfor-mance with keyword expansion. In The Sixth In-ternational Symposium on Neural Networks (ISNN 2009), pages 291–298. Springer.
Kai Wang, Zhaoyan Ming, and Tat-Seng Chua. 2009b. A syntactic tree matching approach to finding sim-ilar questions in community-based qa services. In Proceedings of the 32nd International ACM SIGIR Conference on Research and Development in Infor-mation Retrieval, SIGIR ’09, pages 187–194, New York, NY, USA. ACM.
Yu Wang, Lihui Wu, and Hongyu Shao. 2014. Clus-ters merging method for short texts clustering. Open Journal of Social Sciences, 2(09):186.
Peng Wang, Jiaming Xu, Bo Xu, Cheng-Lin Liu, Heng Zhang, Fangyuan Wang, and Hongwei Hao. 2015. Semantic clustering and convolutional neural net-work for short text categorization. InProceedings of the 53rd Annual Meeting of the Association for Computational Linguistics and the 7th International Joint Conference on Natural Language Processing, volume 2, pages 352–357.
Matthijs J. Warrens. 2008. On the equivalence of co-hen’s kappa and the hubert-arabie adjusted rand in-dex. Journal of Classification, 25(2):177–183.
Jiaming Xu, Peng Wang, Guanhua Tian, Bo Xu, Jun Zhao, Fangyuan Wang, and Hongwei Hao. 2015. Short text clustering via convolutional neural net-works. In Proceedings of NAACL-HLT, pages 62– 69.
Xiaohui Yan, Jiafeng Guo, Shenghua Liu, Xue-qi Cheng, and Yanfeng Wang. 2012. Clustering short text using ncut-weighted non-negative matrix fac-torization. In Proceedings of the 21st ACM Inter-national Conference on Information and Knowledge Management, pages 2259–2262. ACM.