Munich Personal RePEc Archive
The Impact of Liquidity Risk on Internal
and External Factors
Abdul Latif, Nurul Atikah
Universiti Utara Malaysia
18 November 2019
Online at
https://mpra.ub.uni-muenchen.de/97222/
1
The Impact of Liquidity Risk on Internal and External Factors
Nurul Atikah Abdul Latif
Universiti Utara Malaysia
1.0 INTRODUCTION
1.1Introduction
In this chapter, we describe the overview of the industry and defined the problem
statement for this study. We also stated the research objective, research question
and also the scope of the study.
1.2Overview of Industry
Target Corporation was started in Minnesota in 1902. Target Corporation are
known as a business that offer their customers everyday essentials and
fashionable, differentiated merchandise at discounted prices. They have supply
chain and technology, devotion to innovation, loyalty offerings such as REDcard
Rewards and Cartwheel, and disciplined approach to managing their business and
investing in future growth. This also can support to deliver a preferred shopping
experience to their guests. Target Corporation operated as a single segment
designed to allow guests to purchase products seamlessly in stores or through their
digital channels.
1.3Problem Statements
This research is very important to the Target Corporation, it is because, they want
to know their performance of the company such as the profitability, liquidity risk,
operational risk, market risk, credit risk and also to know their corporate
governance index. They also can make a planning if they know what kinds of
things that will influence their performance of the company. So the problem is
they can face a bankruptcy if they do not know what are influenced to their
2 1.4Research Objective
The objectives of this study:
1. To investigate the firm-specific (internal) factors towards performance
2. To investigate the macroeconomic (external) factors towards performance
3. To investigate both internal and external factors towards performance
1.5 Research Questions
1. Does any relationship exist between internal factors and performance?
2. Does any relationship exist between external factors and performance?
3. Does any relationship exist between both factors and performance?
1.6 Scope of Study
The study sample is Target Corporation of e-commerce industry. According to the
calculation of the financial ratios, data are taken from five year of annual reports in
3 2.0LITERATURE REVIEW
2.1Introduction
In chapter two, we describe about the background of the company. Then we
describe about the literature review of Corporate Governance, Credit Risk,
Operational Risk, Liquidity Risk, Market Risk and Performance Ratio.
2.2Background Company
Target Corporation (Target) is a general merchandise retailer selling products through
its stores and digital channels. In other words, it’s like a general merchandise stores
that offer an edited food assortment, including perishables, dry grocery, dairy and
frozen items. Its known as a American mass-market retail company operating
large-scale food and general-merchandise discount stores. Target Corporation owned brands
include Archer Farms, Market Pantry, Sutton & Dodge, Art Class, Merona,
Threshold, Ava & Viv, Pillowfort, Room Essentials, Wine Cube, Cat & Jack, Simply
Balanced and Wondershop.
Target Corporation is the eighth-largest retailer in the United States. Founded
by George Dayton and headquartered in Minneapolis. In June 1902, Target
Corporation was named Goodfellow Dry Goods, then its renamed to the Dayton’s Dry Goods Company in 1903 and become Dayton Company in 1910. After that, in 1969,
Target Corporation was merging with the J.L. Hudson Company and renamed to the
Dayton-Hudson Corporation. Lastly, in 2000, the parent company was renamed this
company as a Target Corporation.
In the management of target Corporation, the majority of the company's
non-executive directors do not own a single share of the company's common stock. Then,
The restricted stock units issued to directors are not actual shares, have no voting
rights, and are typically settled at the end of a director's service. The result is that a
majority of the company's board of directors may never own outright a share of the
company's stock. They also believe that Target would benefit from enhanced
corporate governance practices by requiring nominees have at least some level of
4
According to the corporate governance principle which is accountability,
transparency, independence, fairness and sustainability, the target corporation have all
the principles except independence. There have a accountability because the company
always meeting with the board to make any decision. Then, they have transparency
because of the have hired the audit committee in their management of the company.
After that, they have fairness because of they have female in their board of directors.
Lastly, they have sustainability because of they have did a program such as help their
customer to get profits.
Literature review
2.3 Corporate Governance
Corporate Governance is really important to know whether the company have a
corporate governance principle or they follow the right way or not in manage their
company. Corporate governance also will protect the management of every company
from doing a mistake in manage the company. Then, corporate governance also can
make sure the customer have their right to make a report or decision is buying product
such as purchase decision, customer services and future purchases. It is because, all
the customer will always stand for price and quality in product. After that, corporate
governance also can protect the company from doing illegal things in their
management.
2.4 Credit Risk
Based on the article from Tim Xiao, Pricing the counterparty credit risk is a relatively
new area of derivatives modeling and trading. Credit value adjustment (CVA) allows
us to quantify counterparty credit risk as a single, measurable Profit & Loss number.
Interest Rate Swap (IRS) is a typical bilateral contingent contract that can be either an
asset or a liability to each party during the life of the contract. Definition of CVA is
the difference between the risk-free trade value and the true or (risky or defaultable)
5
Sundaresan (1991), Longstaff and Schwartz (1993), and Tang and Li (2007) simplify
the problem by considering the IRS as a simple exchange of loans (receivable parts
and payable parts). So the authors are focusing on the valuation of defaultable IRS’s
in which both parties are exposed to credit risk.
Based on Waemustafa and Sukri (2013), they said that we need to understand how
credit risk is formed in Islamic banks and conventional banks considering internal and
external factors determinants. They suggest that banks assets mainly consist of loan
while liabilities are deposit payable where any mismatch in asset and liability would
contribute to liquidity risk and credit risk.
2.5 Operational Risk
The operational risk are defined that uncertainty risk that might happen associated
with financial institution and most specifically in case of banks in term of operational.
In addition, the operational risk arises due to the human error, financial fraud and
natural disasters.
Operational risk management is defined as a methodology for organizations looking
to put into place real oversight and strategy when it comes to managing risk.
Based on the article from Xie Zhuang, he defined that operational risk management is
identifies, measures, supervises, controls and reports the operational risk of the whole
enterprise and for the financial service industry, especially for financial intermediaries
such as banks, risk is always an inevitable thing to carry out business.
2.6 Liquidity Risk
Liquidity risk is the hazard that an organization or bank might be not able meet short
term budgetary request. This is usually happen because of the powerlessness to
change over a security or hard asset of money without lost capital. Nikolaou stated
that three primary liquidity thoughts, namely central bank liquidity, market liquidity
6
Deep and Schaefer (2004) introduced that liquidity transformation (LT) gap which
was expressed as (Liquid liabilities -Liquid assets)/total assets. They considered
maturity to define liquidity of both assets as well as liabilities.
Steffen, Hackethal, and Tyrell (2010) measured liquidity creation by German Banks
and also determined the factors affecting liquidity creation by using multivariate
dynamic panel regression and differentiated between macroeconomic factors and
firms’ specific factors.
2.7 Market Risk
In a market, some customers are “captive” to particular sellers while others choose
freely among alternative offers. Sellers need to discriminate with the consumer
captive. Because such discrimination is clearly bad for the captives because they are
monopolized, but competition then prevails for the custom of non-captives. In other
hand, captives get some benefit of competition, but competition is weakened by their
presence, making the net effect unclear.
Based on this article, they worry about employment impacts of the current
technological that might increase a market risk. Some firms can move offshore as a
whole, current technological change allows to split the workplace and even the
operation of the different tasks of occupations (Weil, 2014). Automation and
offshorability have the potential to eliminate and deeply transform many jobs in the
near future across the world.
2.8 Performance Ratio
A company’s performance is one of the important guiding to determine whether the
company is doing well or not. The performance of a firm is affected by the traditional
portfolio theory, diversification or modern corporate finance theory, portfolio
specialization has been widely discussed by the finance and banking field recently.
Based on this article, the company Telekom Malaysia Berhad (TM) explain the
performance by using financial ratio to measure the risk of the company. Performance
is one of the crucial indicator to determine whether the company is operating well and
7
Maxis Berhad stated that by having a good corporate governance structure, Maxis will
be able to perform better when comparing to its competitors. Different types of
committee within the corporate will improve the efficiency and independence of the
company and it will also helps the company to excel in financial risk management.
2.9 The importance of Corporate Governance
Corporate Governance is important to give role for the Audit Committee. Audit
Committee are play role in transmitting financial results to the general public, the
audit committee serves as representative of shareholder interests and is required to
facilitate a process whereby management, external auditors and the chief executive
can be questioned and held to account. Then, Corporate Governance help the
contribution of External Auditors to resolve agency problems such as agent
relationship, whereby owners have an interest in maximising the value of their shares.
In addition, corporate governance is important for fair values and for the finance
theory which is the external auditors need to use fair value measures to effectively
8 3.0 METHODOLOGY
3.1Introduction
Methodology is defined as the systematic, theoretical analysis of the methods
applied to a field of study. Methodology also stated as a way to find out the result
of a given problem on a specific matter or problem that is also referred as research
problem. Research methodology is important as a means to understand various
issues to solve the problem by collect and analysed the data.
3.2Data and Sample
In this study, we used the ratio analysis on the data from the sample which is
the company of Target Corporation. The analysis are be run by using the data
from the company’s annual report which is ratio analysis for 5 years started from
year 2014 until year 2018 such as the company’s performance, credit risk, liquidity risk, market risk and so on.
3.3Statistical Technique
For this research, we have chosen Target Corporation. All the data from annual
report (from 2014 to 2018) which is used the data in income statement and the
balance sheet in the annual report to calculate all the. After all the ratio has been
calculated, we used the Social Science Statistics Package (SPSS) with the 25th
edition to analyse the data. The technique that we used in SPSS is linear
regression to analyse the variables between the independent variables and
dependent variables.
3.4Data Analysis
In this research, all the variables we used from the ratio analysis are 11 bank
specifics variables and 3 macroeconomic variables. There have the Corporate
Governance Index (CGI), bank specifics variables and also the macroeconomic
variables. It is used as the independent variables. Then, the current ratio is used as
9 Variables Description
We used the multiple regression technique to determine the effect of independent
variables on the dependent variables. The regression technique will show the influence of
independent variables on the dependent variable. There are the formulas of multiple
regression:
LR = 0 + 1ROA + 2QR + 3ACP + 4DTI + 5OPR + 6OPM + 7CGI + ....Equation 1
LR = + GDP + INF + UNPL + ………Equation 2
LR = + 1ROA + 2QR + 3ACP + 4DTI + 5OPR + 6OPM + 7CGI + 8GDP +
9INF + 10UNPL + ………..Equation 3 Firm Specific Variables
Macroeconomics Variables
Corporate Governance Index
Current Ratio
[image:11.595.106.532.91.310.2]Independent Variables (IV) Dependent Variables (DV)
10 Table 3.1 Measurement of Variables
No Variables Notation Measurement
1 Return on Assets ROA
2 Current Ratio CR
3 Quick Ratio QR
4 Average
Collection Period
ACP
5 Debt-to-Income DTI
6 Operational Ratio
OPR
7 Operational Margin
OPM
8 Corporate Governance
Index
CGI The following items:
i. Accountability
ii. Transparency
iii. Independence
iv. Fairness
v. Sustainability
9 Gross Domestic GDP Economic Growth 10 Inflation INF Consumer Price Index
11 Unemployment UNPL The Annual Percentage of Unemployment
3.5Statistical Package for Social Sciences (SPSS)
Based on this study, we used IBM SPSS 25th edition to analyse the data for the
results. IBM SPSS is known as the world’s leading statistical software used to solve business and research problems by means of ad-hoc analysis, hypothesis testing, and
predictive analytics. It is because the IBM SPSS is used by organization to understand
11
conclusions. However, in this study, IBM SPSS statistics are used to analyse the
correlation between linear regression and variables based on the data obtained in
12 4.0 FINDINGS AND ANALYSIS
4.1 Introduction
The researchers used the financial statement analysis to identify the trend of the
companies by comparing the ratios within five years period. In the company’s annual report
which is in financial statement, there have three main components namely income statement,
balance sheet and cash flow statement. In this study, the researchers allowed to measure the
performance, liquidity risk, credit risk, operational risk and also market risk of the company.
[image:14.595.75.433.374.602.2]4.2 Trend Analysis 4.2.1 Performance
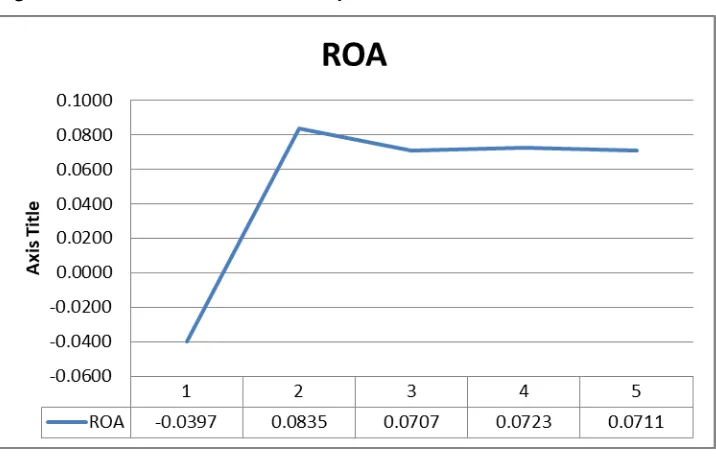
Figure 4.1 Return on asset for each year
The chart above shows the Return on Assets (ROA) ratio for Target Corporation. The ROA
are used to measure the profitability and also the performance of each company. The higher
the ROA will show that the company are efficient in using their assets to generate revenue.
Based on the graph above, we can conclude that the company have a good profitability in
year 2015 with 8.35%. The company are efficient in year 2015 to generate revenue by using
the assets. However, the company got a bad performance in year 2014 because their ROA is
13
their assets. In the latest year which is 2018, the performance is quite good because they have
ROA ratio 7.11%. This means that the company can generate revenue 7.11% by using their
assets.
[image:15.595.73.435.213.434.2]4.2.2 Liquidity Risk
Figure 4.2 Current ratio for each years
Liquidity risk occurs when investors, companies, or financial institutions are unable to
meet their short-term debt obligations. Liquidity risk will be occurs when company unable to
convert the assets into cash on the spot. We calculate the current ratio to analyse the liquidity
risk. According to the chart above, the current ratio for Target Corporation in 5 years are
highest in 2015 with ratio 1.1609 times. So this means that the company’s current asset in 2015 were RM1.1609 to cover the current liabilities of RM1. However, the liquidity risk
become higher in 2018 because the current ration in 2018 is only 0.9608 times, lower than 1.
This means that the current asset in Target Corporation cannot cover the current liabilities
14 4.2.3 Credit Risk
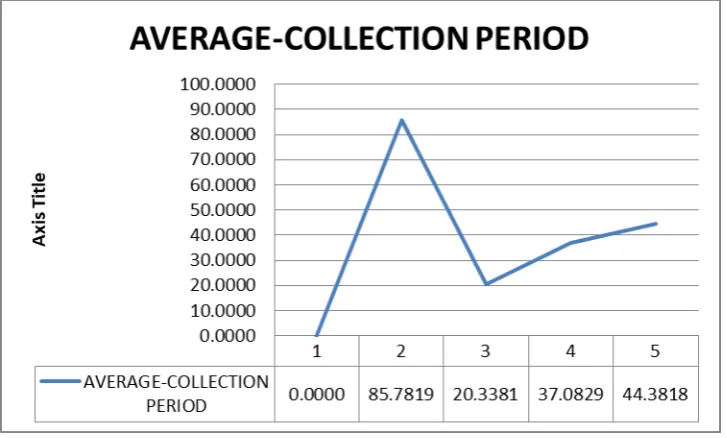
Figure 4.3 Average Collection Period for each year
Credit risk will be occur when the borrower cannot willing to pay back the amount that they
borrow. Credit risk is measured by using the average of the company in 5 years period. In this
ratio, the longer the average collection period, the higher the credit risk. So based on the chart
above, the longer the average collection period is occur in 2015 which is 85.7819. so 2015 is
a higher credit risk for target company because the average that they can collect from the
borrower in about 85 days. However, in 2016, The average collection period are decrease
strongly to 20.3381. This year shown a good average collection period which is only 20 days.
But, in the latest years which is 2018, the ratio increase to 44.3818 or 44 days but it is still
15 4.2.4 Operational Risk
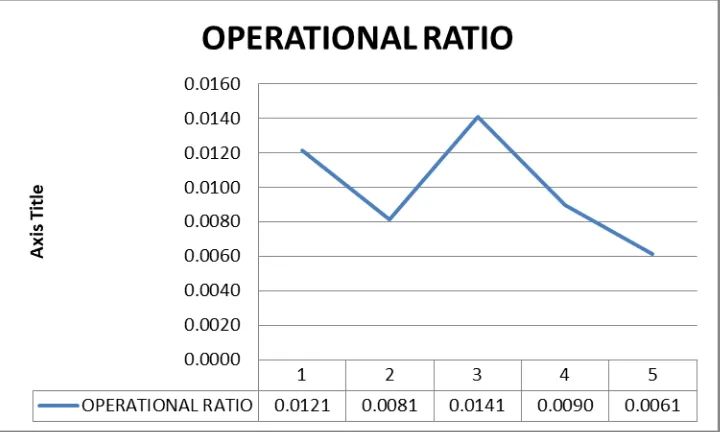
Figure 4.4 Operating Ratio for each years
Operational risks will be happen if the failure of managements, systems, processes,
personnel, and external events. The serious risks may be occur if they are not manage and
control the operational risks properly. We calculated the average operating rate within five
years period to measure the operational risk. Based on the graph above, we can see that the
average of the operating rate for 5 years is 0.99%. we can say that this Target Corporation
have a good management in operational risk because they on used 0.99% of company income
for operating expenses. The company have the lowest operational ratio in 2018 which is only
0.61%. this means that the company are efficient because have a lower operating rate which
16 4.2.5 Market Risk
Figure 5 Macroeconomic factors
Market risk are also called systematic risk which is the risk without diversification. It is
because the market risk cannot be control by the company which mean the economy of the
country will control the market risk. The changes of Gross Domestic Product (GDP),
Inflation and also the Interest rate are some of the component of market risk. GDP is used to
measure the monetary value of a country's goods and services generated within a year. High
inflation is not good for the county because affect the value of the currency and it will affect
the business of the company. So based on the graph above, it show the upward and downward
trends. Then, there have a higher inflation in two years which is in 2015 and 2018 with 2.9%
of GDP.it is shown that the country have a bad economic.
In inflation rates, it show a quite similar trends to GDP which is upward and downward
trends. Based on the graph, the country have a higher inflation started from 2016 2017 and
2018 with the rates 2.2%, 2.2% and 2%. As we can see, the country still cannot solve the
problem of inflation during that 3 years. In addition, Interest rates directly affect a country’s inflation rate because the companies difficult to issue more bonds to support their business
17 4.2.6 Corporate Governance Index (CGI)
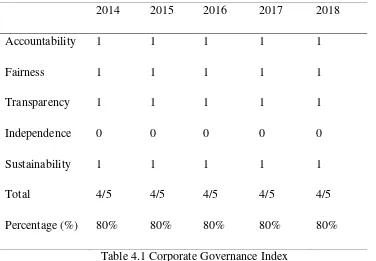
3.1.1 Corporate Governance Index
2014 2015 2016 2017 2018
Accountability 1 1 1 1 1
Fairness 1 1 1 1 1
Transparency 1 1 1 1 1
Independence 0 0 0 0 0
Sustainability 1 1 1 1 1
Total 4/5 4/5 4/5 4/5 4/5
[image:19.595.103.479.131.392.2]Percentage (%) 80% 80% 80% 80% 80%
Table 4.1 Corporate Governance Index
Corporate Governance index is used to measure whether the company have a compliance in
Corporate Governance Index there have 5 variables under the corporate governance
principles which is accountability, fairness, transparency, independence and sustainability. In
roughly, the accountability is measured if the company use a meeting in organization to
manage or to make any decision, means that the company is accountability. Then, the
transparency can be measured as 1 if the company have audit committee, if there have the
audit committee means that the company have transparency. The independence of the
company can be measured if the company have more than 50 of non-executive in the board of
directors. Fairness can be measured if there have a female on board of directors. Lastly, the
sustainability can be measure as 1 if the company have an activity of goodness such as
charity, CSR, green technology and so on.
Based on this company, there have all the corporate governance principle in their
company except Independence. It is because they do not have more than 50 in their board of
18 4.3 Data Analysis
4.3.1 Coefficients table
Coefficientsa Model Unstandardized Coefficients Standardized Coefficients
t Sig.
95.0% Confidence
Interval for B Collinearity Statistics
B
Std.
Error Beta
Lower
Bound
Upper
Bound Tolerance VIF
1 (Constant) .571 .071 8.014 .004 .344 .798
QUICK
RATIO
1.385 .216 .965 6.420 .008 .699 2.072 1.000 1.000
2 (Constant) .372 .038 9.779 .010 .208 .536
QUICK
RATIO
.948 .093 .660 10.183 .010 .547 1.348 .409 2.445
OPERATI
NG
MARGIN
6.271 1.025 .397 6.120 .026 1.862 10.680 .409 2.445
[image:20.595.73.596.163.512.2]a. Dependent Variable: CURRENT RATIO
Table 4.2 Coefficients
Based on the table of regression coefficient in table 4.3 above, Current Ratio (CR) is
shown as dependent variable, there is two variables that relevant which is Quick Ratio and
Operating Margin. P-value is used to determine the significant between the dependent
variable and independent variables. The p-value <0.001 has the most significant to the
dependent variable and followed by value <0.05 which has moderate significant and
p-value < 0.10 has the least significant. So based on the table above, independent variable of
quick ratio, there have a positive correlated and moderate significant because the p-value
<0.05 which is 0.026. The operating margin also same as quick ratio which is have a positive
19 4.3.2 Model Summary and Anova
Model Summaryc
Model R R Square
Adjusted R
Square
Std. Error of the
Estimate Durbin-Watson
1 .965a .932 .910 .034336065921
295
2 .998b .997 .993 .009468614316
739
1.597
a. Predictors: (Constant), QUICK RATIO
b. Predictors: (Constant), QUICK RATIO, OPERATING MARGIN
c. Dependent Variable: CURRENT RATIO
ANOVAa
Model Sum of Squares df Mean Square F Sig.
1 Regression .049 1 .049 41.217 .008b
Residual .004 3 .001
Total .052 4
2 Regression .052 2 .026 289.731 .003c
Residual .000 2 .000
Total .052 4
a. Dependent Variable: CURRENT RATIO
b. Predictors: (Constant), QUICK RATIO
[image:21.595.68.443.576.655.2]c. Predictors: (Constant), QUICK RATIO, OPERATING MARGIN
Table 4.3 Model Summary and Anova for model 1
Model Summaryb
Model R R Square
Adjusted R
Square
Std. Error of the
Estimate Durbin-Watson
1 .715a .511 -.958 .159724509599
516
2.840
a. Predictors: (Constant), STDV, GDP, InterestRate
20 ANOVAa
Model Sum of Squares df Mean Square F Sig.
1 Regression .027 3 .009 .348 .811b
Residual .026 1 .026
Total .052 4
a. Dependent Variable: CURRENT RATIO
[image:22.595.73.473.92.170.2]b. Predictors: (Constant), STDV, GDP, InterestRate
Table 4.4 Model Summary and Anova for model 2
Model Summarye
Model R R Square
Adjusted R
Square
Std. Error of the
Estimate Durbin-Watson
1 .965a .932 .910 .034336065921
295
2 .998b .997 .993 .009468614316
739
3 1.000c 1.000 1.000 .000670994677
706
4 1.000d 1.000 . . 3.500
a. Predictors: (Constant), QUICK RATIO
b. Predictors: (Constant), QUICK RATIO, OPERATING MARGIN
c. Predictors: (Constant), QUICK RATIO, OPERATING MARGIN , InterestRate
d. Predictors: (Constant), QUICK RATIO, OPERATING MARGIN , InterestRate, GDP
e. Dependent Variable: CURRENT RATIO
ANOVAa
Model Sum of Squares df Mean Square F Sig.
1 Regression .049 1 .049 41.217 .008b
Residual .004 3 .001
Total .052 4
2 Regression .052 2 .026 289.731 .003c
Residual .000 2 .000
Total .052 4
3 Regression .052 3 .017 38594.948 .004d
Residual .000 1 .000
Total .052 4
21
Residual .000 0 .
Total .052 4
a. Dependent Variable: CURRENT RATIO
b. Predictors: (Constant), QUICK RATIO
c. Predictors: (Constant), QUICK RATIO, OPERATING MARGIN
d. Predictors: (Constant), QUICK RATIO, OPERATING MARGIN , InterestRate
[image:23.595.76.484.72.107.2]e. Predictors: (Constant), QUICK RATIO, OPERATING MARGIN , InterestRate, GDP
Table 4.5 Model Summary and Anova for model 3
As we know, R-squared is a goodness-of-fit measure for linear regression models.
This statistic indicates the percentage of the variance in the dependent variable that the
independent variables explain collectively. The used of R-squared is to measures the strength
of the relationship between your model and the dependent variable (Jim frost).
The larger the R-squared, the better the regression model fits your observations. So,
based on the model 1, the R-squared shows 99.7%. The results obtained from the dependent
and independent variables which is the current ratio as a dependent and the firm specific
variables as the independent variables. However, for the model 2, we take the
macroeconomic factors as the independent variables. So, based on table for model 2, the
R-squared for model 2 is only 51.1%. We can conclude that the company have faced the
macroeconomic problem such as the inflation and GDP. In model 3, there have a perfect
R-squared which is 100% R-R-squared. This means that, the company will become better if we
use all the variables as the independent variables. So, the macroeconomic factors is a main
factors that can change the performance of the company. In ANOVA, if the p-value is greater
than the significance level, its means that the differences between the means are not
statistically significant. So based on the table model 3, the ANOVA is 0.004. It is means that
22
5.0 CONCLUSION AND RECOMMENDATION
5.1 CONCUSION
In conclusion, the objective of this study is we can know the relationship
between the dependent variables and independent variables which is the current ratio
as the dependent and the firm specific variables, macroeconomic variable and
corporate governance index as the independent variables. Then, we can know the
effect and also the factors that can affect the performance of the company. We also
can know how macroeconomic can influence the performance or profitability of the
company. So, for the overall review, the macroeconomic factor is a main factor that
give a big impact to the company performance.
5.2 RECOMMENDATION
For the recommendation for the future research, we can add more independent
variables to get better and accurate results. We also can do a research for more years
to see the better trends of the ratio. It will also give the result more accurate. For the
corporate governance index (CGI), we can add more variables for the principle of the
corporate governance. So, the researcher can have more detailed about the corporate
23 APPENDIX
Correlations
CURR
ENT
RATIO ROA
QUICK RATIO AVERAG E-COLLECT ION PERIOD DEBT TO INCO ME OPER ATION AL RATIO OPER ATING MARG
IN GDP Inflation
Interes
tRate Exch
ange
Rate STDV
Pearso n Correl ation CURR ENT RATIO
1.000 .690 .965 .617 .202 .143 .905 -.139 -.031 -.438 . .325
ROA .690 1.00
0
.656 .852 -.469 -.454 .560 .099 .403 .147 . .874
QUICK
RATIO
.965 .656 1.000 .456 .322 .272 .769 -.345 .172 -.354 . .367
AVER AGE-COLL ECTIO N PERIO D
.617 .852 .456 1.000 -.623 -.652 .701 .541 -.092 .013 . .580
DEBT
TO
INCO
ME
.202 -.469 .322 -.623 1.000 .980 .100 -.733 -.125 -.618 . -.539
OPER
ATION
AL
RATIO
.143 -.454 .272 -.652 .980 1.000 .043 -.820 -.040 -.634 . -.456
OPER
ATING
MARG
IN
.905 .560 .769 .701 .100 .043 1.000 .124 -.401 -.627 . .123
GDP -.139 .099 -.345 .541 -.733 -.820 .124 1.000 -.516 .293 . -.085
Inflatio
n
-.031 .403 .172 -.092 -.125 -.040 -.401 -.516 1.000 .579 . .734
Interes
tRate
-.438 .147 -.354 .013 -.618 -.634 -.627 .293 .579 1.000 . .408
Excha
ngeRat
e
. . . 1.00
0
24
STDV .325 .874 .367 .580 -.539 -.456 .123 -.085 .734 .408 . 1.000
Sig.
(1-tailed)
CURR
ENT
RATIO
. .099 .004 .134 .372 .409 .017 .412 .481 .230 .000 .297
ROA .099 . .115 .033 .213 .221 .163 .437 .251 .407 .000 .026
QUICK
RATIO
.004 .115 . .220 .299 .329 .064 .285 .391 .280 .000 .272
AVER AGE-COLL ECTIO N PERIO D
.134 .033 .220 . .131 .116 .093 .173 .441 .491 .000 .153
DEBT
TO
INCO
ME
.372 .213 .299 .131 . .002 .436 .079 .420 .133 .000 .174
OPER
ATION
AL
RATIO
.409 .221 .329 .116 .002 . .473 .044 .474 .125 .000 .220
OPER
ATING
MARG
IN
.017 .163 .064 .093 .436 .473 . .421 .252 .129 .000 .422
GDP .412 .437 .285 .173 .079 .044 .421 . .187 .316 .000 .446
Inflatio
n
.481 .251 .391 .441 .420 .474 .252 .187 . .153 .000 .079
Interes
tRate
.230 .407 .280 .491 .133 .125 .129 .316 .153 . .000 .248
Excha
ngeRat
e
.000 .000 .000 .000 .000 .000 .000 .000 .000 .000 . .000
STDV .297 .026 .272 .153 .174 .220 .422 .446 .079 .248 .000 .
N CURR
ENT
RATIO
5 5 5 5 5 5 5 5 5 5 5 5
ROA 5 5 5 5 5 5 5 5 5 5 5 5
QUICK
RATIO
25 AVER
AGE-COLL
ECTIO
N
PERIO
D
5 5 5 5 5 5 5 5 5 5 5 5
DEBT
TO
INCO
ME
5 5 5 5 5 5 5 5 5 5 5 5
OPER
ATION
AL
RATIO
5 5 5 5 5 5 5 5 5 5 5 5
OPER
ATING
MARG
IN
5 5 5 5 5 5 5 5 5 5 5 5
GDP 5 5 5 5 5 5 5 5 5 5 5 5
Inflatio
n
5 5 5 5 5 5 5 5 5 5 5 5
Interes
tRate
5 5 5 5 5 5 5 5 5 5 5 5
Excha
ngeRat
e
5 5 5 5 5 5 5 5 5 5 5 5
26 REFERENCE
Liquidity and its determinants (20 May 2018) Basir, Yana. Retrieved from:
file:///C:/xampp/htdocs/pendaftaran_acara/images/corporate%20governance/liquidity%20risk
/MPRA_paper_86863.pdf
Estimation of liquidity created by banks in India (5 March 2019) Sinha, Pankaj and Grover,
Naina. Retrieved from:
file:///C:/xampp/htdocs/pendaftaran_acara/images/corporate%20governance/liquidity%20risk
/MPRA_paper_92563.pdf
Systematic and Unsystematic Risk Determinants of Liquidity Risk Between Islamic and
Conventional Bank (2016) Waeibrorheem Waemustafa, Suriani Sukri. Retrieved from:
file:///C:/xampp/htdocs/pendaftaran_acara/images/corporate%20governance/liquidity%20risk
/Systematic%20and%20Unsystematic%20Risk%20Determinants%20of%20Liquidity%20Ris
k%20Between%20Islamic%20and%20Conventional%20Banks[#354646]-366168.pdf
Bilateral Defaultable Financial Derivatives Pricing and Credit Valuation Adjustment (1
March 2019) Xiao, Tim. Retrieved from:
file:///C:/xampp/htdocs/pendaftaran_acara/images/corporate%20governance/credit%20risk/M
PRA_paper_94135.pdf
Pricing Interest Rate Swap Subject to Bilateral Counterparty Risk (30 May 2019) Xiao, Tim.
Retrieved from:
file:///C:/xampp/htdocs/pendaftaran_acara/images/corporate%20governance/credit%20risk/M
27
Discriminating Against Captive Customers (8 February 2019) Armstrong, Mark and Vickers,
John. Retrieved from:
file:///C:/xampp/htdocs/pendaftaran_acara/images/corporate%20governance/market%20risk/
MPRA_paper_92189.pdf
Tobin’s Q and Its Determinants: A Study of Market Valuation in MISC Berhad (7 May 2019)
Syazwani, Anis. Retrieved from:
file:///C:/xampp/htdocs/pendaftaran_acara/images/corporate%20governance/market%20risk/
MPRA_paper_93776.pdf
Do old and new labour market risks overlap? Automation, offshorability, and non-standard employment (July 2019) Malo, Miguel and Cueto, Begoña. Retrieved from:
file:///C:/xampp/htdocs/pendaftaran_acara/images/corporate%20governance/market%20risk/
MPRA_paper_95058.pdf
Study of Relationship Between Performance (ROA) And Internal And External Factors On
Axiata Group Berhad (17 April 2017) Lim, Pei Shan. Retrieved from:
file:///C:/xampp/htdocs/pendaftaran_acara/images/corporate%20governance/ratio%20perfor
mance/MPRA_paper_78459.pdf
Telekom Malaysia Berhad (TM): Study of Relationship Between Performance (ROA) and
Internal, External Factor (17 April 2017) Teo, Sze Wee. Retrieved from:
file:///C:/xampp/htdocs/pendaftaran_acara/images/corporate%20governance/ratio%20perfor
mance/MPRA_paper_78461.pdf
Study of Relationship of Company’s Performance with Internal and External Factors on
Maxis Berhad (17 April 2017) Koh, Way Han. Retrieved from:
file:///C:/xampp/htdocs/pendaftaran_acara/images/corporate%20governance/ratio%20perfor
28
Research Of Operatinoal Risk Management And Its Determinants: An Analysis Of Hua Xia
Bank In China (16 December 2018) Xie, Zhuang. Retrieved from:
file:///C:/xampp/htdocs/pendaftaran_acara/images/corporate%20governance/operational%20r
isk/MPRA_paper_90568.pdf
Operational risk and its determinants among five companies in manufacturing industry in
Germany (25 May 2018) Cipriano, Nur Alisha Arfiffy and Zulkeflee, Nur Nabila and Amran, Fasihah and Shahudin, Haziah Aishah. Retrieved from:
file:///C:/xampp/htdocs/pendaftaran_acara/images/corporate%20governance/operational%20r
isk/MPRA_paper_87013.pdf
Empirical Examination for Operational and Credit Risk Perspective – A Case of Commercial Banks of Pakistan (22 June 2017) Mehmood, Mian Saqib and Sheraz, Iram and Mehmood,
Asif and G. Mujtaba, Bahaudin. Retrieved from:
file:///C:/xampp/htdocs/pendaftaran_acara/images/corporate%20governance/operational%20r
isk/MPRA_paper_80491.pdf
The role of external auditors in corporate governance: agency problems and the management
of risk (6 July 2009) Ojo, Marianne. Retrieved from:
https://mpra.ub.uni-muenchen.de/47346/1/MPRA_paper_47346.pdf
Annual report of Target Corporation. Retrieved from:
http://www.annualreports.com/HostedData/AnnualReports/PDF/NYSE_TGT_2018.pdf
Target: Where Are The Shareholders On The Company's Board (28 May 2019) Carlton Getz,
CFA. Retrieved from:
29
Liquidity Risk In Malaysia Transportation Industry Research (Mmya 21, 2018) Chen Yingqi,