Characterization and quantification of gait deficits within
gait phases using fuzzy-granular computing
*
Melaku A. Bogale1, Huiying Yu2, Thompson Sarkodie-Gyan2, Amr Abdelgawad3
1
University of Texas at El Paso, Computational Science Program, El Paso, USA
2
Department of Electrical and Computer Engineering, University of Texas at El Paso, El Paso, USA
3
Texas Tech University Health Science Center, El Paso, USA Email: [email protected]
Received 5 October 2012; revised 7 November 2012; accepted 23 November 2012
ABSTRACT
People with neurological disorders like Cerebral Palsy (CP) and Multiple Sclerosis (MS) suffer associ- ated functional gait problems. The symptoms and sign of these gait deficits are different between sub- jects and even within a subject at different stage of the disease. Identifying these gait related abnormali- ties helps in the treatment planning and rehabilitation process. The current gait assessment process does not provide very specific information within the seven gait phases. The objective of this study is to investi- gate the possible application of granular computing to quantify gait parameters within the seven gait phases. In this process we applied fuzzy-granular computing on the vertical ground reaction force (VGRF) and surface electromyography (sEMG) data to obtain respective characteristic values for each gait phase. A fuzzy similarity (FS) measure is used to compare pa- tient values with age and sex matched control able- bodied group. We specifically applied and tested this approach on 10 patients (4 Cerebral Palsy and 6 Mul- tiple Sclerosis) to identify possible gait abnormalities. Different FS values for VGRF for right and left leg is observed. The VGRF analysis shows smaller FS values during the swing phase in CP and MS subjects that are evidence of associated stability problem. Similarly, FS values for muscle activates of the four-selected muscle display a broad range of values due to diffe- rence between subjects. Degraded FS values for dif-ferent muscles at difdif-ferent stage of the gait cycle are reported. Smaller FS values are sign of abnormal ac-tivity of the respective muscles. This approach pro- vides individual centered and very specific informa- tion within the gait phases that can be employed for diagnosis, treatment and rehabilitation process.
Keywords:Fuzzy-Granular Algorithm; Gait Phases; Fuzzy Similarity; Cerebral Palsy; Multiple Sclerosis
1. INTRODUCTION
For people with mobility disabilities gait analysis is used to provide diagnosis, evaluation and treatment planning information. The benefit of gait analysis is well estab- lished that it has now become a part of routine process in many rehabilitation centers [1]. People with Multiple Sc- lerosis (MS) may suffer from significant gait impairment even at early stage of the disease [2,3]. Gait analysis has been used to identify associated gait deficit with MS [2,4]. Gait variability study in people with MS revealed slower walking speed and more fatigue than control heal- thy group [5]. In the study [6], the effect of MS on the frequency content of vertical ground reaction force (VGRF) during walking was investigated. Compared with health controls significantly lower frequency content in VGRF and no difference in frequency content in ante- rior-posterior ground reaction forces [6].
Lee EH et al. [7] emphasized the importance of gait analysis in critical surgical decision-making in children with Cerebral Palsy (CP). In this study [7] surgical decisions on children with CP, based on clinical evalu- ation and gait analysis was shown to help improve gait quality after surgery compared to decisions solely made on clinical assessment. According to [8] gait analysis has been used to make surgical procedure decisions in patients with CP. There are a growing number of lite- ratures [9-15] related to gait analysis and Cerebral Palsy in diagnosis and treatment planning decisions making process. Wavelet analysis was applied to study surface electromyography (sEMG) signals acquired from lower extremity muscles in children with CP [14]. Probabilistic gait classification in children with CP reported in [15]. Cluster analysis was used for identification of sagittal gait patterns [16]. Principal component analysis was ap- plied to extract gait patterns in children with CP [12]. *Conflict of interest: The authors do not have any financial and
Mark J. et al. [17] employed fuzzy-clustering to classify temporal-distance and kinematic gait parameters for CP children.
The dynamic behavior of gait parameters is cyclic and the “normal” or expected pattern (or values) of these parameters over a gait cycle is well known. Studying dynamic gait parameters over a gait cycle helps identify alteration or deviation from the expected reference pattern or values. Specifically, quantifying kinematic, kinetic and surface electromyography (sEMG) gait para- meters over a given gait cycle play a crucial role in re- cognizing associated neurological related gait deficits. Additional techniques and measurements that enable quantification and representation into the seven gait phases add more reliability and specificity to the analysis process. For example, monitoring of the sEMG activity over a gait cycle or a gait phases gives valuable infor- mation for diagnosis and treatment decisions [18].
Most gait study techniques are limited to full gait cy- cle analysis, which focuses on comparison of reference patterns or values with the respective parameters of neu- rological impaired subjects. Few studies [19-21] investi- gated gait parameters by decomposing the full gait cycle into its seven phases. In [19-21] the authors implemented fuzzy-ruled approach to divide a gait cycle into its seven phases and make very specific comparisons and analysis within each gait phase. In these studies averaging gait variables values in each phase was used for quantifica- tion and representation. Mean value representation may be a good way and works well for slowly time-varying signals. However, averaging is not a good choice for non-smoothly time-varying signals with typical peaks and valleys. Ground reaction forces and muscle activity signal are examples of such rapidly time-varying signals with characteristic shape and peak amplitudes. We be- lieve that a more accurate representation and quantifica- tion could be possible by employing granular representa- tion scheme in each phase. Quantification of gait pa- rameter value in each phase based on data-driven granule representation helps to capture the information in each sub-cycle and preserve the experimental significance and justifiability of the signal. We present a possible applica- tion of fuzzy-granular computing to investigate the dy- namic behavior of the VGRF and sEMG over the seven gait phases. In this regard, we build an information gra- nule based on fuzzy-triangular membership function to characterize, quantify and represent gait parameters values in each sub-cycle. The proposed technique is tested and used to identify and distinguish gait deficits among MS and CP subjects.
2. GAIT TERMINOLOGIES
Michael (2007) [1], defined gait cycle as “the time inter- val between two successive occurrence of one of the re-
petitive events of walking”. We can define the gait cycle using any event in the walking process; the most com- mon way of defining a cycle is to use the instance of “initial contact” of one foot. Accordingly, a gait cycle begins at the instant one-foot strikes/contacts ground, and the instant when the same foot strikes the ground again, marks the end of the gait cycle. Based on the ma- jor events happening during a gait cycle [1], a full gait cycle is divided into seven gait phases [1]: Loading re- sponse (0% - 10% of the full cycle), mid stance (10% - 30%), terminal stance (30% - 50%), pre-swing (50% - 60%), initial swing (60% - 70%), mid swing (70% - 85%) and terminal swing (85% - 100%) [1].
3. GRANULAR REPRESENTATION OF
GAIT PHASES
To minimize the effect of individual differences in speed of walking and to allow inter-subject comparisons norma- lization [22] was performed before granulation. The data were normalized as,
0 0
0 0
min( )
max( ) min( )
S S
S
S S
(1)
where 0is the original time-series data, max is maxi-
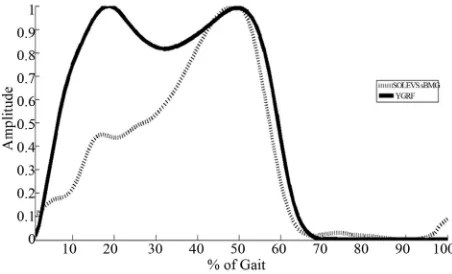
[image:2.595.309.535.577.714.2]mum, and min is minimum. Normalized VGRF and So- leus sEMG are shown for one complete gait cycle in Fig- ure 1.
S
Given data sample points for one complete gait cycle, one can use the percentage of each phase from the com- plete cycle to divide the samples into seven segments or granules (phases in this case). Next we seek granular re- presentation of those samples that fall within each phase. In this paper, we present fuzzy-triangular membership- based method that optimally represent data points in each granule. The triangular fuzzy set membership function is designed according to the method outlined in [22-24]. For each segment, in the interval [a,b] the membership function is established as
, , ( )
a m b
x m
x
m a
for a x m (2a)
, , ( )
a m b
b x x
b m
for m x b (2b)
where a is the left bound, m is the modal or core value, and b is the right bound. The median of each segment is taken as a modal value [23]. To obtain the fuzzy parameters a and b, Equation (3) is solved for each segment [23,24]. This equation provides the optimal value of a and b that satisfies the experimental sig- nificance and specificity requirement we need to have in each granule.
, , 1
( )
( , ) max
k
a m b i i
x Q a b
b a
(3)
where k is the number of data points in each segment and
i
[image:3.595.106.287.91.140.2] [image:3.595.96.288.431.508.2]x
is data point in the respective segment or phase. Figure 2 represents an example of Soleus sEMG signal granulated into seven phases.3.1. Granular Matrix and Calculation of Fuzzy Similarity
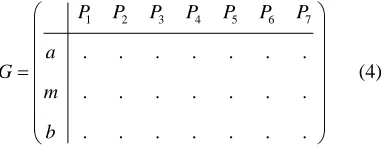
We form the granular matrix, G for each gait phase represented by (a, m, b) [22], an example of such 3 × 7 matrix is shown in Equation (4).
1 2 3 4 5 6 7
. . . .
. . . .
. . . .
P P P P P P P
a G
m
b
(4)
where P ii( 1, , 7) represent gait phases.
The fuzzy similarity (FS) [19] between two granulated
Figure 2. Granulated soleus sEMG represented through the fuzzy-parameters a, m, and b.
gait variables represented by Ggij and H hij can be calculated as
min , *
max ,
ij ij
ij ij
g h G H
g h
(5)
where the symbol “*” stands for the fuzzy-correlation operator, “min” for the fuzzy-intersection and “max” for fuzzy-union. In this study G represent the granulated gait variable for reference group and H could mean the res- pective granulated variable for a subject with MS or CP. And the FS defines the similarity between the reference and test subject in each gait phases. The FS is within a range between 0 and 1. FS value of zero signifies no similarity at all and 1 represents 100% similarity. An FS value closer to 1 indicates higher degree of similarity and FS values close to zero show little or no similarity. FS measure is chosen to make it consistent with the fuzzy- granulation algorithm; otherwise any similarity measure that scales between 0 and 1 could as well be used.
4. EXPERIMENTAL DESIGN AND
METHODS
4.1. Participants
[image:3.595.58.285.545.710.2]The institutional review board (IRB) of The University of Texas at El Paso approved this study. Subjects ob- tained explanations about the study and are asked to sign informed consent prior to participation. Twenty-two male (Age: 24.5 ± 4.0 years; Weight: 74.6 ± 14.6 kg; Height: 173.0 ± 8.4 cm) and twelve female control able-bodied subjects (Age: 25.2 ± 5.5 years; Weight: 63.7 ± 9.7 kg; Height: 164 ± 5.8 cm) with no history of gait abnormalities are recruited from the El Paso community. Table 1 shows the six MS patients (2 female and 4 male), and four CP (1 female and 3 male) subjects selected for this study.
Table 1. Patient anthropometric data.
Patient Gender Age Weight (kg) Height (cm) BMI
*CP01 Female 26 44.9 151 26.6
CP02 Male 17 69.5 162 26.5
CP03 Male 17 68.3 164 25.4
CP04 Male 55 88.9 172 30.1
*MS01 Female 55 66.1 150 29.4
MS02 Female 40 61.2 165 22.5
MS03 Male 62 77.7 162 29.6
MS04 Male 37 130.7 181 39.9
MS05 Male 45 124.2 178 39.2
MS06 Male 28 82.5 194.5 21.8
*
[image:3.595.306.540.560.724.2]4.2. Data Acquisition and Processing
All subjects in this study able-bodied, MS and CP sub- jects, performed free barefoot treadmill walking at their comfortable speed for 180 seconds. The speed of the treadmill is controllable and can be set at the subject’s comfortable speed. A dual-belt treadmill (Bertec, Cor- porations, USA) is used to measure the ground reaction forces (GRFs) in three-dimensions. The force plates measure the ground reaction forces at 100 Hz sampling frequency. VGRF was filtered using a second order But- terworth low pass filter with cut-off frequency of 20 Hz to remove the noise. VGRF component was used to de- fine the gait cycles. To represent each cycle (stride) in percentage, time-normalization was done by re-sampling [25]. An average VGRF for one cycle was calculated from 100 strides. To allow inter-subject comparison, the VGRF was normalized by the weight in kilograms of respective subject. Male and female ablebodied subjects VGRF data were analyzed separately and averaged to establish a separate reference for male and female.
The dynamic sEMG data for four selected muscles for right side: soleus (SOL), tibialis anterior (TA), gas-tro- cnemius laterialis (LG), and vastus laterialis (VL), are measured by the Delsys Myomonitor wirless EMG sys- tem (Delsys Inc., Boston, MA, USA). The sEMG data acquisition was sampled at 1000 Hz and electrodes were placed according to [26]. All sEMG signal data were filtered by band pass 3rd order Butterworth filter with cutoff frequency between 20 and 250 Hz to remove low and high frequency noise. Re-sampling was done to convert into percentage of gait cycle and to make the length of each sEMG signal the same for each stride [27]. The average sEMG for each muscle was determined from 100 cycles sEMG data. The amplitudes of sEMG were normalized based on the maximum average to al- low comparison between individuals. Male and female sEMG reference was then built separately by averaging the respective gender group sEMG. The reference VGRF and sEMG are divided into seven parts based on the per- centage of each gait phases. The triangular fuzzy-mem- bership function parameters a, m, and b were constructed for each segment using Equations (1) and (2). Each phase of a given gait cycle is now represented by the parameters (a, m, b) and a 3 × 7 granular matrices that represents the full gait cycle. Reference granular ma-trixes that represent the able-bodied group are built for VGRF and the sEMG data. For each MS and CP patient similar data processing scheme is followed and repre-sentative granular matrix for each patient subject is con-structed. The fuzzy similarity of the reference matrix and that of a patient (CP and MS in this case) is then deter-mined by Equation (4).
5. RESULTS AND DISCUSSION
The proposed method is applied to establish similarity of VGRF and sEMG data of the reference able-bodied and patients group (CP and MS) in each gait phases. Each entry in the result table expresses the similarity of fuzzy parameters (a, m, b) of patients and control group.
5.1. Vertical Ground Reaction Force
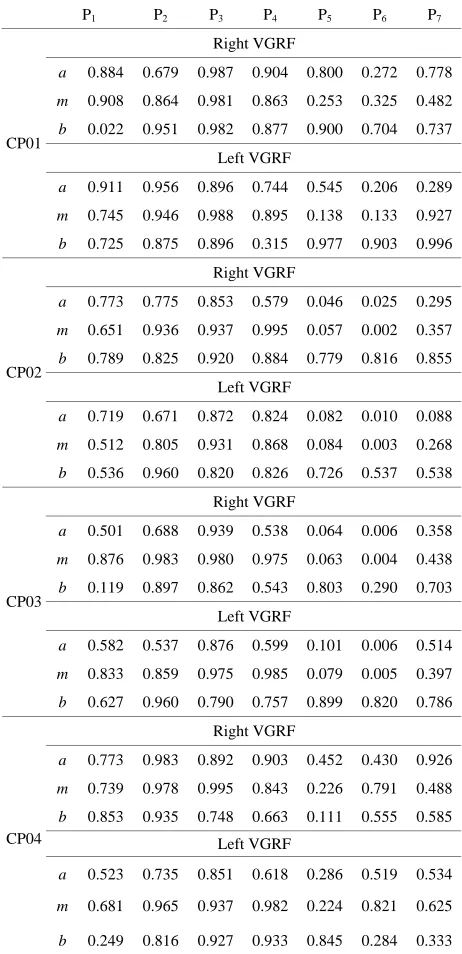
The fuzzy similarity of the of right and left VGRF in each gait phase for the 4 CP and 6 MS subjects are presented in Tables 2 and 3. Different FS values are reported for left and right VGRF, which can help assess both legs separately. The values in the tables express how similar the patient fuzzy parameters (a, m, and b) are with the corresponding reference values. A smaller FS values signifies deviation or variations from the expected behaviors. On the other hand a bigger FS values, imply sign of closeness to the normal patterns and functioning. We observe lower FS values in gait phase 5 (initial-swing), 6 (mid-swing), and 7 (terminal swing) for most of CP and MS patients. Relatively, most patient subjects have degraded FS values in phase 6. Phase 7 FS values are comparatively higher than phase 5 and 6 values. The fuzzy parameter, b (right bound) has higher FS values compared with the corresponding fuzzy parameters a (left bound), and m (the core) in phases 5-7. Smaller FS values in phase 5-7 signify that most of patients have gait problems during swing phase.
5.2. Muscle Activity
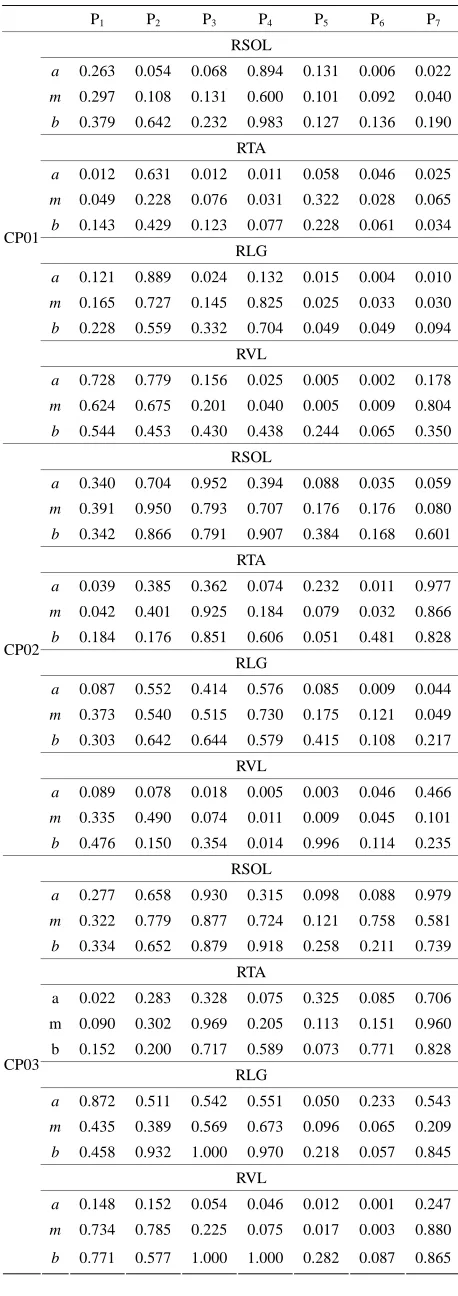
The degree of FS for the right leg for four lower-ex- tremity muscles of CP patients’ and the able-bodied group is presented in Table 4.
Each CP patient has different FS values that depend on individual impairment level and intervention or therapy undergone. The FS values for the right-soleus muscle are smaller during P5, P6, and P7. Particularly CP01 and
CP02 have lowered FS values for soleus in P5 and P6.
CP04 has relatively higher FS values in the swing phase for soleus-muscle. The soleus muscle is expected to be activated at the start of the stance phase (loading-re- sponse) and attains its maximum during the final phase of the stance (pre-swing). Soleus remains relaxed during the swing phase. CP01 has noticeable, very low FS for soleus during the first three phases where this muscle is expected to achieve full activation. This is sign for ab-normal or under ab-normal activation of the respective mus-cle.
CP02 and CP03 have smaller FS values for P1 (load-
Table 2. FS values for VGRF for the CP patients.
P1 P2 P3 P4 P5 P6 P7
Right VGRF
a 0.884 0.679 0.987 0.904 0.800 0.272 0.778
m 0.908 0.864 0.981 0.863 0.253 0.325 0.482
b 0.022 0.951 0.982 0.877 0.900 0.704 0.737
Left VGRF
a 0.911 0.956 0.896 0.744 0.545 0.206 0.289
m 0.745 0.946 0.988 0.895 0.138 0.133 0.927
CP01
b 0.725 0.875 0.896 0.315 0.977 0.903 0.996
Right VGRF
a 0.773 0.775 0.853 0.579 0.046 0.025 0.295
m 0.651 0.936 0.937 0.995 0.057 0.002 0.357
b 0.789 0.825 0.920 0.884 0.779 0.816 0.855
Left VGRF
a 0.719 0.671 0.872 0.824 0.082 0.010 0.088
m 0.512 0.805 0.931 0.868 0.084 0.003 0.268
CP02
b 0.536 0.960 0.820 0.826 0.726 0.537 0.538
Right VGRF
a 0.501 0.688 0.939 0.538 0.064 0.006 0.358
m 0.876 0.983 0.980 0.975 0.063 0.004 0.438
b 0.119 0.897 0.862 0.543 0.803 0.290 0.703
Left VGRF
a 0.582 0.537 0.876 0.599 0.101 0.006 0.514
m 0.833 0.859 0.975 0.985 0.079 0.005 0.397
CP03
b 0.627 0.960 0.790 0.757 0.899 0.820 0.786
Right VGRF
a 0.773 0.983 0.892 0.903 0.452 0.430 0.926
m 0.739 0.978 0.995 0.843 0.226 0.791 0.488
b 0.853 0.935 0.748 0.663 0.111 0.555 0.585
Left VGRF
a 0.523 0.735 0.851 0.618 0.286 0.519 0.534
m 0.681 0.965 0.937 0.982 0.224 0.821 0.625
CP04
b 0.249 0.816 0.927 0.933 0.845 0.284 0.333
[image:5.595.306.537.102.733.2]three phase of the cycle. TA muscle is activated in the first phase and stays relaxed until the first part of the swing-phase. The smaller FS values during the first phase are evidence of improper activation of the respec- tive muscle. Generally smaller FS values are indication of unusual muscle activity and that need to be addressed in the treatment process. This kind of quantification of muscle activity within the seven gait phases provides an individual based assessment tool that can be tailored for treatment planning and interventions. Similar analysis can be done for the remaining two muscles from Table 4 for CP patients.
Table 3. FS values for VGRF for the MS patients.
P1 P2 P3 P4 P5 P6 P7
Right VGRF
a 0.940 0.941 0.799 0.460 0.538 0.327 0.096
m 0.831 0.911 0.885 0.868 0.084 0.234 0.808
b 0.632 0.826 0.897 0.995 0.998 0.356 0.360
Left VGRF
a 0.705 0.999 0.884 0.750 0.969 0.399 0.551
m 0.871 0.904 0.917 0.733 0.830 0.499 0.469
MS01
b 0.925 0.951 0.952 0.900 0.841 0.710 0.709
Right VGRF
a 0.629 0.790 0.880 0.419 0.097 0.589 0.692
m 0.950 0.984 0.939 0.847 0.055 0.278 0.864
b 0.900 0.951 0.982 0.995 0.577 0.793 0.830
Left VGRF
a 0.746 0.767 0.873 0.938 0.514 0.579 0.973
m 0.832 0.937 0.937 0.763 0.349 0.706 0.825
MS02
b 0.583 0.951 0.952 0.995 0.920 0.932 0.937
Right VGRF
a 0.098 0.580 0.870 0.537 0.027 0.002 0.999
m 0.523 0.786 0.916 0.938 0.044 0.001 0.801
b 0.746 0.960 0.960 0.817 0.820 0.868 0.189
Left VGRF
a 0.185 0.584 0.938 0.464 0.027 0.005 0.100
m 0.528 0.710 0.917 0.926 0.041 0.001 0.575
MS03
b 0.811 0.725 0.948 0.933 0.552 0.603 0.444
Right VGRF
a 0.681 0.768 0.849 0.471 0.044 0.004 0.753
m 0.539 0.874 0.938 0.925 0.048 0.006 0.662
b 0.563 0.960 0.744 0.933 0.565 0.891 0.503
Left VGRF
a 0.465 0.485 0.833 0.799 0.092 0.013 0.486
m 0.504 0.925 0.908 0.831 0.086 0.019 0.488
MS04
b 0.660 0.840 0.636 0.933 0.549 0.888 0.794
Right VGRF
a 0.032 0.954 0.879 0.713 0.427 0.062 0.660
m 0.996 0.947 0.952 0.982 0.362 0.887 0.615
b 0.633 0.764 0.963 0.827 0.219 0.007 0.010
Left VGRF
a 0.348 0.982 0.850 0.882 0.717 0.403 0.958
m 0.906 0.939 0.934 0.964 0.815 0.960 0.817
MS05
b 0.015 0.933 0.927 0.811 0.350 0.238 0.240
Right VGRF
a 0.949 0.596 0.833 0.621 0.469 0.128 0.194
m 0.571 0.937 0.915 0.998 0.102 0.133 0.411
b 0.939 0.943 0.858 0.760 0.917 0.781 0.733
Left VGRF
a 0.758 0.504 0.913 0.504 0.212 0.030 0.342
m 0.616 0.995 0.963 0.937 0.074 0.033 0.701
MS06
Table 4. FS values for four muscles of CP patients.
P1 P2 P3 P4 P5 P6 P7
RSOL
a 0.263 0.054 0.068 0.894 0.131 0.006 0.022
m 0.297 0.108 0.131 0.600 0.101 0.092 0.040
b 0.379 0.642 0.232 0.983 0.127 0.136 0.190
RTA
a 0.012 0.631 0.012 0.011 0.058 0.046 0.025
m 0.049 0.228 0.076 0.031 0.322 0.028 0.065
b 0.143 0.429 0.123 0.077 0.228 0.061 0.034
RLG
a 0.121 0.889 0.024 0.132 0.015 0.004 0.010
m 0.165 0.727 0.145 0.825 0.025 0.033 0.030
b 0.228 0.559 0.332 0.704 0.049 0.049 0.094
RVL
a 0.728 0.779 0.156 0.025 0.005 0.002 0.178
m 0.624 0.675 0.201 0.040 0.005 0.009 0.804
CP01
b 0.544 0.453 0.430 0.438 0.244 0.065 0.350
RSOL
a 0.340 0.704 0.952 0.394 0.088 0.035 0.059
m 0.391 0.950 0.793 0.707 0.176 0.176 0.080
b 0.342 0.866 0.791 0.907 0.384 0.168 0.601
RTA
a 0.039 0.385 0.362 0.074 0.232 0.011 0.977
m 0.042 0.401 0.925 0.184 0.079 0.032 0.866
b 0.184 0.176 0.851 0.606 0.051 0.481 0.828
RLG
a 0.087 0.552 0.414 0.576 0.085 0.009 0.044
m 0.373 0.540 0.515 0.730 0.175 0.121 0.049
b 0.303 0.642 0.644 0.579 0.415 0.108 0.217
RVL
a 0.089 0.078 0.018 0.005 0.003 0.046 0.466
m 0.335 0.490 0.074 0.011 0.009 0.045 0.101
CP02
b 0.476 0.150 0.354 0.014 0.996 0.114 0.235
RSOL
a 0.277 0.658 0.930 0.315 0.098 0.088 0.979
m 0.322 0.779 0.877 0.724 0.121 0.758 0.581
b 0.334 0.652 0.879 0.918 0.258 0.211 0.739
RTA
a 0.022 0.283 0.328 0.075 0.325 0.085 0.706
m 0.090 0.302 0.969 0.205 0.113 0.151 0.960
b 0.152 0.200 0.717 0.589 0.073 0.771 0.828
RLG
a 0.872 0.511 0.542 0.551 0.050 0.233 0.543
m 0.435 0.389 0.569 0.673 0.096 0.065 0.209
b 0.458 0.932 1.000 0.970 0.218 0.057 0.845
RVL
a 0.148 0.152 0.054 0.046 0.012 0.001 0.247
m 0.734 0.785 0.225 0.075 0.017 0.003 0.880
CP03
b 0.771 0.577 1.000 1.000 0.282 0.087 0.865
Continued
RSOL
a 0.888 0.952 0.935 0.634 0.686 0.206 0.054
m 0.621 0.916 0.930 0.458 0.728 0.761 0.052
b 0.477 0.890 1.000 0.491 0.893 0.979 0.312
RTA
a 0.697 0.373 0.205 0.003 0.102 0.644 0.522
m 0.603 0.204 0.267 0.008 0.394 0.785 0.525
b 0.764 0.410 0.138 0.080 0.633 0.820 0.978
RLG
a 0.173 0.161 0.854 0.261 0.318 0.074 0.121
m 0.318 0.949 0.968 0.650 0.161 0.520 0.171
b 0.503 0.733 1.000 0.918 0.232 0.352 0.829
RVL
a 0.476 0.263 0.090 0.057 0.023 0.029 0.653
m 0.605 0.561 0.256 0.119 0.049 0.077 0.913
CP04
b 0.775 0.974 1.000 1.000 0.282 0.420 0.393
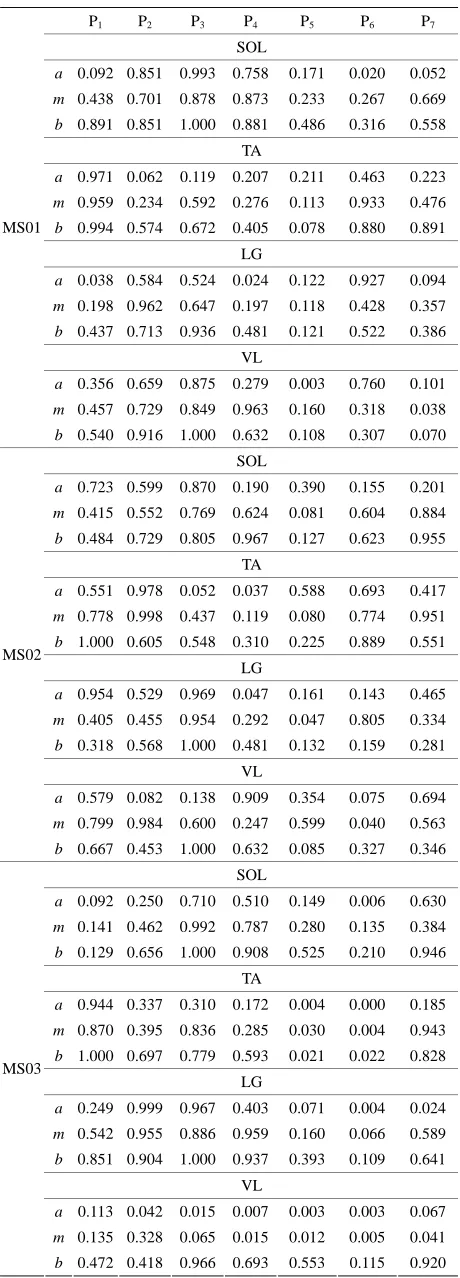
The comparison of muscle activity of MS patients and able-bodied group is displayed in Table 5. Again, in the case of MS subjects, wide ranges of FS values are ob- served. This variation is due to individual difference in gait deficit and the level of MS disease progression. FS values for MS01 and MS03 in swing phase (P5, P6, and
P7) is relatively lower than the other MS subjects for the
four muscles. MS02 has shown relatively improved FS values in most of the seven gait phases. We present mus- cle activity of the right leg, however the same analysis could also be done on the left leg.
The objective of this study is to investigate the possi- ble application of granular computing to quantify gait parameters within the seven gait phases. The result of this study has shown to be effective in providing indi- vidual specific information about impairment level of CP and MS patients in comparison with age and sex matched able-bodied group. Analysis of VGRF revealed most of CP and MS subjects have smaller degree of similarity during the swing (P5, P6, and P7) phase. This is the part
Table 5. FS values for four muscles of MS patients.
P1 P2 P3 P4 P5 P6 P7
SOL
a 0.092 0.851 0.993 0.758 0.171 0.020 0.052
m 0.438 0.701 0.878 0.873 0.233 0.267 0.669
b 0.891 0.851 1.000 0.881 0.486 0.316 0.558 TA
a 0.971 0.062 0.119 0.207 0.211 0.463 0.223
m 0.959 0.234 0.592 0.276 0.113 0.933 0.476
b 0.994 0.574 0.672 0.405 0.078 0.880 0.891 LG
a 0.038 0.584 0.524 0.024 0.122 0.927 0.094
m 0.198 0.962 0.647 0.197 0.118 0.428 0.357
b 0.437 0.713 0.936 0.481 0.121 0.522 0.386 VL
a 0.356 0.659 0.875 0.279 0.003 0.760 0.101
m 0.457 0.729 0.849 0.963 0.160 0.318 0.038 MS01
b 0.540 0.916 1.000 0.632 0.108 0.307 0.070 SOL
a 0.723 0.599 0.870 0.190 0.390 0.155 0.201
m 0.415 0.552 0.769 0.624 0.081 0.604 0.884
b 0.484 0.729 0.805 0.967 0.127 0.623 0.955 TA
a 0.551 0.978 0.052 0.037 0.588 0.693 0.417
m 0.778 0.998 0.437 0.119 0.080 0.774 0.951
b 1.000 0.605 0.548 0.310 0.225 0.889 0.551 LG
a 0.954 0.529 0.969 0.047 0.161 0.143 0.465
m 0.405 0.455 0.954 0.292 0.047 0.805 0.334
b 0.318 0.568 1.000 0.481 0.132 0.159 0.281 VL
a 0.579 0.082 0.138 0.909 0.354 0.075 0.694
m 0.799 0.984 0.600 0.247 0.599 0.040 0.563 MS02
b 0.667 0.453 1.000 0.632 0.085 0.327 0.346 SOL
a 0.092 0.250 0.710 0.510 0.149 0.006 0.630
m 0.141 0.462 0.992 0.787 0.280 0.135 0.384
b 0.129 0.656 1.000 0.908 0.525 0.210 0.946 TA
a 0.944 0.337 0.310 0.172 0.004 0.000 0.185
m 0.870 0.395 0.836 0.285 0.030 0.004 0.943
b 1.000 0.697 0.779 0.593 0.021 0.022 0.828 LG
a 0.249 0.999 0.967 0.403 0.071 0.004 0.024
m 0.542 0.955 0.886 0.959 0.160 0.066 0.589
b 0.851 0.904 1.000 0.937 0.393 0.109 0.641 VL
a 0.113 0.042 0.015 0.007 0.003 0.003 0.067
m 0.135 0.328 0.065 0.015 0.012 0.005 0.041 MS03
b 0.472 0.418 0.966 0.693 0.553 0.115 0.920
Continued
SOL
a 0.175 0.052 0.538 0.232 0.080 0.046 0.650
m 0.303 0.093 0.617 0.539 0.131 0.339 0.176
b 0.962 0.467 0.937 0.877 0.217 0.157 0.982
TA
a 0.789 0.467 0.075 0.120 0.083 0.493 0.097
m 0.954 0.842 0.437 0.195 0.061 0.745 0.728
b 0.995 0.696 0.706 0.885 0.075 0.771 0.970
LG
a 0.054 0.061 0.225 0.881 0.633 0.391 0.643
m 0.197 0.316 0.554 0.747 0.489 0.694 0.159
b 0.660 0.429 1.000 0.877 0.651 0.640 0.304
VL
a 0.700 0.081 0.034 0.017 0.008 0.006 0.179
m 0.846 0.597 0.144 0.028 0.027 0.017 0.861
MS04
b 0.829 0.022 1.000 1.000 0.887 0.476 0.604
SOL
a 0.499 0.762 0.981 0.584 0.667 0.057 0.946
m 0.894 0.857 0.956 0.952 0.604 0.833 0.341
b 0.715 0.843 1.000 0.805 0.584 0.859 0.429
TA
a 0.779 0.125 0.745 0.707 0.686 0.677 0.191
m 0.626 0.399 0.463 0.309 0.892 0.821 0.545
b 0.676 0.970 0.391 0.883 0.741 0.771 0.769
LG
a 0.292 0.972 1.000 0.498 0.034 0.989 0.888
m 0.472 0.973 0.961 0.617 0.843 0.437 0.398
b 0.691 0.825 1.000 0.754 0.738 0.741 0.557
VL
a 0.979 0.069 0.132 0.079 0.040 0.082 0.337
m 0.927 0.461 0.184 0.062 0.031 0.076 0.831
MS05
b 0.153 0.769 1.000 0.824 0.049 0.469 0.074
SOL
a 0.569 0.735 0.896 0.732 0.211 0.054 0.170
m 0.430 0.769 0.983 0.920 0.615 0.441 0.212
b 0.597 0.680 0.997 0.957 0.687 0.439 0.560
TA
a 0.096 0.030 0.024 0.042 0.234 0.953 0.486
m 0.359 0.127 0.052 0.041 0.415 0.890 0.774
b 0.528 0.133 0.212 0.232 0.633 0.975 0.459
LG
a 0.764 0.567 0.867 0.765 0.795 0.137 0.045
m 0.301 0.855 0.958 0.851 0.748 0.746 0.055
b 0.338 0.754 1.000 0.858 0.808 0.683 0.441
VL
a 0.676 0.899 0.870 0.933 0.804 0.257 0.765
m 0.864 0.900 0.653 0.712 0.781 0.721 0.863
MS06
b 0.725 0.974 1.000 1.000 0.904 0.703 0.826
the expected normal activity. Since, each CP and MS subject is different in the type of gait deficit and the level of impairment, the calculated FS values for one muscle may not follow the same trend in all subjects. For example, lower FS values in phases 5-7 are observed, for most CP subjects, however CP04 has relatively higher FS values in the swing phase. This process of measuring similarity within the seven gait phases, furnishes indi- vidual centered information that can relate more to the individual. Further, since the information is available for each phase, it is easier to identify specific problem with- in gait phases. Identifying specific problems at a par- ticular part of the walking process helps to single out the type of treatment and rehabilitation procedure needed.
One possible limitation to this study is that FS values could be affected by the speed of walking on the treadmill, because subjects walk at different speed over ground and treadmill. However, an effort has been made to minimize this effect and allow inter-subject compa- rison by normalizing the data using Equation (1) before granulation. Further, the VGRF data are normalized by the body weight, and sEMG data are normalized by the maximum value to permit comparisons between subjects. In this research, the authors employed an automatic de- tection of the gait cycles using VGRF values. A heel- strike was defined at the point where the VGRF records a value above a threshold based on the noise-level of the signal. A toe-off is marked when VGRF drops below the threshold. A complete gait cycle then covers the whole period from the initial rise of VGRF to the next above threshold value. This is very robust method compared with other automatic gait cycle detection algorithms based on inertial sensors [29]. Because, inertial sensors, like accelerometers, usually are very sensitive and the reading highly depends on the orientation and have an associated offsets.
The proposed method is not a diagnostic tool like the one presented in [30,31]; rather it is an assessment or evaluation model. It provides valuable information re- garding the relative impairment level compared to heal- thy control group. It can’t be used to detect the pre- sence of CP or MS or classify CP and MS. This approach can be extended for assessment of gait related problems due to other neurological disorder as well.
6. CONCLUSION
We apply fuzzy-granular computing to quantify VGRF and sEMG values within the seven gait phases for the purpose of assessing and identifying specific gait deficits associated with CP and MS subjects. The proposed ap- proach is shown to be effective in providing individual based assessment information for specific part of the gait cycle. We demonstrated the possible use of fuzzy simi- larity measure values between age and sex matched con-
trol able-bodied group and patient group (MS and CP) as a way of quantifying assessment of impairment level or identifying associated gait deficit. This approach not only enables to evaluate very specific gait defects but also pinpoints where the problem is within the gait cycle. Identification of abnormalities at specific point provides valuable information on the kind of treatment or inter- vention that can be prescribed. This individual based gait assessment information, can be integrated in clinical setting and provide crucial knowledge for individual fol- low up and rehabilitation process.
7. ACKNOWLEDGEMENTS
The authors would like to acknowledge the Computational Science Program of University of Texas at El Paso and the Stern foundation for their financial support. These funds were used to support graduate students in this project. The authors would like to thank the stern foun-dation for their financial support for our lab facility. The authors also would like to thank all subjects who participated in this study.
REFERENCES
[1] Whittle, M.W. (2007) Gait analysis an introduction. 4th Edition, Butterworth-Heineman, Elsevier, Amsterdam.
[2] Shakespeare, D., Boggild, M. and Young, C.A. (2003) Anti-spasticity agents for multiple sclerosis. Cochrane Database of Systematic Reviews, 4.
[3] Martin, C.L., Philips, B.A., Kilpatrick, T.J., Butzkueven, H., Tubridy, N., MacDonald, E. and Galea, M.P. (2006) Gait and balance impairment in early multiple sclerosis in the absence of clinical disability. Multiple Sclerosis, 12, 620-628. doi:10.1177/1352458506070658
[4] Sosnoff, J.J., Sandroff, B.M. and Motl, R.W. (2012) Quantifying gait abnormalities in persons with multiple sclerosis with minimal disability. Gait & Posture, 36, 154-156. doi:10.1016/j.gaitpost.2011.11.027
[5] Crenshaw, S.J., Royer, T.D., Richards, J.G. and Huson, D. J. (2006) Gait variability in people with multiple sclerosis. Multiple Sclerosis, 12, 613-619.
doi:10.1177/1352458505070609
[6] Wurdeman, S.R., Huisinga, J.M., Filipi, M. and Stergiou, N. (2011) Multiple sclerios affects the frequency content in the vertical ground reaction forces during walking. Clinical Biomechanics, 26, 207-212.
doi:10.1016/j.clinbiomech.2010.09.021
[7] Lee, E.H., Goh, J.C. and Bose, K. (1992) Value of gait analysis in the assessment of surgery in cerebral palsy. Archive of Physical Medicine and Rehabilitation, 73, 642-646.
[8] DeLuca, P.A., Davis, R.B., Ounpup, S. and Rose, S.R. (1997) Alterations in surgical decision making in patient with cerebral palsy based on three-dimensional gait ana- lysis. Journal of Pediatric Orthopaedics, 17, 608-614. [9] Filho, M.C., Yoshida, R., Carvalho, W., Stein, H.E. and
tive outcomes in patients with cerebral palsy. Gait & Posture, 28, 316-322.
doi:10.1016/j.gaitpost.2008.01.013
[10] Kawamura, C.M., Filho, M.C., Barreto, M.M., Asa, S.K., Juliano, Y. and Novo, N.F. (2007) Comparison between visual and three-dimensional gait analysis in patients with spastic diplegic cerebral palsy. Gait & Posture, 25, 18-24. doi:10.1016/j.gaitpost.2005.12.005
[11] Chang, F.M., Hodes, J.T., Flynn, K.M. and Carollo, J.J. (2010) The role of gait analysis in treating gait abnor- malities in cerebral palsy. Orthopedic Clinics of North America, 41, 489-506.
doi:10.1016/j.ocl.2010.06.009
[12] Carriero, A., Zavatsky, A., Stebbins, J., Theologis, T. and Shefelbine, S.J. (2009) Determination of gait patterns in children with spastic diplegic cerebral palsy using prin- cipal components. Gait & Posture, 29, 71-75.
doi:10.1016/j.gaitpost.2008.06.011
[13] Bohm, H. and Doderlein, L. (2012) Gait asymmetries in children with cerebral palsy: Do they deteriorate with running. Gait & Posture, 35, 322-327.
doi:10.1016/j.gaitpost.2011.10.003
[14] Lauer, R.T., Stackhouse, C., Shewokis, P.A. and Smith, B.T. (2005) Assessment of wavelet analysis of gait in children with typical development and cerebral palsy. Journal of Biomechanics, 38, 1351-1357.
doi:10.1016/j.jbiomech.2004.07.002
[15] Gestel, L.V., Laet, T.D., Lello, E.D., Bruyninckx, H., Molenaers, G., Van Campenhout, A., Aertbeliën, E., Schwartz, M., Wambacq, H., De Cock, P. and Desloovere, K. (2011) Probabilistic gait classification in children with cerebral palsy. A Bayesian Approach Research in Deve- lopmental Disabilities, 32, 2542-2552.
[16] Toro, B., Nester, C.J. and Farren, P.C. (2007) Cluster analysis for the extraction of Sagital gait patterns in chil- dren with cerebral palsy. Gait and Posture, 25, 157-165. doi:10.1016/j.gaitpost.2006.02.004
[17] O’Malley, M.J., Abel, M. and Damiano, D. (1997) Fuzzy clustering of children with cerebral palsy based on tem- poral-distance gait parameters. IEEE Transactions on Re- habilitation Engineering, 5, 300-309.
doi:10.1109/86.650282
[18] Granata, K.P., Padua, D.A. and Abeel, M.F. (2004) Re-peatability of surface EMG during gait in children. Gait & Posture, 22, 346-350.
doi:10.1016/j.gaitpost.2004.11.014
[19] Yu, H., Alaqtash, M., Spier, E. and Sarkodie-Gyan, T. (2010) Analysis of muscle activity during gait cycle using fuzzy-ruled based reasoning. Measurement, 43, 1106-1114. doi:10.1016/j.measurement.2010.04.010
[20] Alaqtash, M., Yu, H., Brower, R., Abdelgawad, A. and Sarkodie-Gyan, T. (2011) Application of wearable sen- sors for human gait analysis using fuzzy computational
algorithm. Engineering Application of Artfical Intelli- gence, 24, 1018-1025.
doi:10.1016/j.engappai.2011.04.010
[21] Sarkodie-Gyan, T., Yu, H., Alaqtash, M., Abdelgawad, A., Spier, E. and Brower, R. (2011) Measurement of functional impairments in human locomotion using pat- tern analysis. Measurement, 44, 181-191.
doi:10.1016/j.measurement.2010.09.043
[22] Yu, F., Chen, F. and Dong, K. (2005) A Granulation- based method for finding similarity between time series, granular computing. IEEE International Conference, 25- 27 July 2005, 700-703.
[23] Yu, F. and Pedrycz, W. (2009) The design of fuzzy in-formation granules: Tradeoffs between specificity and experimental evidence. Applied Soft Computing, 9, 264- 273. doi:10.1016/j.asoc.2007.10.026
[24] Peddrycz, W. and Gacek, A. (2002) Temporal granula- tions and its application to signal analysis. Information Science, 143, 47-71.
doi:10.1016/S0020-0255(02)00179-2
[25] Winter, D.A. (2009) Biomechanics and motor control of human movement. 4th Edition, John Wiley & Sons, Ho- boken. doi:10.1002/9780470549148
[26] Cram, J.R., Kasman, G.S. and Holtz, J. (1998) Introduc- tion to surface electromyography. Aspen Publishers, Mary- land.
[27] De Stefano, A., Burridge, J.H., Yule, V.T. and Allen, R. (2003) Effect of gait cycle selection on EMG analysis during walking in adults and children with gait pathology. Gait & Posture, 20, 92-1001.
doi:10.1016/S0966-6362(03)00099-7
[28] Benedetti, M.G., Piperno, R., Simoncini, L., Bonato, P., Tonini, A. and Giannini, S. (1999) Gait abnormalities in minimal impaired multiple sclerosis patients. Multiple Sclerosis, 5, 363-368.
[29] Lopez-Meyer, P., Fulk, G.D. and Sazonov, E.S. (2011) Automatic detection of temporal gait parameters in pos- troke individuals. IEEE Transactions on Information Tech- nology in Biomedicine, 15, 594-601.
doi:10.1109/TITB.2011.2112773
[30] Tang, W., Tasch, W., Neerchal, N.K., Zahu, L. and Ya- rowsky, P. (2009) Measuring early pre-symptomatic changes in locomotion of SOD1-G93A rats—A rodent model of amyotrophic lateral sclerosis. Journal of Neu- roscience Methods, 176, 254-262.
doi:10.1016/j.jneumeth.2008.08.032