International Financial Credit Crises;
Lessons from Canada
Rashid, Muhammad Mustafa
University of Detroit Mercy, University of California Davis
19 June 2019
International Financial Credit Crises; Lessons from Canada
Table of Contents
I. Abstract . . . .. . . …………..…..3
II. Introduction . . . ………..… 4
III. Literature Review . . . . . . ………...5
a. Comparing the US and Canadian Banking System . . . ………...5
b. GDP & GDP Growth Rate . . . ………...6
c. Currency Value & Import Export Trends ………...7
d. Investments………..9
e. Consumption & Unemployment………12
f. Monetary and Fiscal Policy………...13
g. Impact on MNC’s………..14
IV. Conclusion ……. ………... 15
Abstract
The credit crises experienced in the US in year 2008 is labeled as perhaps the most significant
crises since the great depression. The roots of the crises were found in the default of the sub-prime
mortgages and the failure occurred in both the US and the UK. Due to the integrated nature of
international financial systems the spillover impacted many countries as the economies in Asia
and Europe were purchasers of the sub-prime mortgages that originated in both UK and US. The
impact of the credit crises in Canada is of unique importance due to the close proximity to US, and
both the US and Canada being of great strategic importance to each other as well as one of the
largest trading partners. Even though the international financial credit crises adversely impacted
many countries, the evidence that has come across recent years point towards the conclusion that
Canada was able to weather the crises much better than many other countries.
JEL Codes: F23, N12, N22, N32, N42, O51
Keywords: Banking System, Canada, Country Study, Financial Credit Crises, MNC’s,
Introduction
In the year 2008 the United States experienced a credit crisis that caused spillovers
throughout the international credit market. The root cause that has been identified and that led to
the credit crises, were substantial defaults on subprime mortgages. Consequently, this led to a
chain of events such as a complete stop in housing development which in turn caused reduced
spending and unemployment. Furthermore, the financial institutions that initially held the
mortgages and the securities representing the mortgages reported huge losses. At the same time
the financial institutions in the UK suffered major losses as well as they had held substantial
investments in subprime mortgages. Institutions from both Europe and Asia were purchasers of
the sub-prime mortgages that originated in the US and UK. Hence, due to the integrated nature of
international financial markets, the weakening of the U.S. and U.K. economies set of a chain
reaction and a contagion affect that impacted the economies of other countries. Therefore, there
was a reduction in imports, a reduction in the availability of credit and hence a tightening in the
credit market for MNC’s. (Haltom, 2013)
The evidence that has come across in recent years is that Canada even though impacted by
the financial credit crises was able to weather the crises much better than many other countries.
No financial institutions in Canada failed and there were no bailouts of insolvent firms. The success
of the Canadian economy to weather the financial crises when compared to the US is attributed to
how the Canadian regulatory framework differs from that of the U.S and also the its size. In
contrast to the U.S. that allowed a weak fragmented system to develop and hence, small (less)
stable banks, along with a shadow banking system of less regulated securities markets, investment
banks and money market funds, overseen by competing regulators. Canada setup a concentrated
banking system that controlled mortgage lending and investment banking under the watchful eye
Literature Review
a. Comparing the US and Canadian Banking System
Figure 1. Regulatory quality index: Value 2000-2012, retrieved from
http://www.globaleconomy.com/ Copyright 2019 by Creative Commons
2008 is not the first time that the Canadian Banking System was able to weather a financial
crisis. The Canadian system had remained unsupervised till the 1980’s and furthermore, in a period
where both the US and Canadian system was unregulated, 1830’s to 1913 – America experienced
as many as eight systematic banking crises where Canada suffered only two short lived episodes.
Hence, the evidence suggests that regulations alone cannot explain Canada’s stability in the
banking sector suggesting that perhaps Canada has found a way to balance the provision of risk
with the containment of risk. (Haltom, 2013)
The main difference between the financial system of Canada and US is as to how the
services are provided. The U.S. has a very fragmented financial system containing almost 7,000
chartered banks and a legion of regulators. Hence, depending on how the bank is charted an
American bank can be regulated by the Fed, the Federal Deposit Insurance Corporation, the Office
of the Comptroller of the Currency. In more recent times and especially since the financial crises
of 2008, the umbrella groups such as Financial Stability Oversight Council (2010), have been
created. (Rashid, 2019). On the other hand, Canada has 80 banks out of which 6 of them hold the
Office of the Superintendent of Financial Institutions (OSFI). The securities market is regulated
by Canada’s 13 provincial and territorial government, but their regulations are mostly in harmony
with each other. Although it may be argued that the size of the banking sector in the US makes it
nigh impossible to completely regulate, and that regulation and risk averse behavior may indeed
stem the tide of innovation, and investment that the US banking system is known for and which
the Canadian banking system seems to lack. (Rashid, 2019) (Madura, 2016)
b. GDP and GDP Growth Rate
Figure 2. GDP and GDP Growth Rate, Canada and US: Value 2006-2019, retrieved from
http://www.tradingeconomics.com/ Copyright 2019.
When considering the impact of the financial credit crises on Canada, a comparison of the
impact on the US produces valuable insights. We look at the specific data points that helps us
gauge the impact of credit crises on Canada as well as to providing us insights as to why the
recession occurred. Therefore, data points such as GDP growth rate, currency value, exports,
building permits, stock market index, foreign direct investment, industrial production, new orders
and bankruptcies are assessed.
We begin with an assessment of the GDP growth rate during the years of the financial
crises. The GDP growth rate remains one of the most important indicators of the economic health
of the country. Hence, when the economy is expanding the GDP growth rate is positive and when
the GDP growth rate is negative and persistent the economy is in a recession. The data for both
the US and Canada shows a significant decline in the GDP growth rate during the years of
2008-2010, with the GDP growth rate almost hovering around a -3%. Both the US and Canada see a
recovery of their GDP growth rate to a positive number towards the end of 2009 and the start of
2010. Similiarly the overall GDP of both countries shows a significant fall during the years of
2007-2010 with both the countries showing an upward trend toward the end of 2009 and the start of
2010.
c. Currency Value and Import Export Trends
Figure 5. Export and Import of Goods and Services as a percent of GDP: Value 2000-2017, retrieved from http://www.globaleconomy.com/ Copyright 2019 by Creative Commons.
Moving on to the currency value of both US and Canada we examine the trend during the
years of the Great Recession. Hence, the data points to a significant decrease of both the Canadian
Dollar and the US Dollar in the year of 2008. Furthermore, it is not until the year 2016, that the
currency value of both countries shows a steady trend and a currency value above the pre-recession
levels. When combined with an analysis of both the US and Canadian Exports, we are provided
insights as to why both the US and Canadian Dollar experienced a depreciation during the years
of the Great Recession. One of the principal reasons why a currency depreciates is due to a lack of
demand of the currency in the market caused by a reduced demand for the country’s exports.
Hence, the data for both the US and Canadian exports shows a significant decline between the
years of 2008-2010. As exports are a major component of the GDP the significant decrease in
exports during the years of the Great Recession explains the reduction in the GDP value. Although
it may be said that the fall in the Canadian dollar was a saving grace for Canada as it helped in
d. Investments
Figure 6. Canada and US Building Permits and Canada and US Bankruptcies, Value 2006-2019, retrieved from http://www.tradingeconomics.com/ Copyright 2019.
Investments are a principal factor in the calculation of a country’s GDP. Hence, our next
step is to examine the investment components of the Canada’s GDP. Since the root cause of the
financial crises is in sub-prime mortgages and the housing market, we first examine the data
relating to the issuance of housing permits in both the US and Canada. Housing constitutes to a
fixed investment in the calculation of the GDP and is then an important factor determining
over-all GDP and GDP growth. For the US we see a sharp decline in the issuance of housing permits
starting from the year 2006. The initial figure between the years of 2004-2007 stands at
approximately 9,000,000. Between 2007-2010 this figure has fallen to 2,000,000. For Canada in
the years of 2007-2010, the high is around 7,000,000 while the low, coinciding with the fall in the
US housing permits is far below the trend at 4,000,000. Such a sharp decline in the value of housing
permits, signals a significant reduction in domestic capital investment. We also assess the
bankruptcies during the years of the Great Recession. Hence, again comparing US and Canada
of approximately 175 in 2007 to 600 in 2010. For Canada the bankruptcies hover around the trend
line with a low of approximately 500 to a high of approximately 600 in the years of 2008-2010.
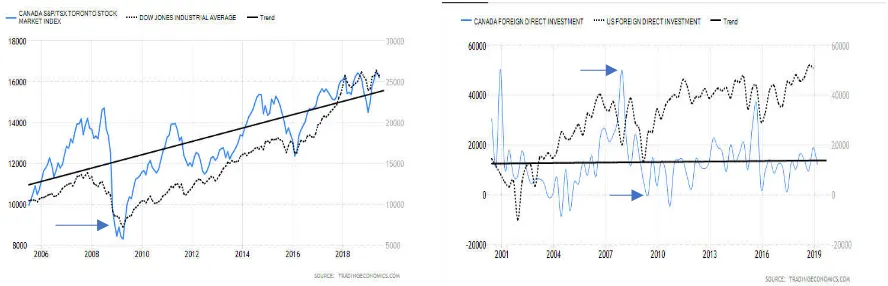
Figure 7. Capital Investment and FDI as a percentage of GDP, Value 2000-2017, retrieved from http://www.globaleconomy.com/ Copyright 2019 by Creative Commons.
Further analysis into the investment component of the GDP reveals insightful facts.
Consistent with our early analysis that there is a reduction in domestic investment, holds true when
we look at data for Capital Investment as a percentage of GDP. For Canada, Capital Investment
constitutes to 24.13% of the GDP in 2008 and declines to 22.02% of the GDP in 2009.
Furthermore, analysis of Foreign Direct Investment (FDI), a component of international trade and
investment reveals a significant reduction, from a high of 8.22% in 2007 to 4.53% in 2008 and a
[image:11.612.80.524.516.659.2]low of 1.53% in 2009.
The reduction in FDI is then reflected in Canada’s stock market index, Canada S&P/TSX
Toronto Stock Market Index. Coinciding with decline of the US Dow Jones Industrial Average
during the years 2008-2010, the Canadian Index falls from a high of 14000+ points to a low of
8000+ points. Canada’s reliance on FDI to in 2007 stood at 8.22% of the GDP and hence FDI
formed a significant portion of the GDP especially in 2007. The resultant decrease in FDI due to
the international credit crises then definitely had an impact on the overall GDP and the GDP growth
[image:12.612.110.507.260.506.2]rate. Hence, it is reasonable to say that the Canadian companies experienced liquidity problems.
Figure 9. Canada and US Industrial Production, New Orders and Changes in Inventory: retrieved from http://www.tradingeconomics.com/ Copyright 2019.
When examining domestic investments, it is important to look at production data. Inventory
investments include changes in the stock of raw material, parts and finished goods held by
businesses. Upon examining the data for inventory levels during the years of the Great Recession
we find that during the years 2008-2012 the change in inventory levels sees a sharp decline staying
well below the trend-line. Furthermore, both Canadian Industrial Production and New Orders show
e. Consumption & Labor Force Participation
Figure 10. Canada and US Unemployment, Household Debt to GDP and Consumer Spending: Value 2006-2019, retrieved from http://www.tradingeconomics.com/ Copyright 2019.
Another important component of the GDP and GDP growth rate is Consumption.
Consumption measures the market value of all goods and services that are purchased by
households. At the same time we also look at the Canadian Household Debt to GDP and
Unemployment figures during the years of the Great Recession. A fall in GDP and the GDP growth
rate signals a reduction in consumption due to a reduction in wealth. Furthermore, a fall in
Investments and the consequent fall in the levels of Inventory, Production and New Orders signal
a sharp decline in the Employment statistics of the country. This analysis is consistent with the
data as we see a sharp increase in the Unemployment rate during the years of 2008-2010 with a
peak of 8.5%+ for Canada. Furthermore, the Housing Debt for Canada shows a sharp increase
well above the trend line during the years of 2008-2010. It is the early healthy position of the
though there is a decline in Consumer Spending. The monetary and fiscal policy response during
the credit crises has a further impact on Consumer Spending.
f. Monetary and Fiscal Policy
Figure 11. Canada and US Interest Rate and Government Spending: Value 2006-2019, retrieved from http://www.tradingeconomics.com/ Copyright 2019, Value 2000-2017, retrieved from http://www.globaleconomy.com/ Copyright 2019 by Creative Commons.
The financial crises prompted a policy response from many countries. A monetary policy
response occurs when the central bank of a country uses the interest or inflation rate to control the
money supply and the cost of borrowing. A fiscal policy response occurs when the government
spending and the tax rates are used to influence economic conditions. During the period of the
financial crises there was a concentrated response from the central banks of the major countries
involved. Hence, we see a sharp reduction in interest rates as a coordinated response from both the
US and Canadian central banks. Canada’s interest rate stood at above 4%+ in 2008 although during
the years of 2008-2010 it was reduced to a 0.25%. A reduction in interest rates facilitates
investment and as our earlier analysis has shown during the time of the Great Recession the
Canadian companies experienced a credit crunch due to a large decrease in FDI. At the same-time
we see a large increase in government spending to almost a 22% of the GDP. An increase
government spending increases aggregate demand, leading to an increase in production due to
increase in consumption. The coordinated use of monetary and fiscal policy leads to a path to
g. Impact on MNC’s
The economic condition of the global economy as well as a domestic economy can have a
significant impact on the valuation of an MNC. The following is the formal process of valuing a
[image:15.612.232.366.184.248.2]MNC receiving multiple currencies over multiple periods of time.
Figure 12. MNC Valuation: International Financial Management, Jeff Madura 12th
Edition, Copyright 2019, Cengage Learning.
Where:
𝐶𝐹 𝑗, 𝑡 = cash flow denominated in a particular currency.
𝑆 𝑗, 𝑡 = exchange rate at which the MNC can convert the foreign to the domestic currency at
the end of period t.
Hence, applying this model of valuation to MNC’s based in Canada an engaged in trade
with US yields interesting results. Therefore, an MNC based in Canada will be adversely impacted
during the years of the Great Recession. This is due to the fact that US economic conditions weaken
significantly during the Great Recession. The consumers in the US suffer a fall in their income and
the unemployment rate increases sharply. The consumers now have less money to spend and their
demand for the MNC products and in our case the demand for Canadian goods decrease in the US
resulting in a reduction of cash flow for the MNC. This is reflected in our earlier analysis as we
see a large decline in the export volume for Canada and a sharp decline in the import of Canadian
good by the US. As Canadian based MNC’s experience a reduction in cash flows it will cause a
reduction in workforce hours, higher levels of unemployment and a reduction in income of both
valuation of an MNC. Hence, when the currency value of US dropped significantly during the
Great Recession, the MNC’s based in Canada saw a further reduction in their cashflow. The
monetary and fiscal policy response to the Great Recession facilitates recovery for the MNC’s.
The reduction in interest rates facilitates the expansion and borrowing and aggregate demand
stimulation increases consumer demand, consequently increasing production.
Conclusion
We start with the application of macroeconomics and international finance to access the
international credit crises. We compare the US and Canadian banking system to ascertain as to
why the Canadian system weathered the crises. GDP and GDP growth remain one of the most
important economic indicators of the well-being of an economy. Hence, this is where we start and
determine the fall in both the GDP and GDP growth rate during the Great Recession. We further
analyze the individual components of GDP and hence import, and export data and currency values
are analyzed, both of them showing a negative impact due to the fall in GDP. We take a close look
at the investments and ascertain that there is indeed a large reduction in housing permits, an
increase in bankruptcies, a reduction in capital investments, a reduction in FDI and consequently
a fall in the stock market index. Consequently, the fall in consumption expenditure and rising rate
of unemployment enforces our analysis. Therefore, we analyze the fiscal and monetary policy
responses to the credit crises and find that both fiscal and monetary instruments are used to stem
the recession. The impact on MNC’s are also analyzed and we ascertain that the credit crises
negatively impact Canadian based MNC’s due to reduction in cashflow as US imports decrease
References
Haltom, R. (2013). Why was Canada Exempt from the Financial Crises. Retrieved from Richmond Federal Reserve: https://www.richmondfed.org
Madura, J. (2016). International Financial Management. Cengage Learning.
Rashid, M. M. (2019). A Survey of US and International Financial Regulation Architecture .