Effect of Ultrasonic Wave on the Growth of Corrosion Pits
on SUS304 Stainless Steel
*1Rongguang Wang
1;*2and Keijiro Nakasa
1;*3 1Mechanical System Engineering, Graduate School of Engineering, Hiroshima University, Higashi-Hiroshima 739-8527, Japan
Anodic polarization testing of SUS304 stainless steel was carried out in an aqueous solution of 3.5 mass% NaCl at a potential increasing at a constant rate of 20 mV/min. When the current density reached 2, 10 or 50 A/m2within the pitting corrosion region, the potential was kept at a
constant value for 600 s at each current density. The ultrasonic wave (UW) was applied to the specimen from the beginning of test or just after the current density reached one of these constant values. The current density in these cases was compared with that without the application of UW. The results indicated that when the UW was applied from the beginning of test the current density was not affected by the application of UW in both the cathode and passive regions, but the increase in current density was suppressed by UW when the potential was kept at the constant value after the current density reached 10 or 50 A/m2. Also when the UW was applied just after the current density reached 2, 10 or
50 A/m2and the potential was kept at the constant value, the increase rate of current density was reduced by the application of UW. At the same
time, the number and size of pits were decreased by the application of UW. The reason for the decrease in pitting corrosion was considered to be that UW destroyed the corrosion product on pits and the stirring effect of UW decreased the concentration of hydrogen and chloride ions in the pits, which accelerated the formation of a passive film on the pit wall. [doi:10.2320/matertrans.48.1017]
(Received December 27, 2006; Accepted February 16, 2007; Published April 25, 2007)
Keywords: stainless steel, ultrasonic wave, corrosion pit, passive film
1. Introduction
The high corrosion resistance of stainless steels originates from the formation of passive film on the surface. However, the pitting corrosion often occurs when the passive film is locally broken down by the chloride ions in solutions. The pit growth is always accompanied by corrosion product covering them and it accelerates the pit growth by promoting the
accumulation of hydrogen and chloride ions in the pits,i.e.,
the hydrogen ions are produced in the anodic and hydrolysis reactions in pits and the chloride ions migrate from outside to
neutralize the excessive positive charges.1)The authors2)had
confirmed the corrosion product on a SUS304 stainless steel in NaCl aqueous solution using an atomic force microscope (AFM). However, after the scanning of AFM probe removed the corrosion products, the growth rate of pits became
small.2)This was explained by the re-passivation of the inner
walls of pits due to the decrease in hydrogen and chloride ions in pits by the stirring effect of AFM probe.
Addition of chromium, molybdenum and nitrogen ele-ments is known to be effective to improve the pitting resistance of stainless steels by promoting the formation and
stabilization of compact passive film.3–7)In these steels, the
passive film is difficult to be broken down, and even if the passive film is broken down the pitting corrosion can be easily stopped by the re-passivation of pits. If there is a simple method to remove the corrosion product covering pits,
the growth of pits will be suppressed even for the steels that do not contain much alloying elements above. It has been reported that the cavitations produced by the strong ultra-sonic wave (UW) in liquid destroy the passive film and
activate the corrosion reaction of steel surface.8–10)
There-fore, the UW can be used also to remove the corrosion products covering pits. However, the influence of UW on the growth of pitting on stainless steel in chloride solutions has not been examined. In this research, the UW was applied to the stainless steel surface in sodium chloride solution and the growth behavior of corrosion pits was investigated.
2. Experimental Method
The material used for specimens was commercially supplied solution-treated SUS304 stainless steel plate (com-position: C: 0.05 mass%, Si: 0.63%, Mn: 0.90%, P: 0.032%, S: 0.002%, Cr: 18.05%, Ni: 8.10%, Fe: Bal.). The plate was
cut to 15 mm15 mm1 mm rectangular specimens and
one side was polished by #600 emery paper. The specimens were immersed in 10 mass% nitric acid solution at 333 K for 1.8 ks aiming at the formation of compact oxide film to prevent the crevice corrosion in the following pitting corrosion tests. The specimens were ultrasonically cleaned
in acetone and the central area of’¼8mm on the polished
side was again polished by #800 emery paper. This central area was used as the test area and the remaining area was sealed with solidified liquid silicon gum.
Pitting corrosion tests were carried out using a corrosion cell attached with potentiostat apparatus (HAB-151, HOKU-TO. Co.) and an ultrasonic wave cleaner (Yamato Co., Branson 2510J-MTH, 100 W, 42 kHZ) as shown in Fig. 1. The specimen was immersed in 3.5 mass% NaCl aqueous solution kept at 308 K. The counter electrode was platinum and the reference electrode was saturated calomel electrode (S.C.E.). The polarization was started from the cathode side
*1This Paper was Originally Published in Japanese in J. Japan Inst. Metals
70(2006) 226–232.
*2Corresponding author, E-mail: wangrg@cc.it-hiroshima.ac.jp;
Present address: Department of Mechanical Systems Engineering, Faculty of Engineering, Hiroshima Institute of Technology, Hiroshima 731-5193, Japan
*3Present address: Department of Mechanical Engineering, Faculty of
Engineering, Hiroshima Kokusai Gakuin University, Hiroshima 739-0321, Japan
(ES.C.E.¼ 600mV) to the anode side at a constant potential increasing rate of 20 mV/min under the control of the potentiostat. The current on the specimen surface was output to a data recorder.
[image:2.595.330.525.70.332.2]The procedure of polarization and the timing of applying UW in the polarization tests are schematically shown in
Fig. 2. With the linear increase in potential, the current changes from the cathode and passive zone to the pitting zone where the current density largely increases with small increase in potential. When the anodic current density
reached a value ofi0¼2, 10 or 50 A/m2in the pitting zone,
the potential was immediately held constant for 600 s. The
UW (intensity: 3103W/m2) was applied in 3 types of
conditions,i.e., (i) not applying UW (hereinafter it is called
the condition A); (ii) applying UW simultaneously with the holding of potential (condition B); (iii) applying UW from the beginning to the end of the polarization (condition C). For each condition, at least 3 tests were carried out. Although the potential at the beginning of pitting corrosion is different in each specimen, the potential corresponding to the above constant current density was kept for 600 s in all conditions. After the polarization tests, the corrosion-pits were observed by an optical microscope, and the total number, the surface area and the depth of pits were measured on each specimen. The depth of pits was obtained by focusing and moving the optical lens between bottom and surface of pits.
3. Results and Discussion
3.1 Effect of UW application on corrosion current density
Figures 3, 4, 5 show the polarization curves in the conditions A, B and C when the potential was held for
600 s after the anodic current density reachedi0¼2, 10 and
50 A/m2, respectively. For all the polarization curves, the
current density changes from cathodic current to anodic one
near the time t¼1:5ks (E¼ 100mV) irrespective of the
Temperature
Ultrasonic wave units (b)
Potentiostat Functiongenerator
Salt bridge
3.5% NaCl solution Specimen
Water (308K)
Pt plate
controller KCl
Reference electrode (a)
15mm
φ8mm
15mm
Fig. 1 Specimen (a) and apparatus (b) for corrosion test.
Potential,
E
Current density,
i
Time, t i0=2, 10, 50A/m2
A
C
B
E i
Without U.W.
i (Anodic) (Cathodic)
U.W.
Fig. 2 Procedure of polarization test and timing for applying ultrasonic wave on specimens. A: without ultrasonic wave B: application of ultrasonic wave for 600 s after the current density reached 2, 10 or 50 A/m2, and C: application of ultrasonic wave from the beginning of test.
10-4
10-2
100
102
104
10-4
10-2
100
102
10-4
10-2
100
102
-600 -400 -200
0 200 400
-600 -400 -200
0 200 -600 -400 -200
0 200
Current density,
i
/A
m
-2
Potential,
E/
mV
0 1000 2000 3000
Time, t/s
A
B
C
i0=2A/m2
anodic cathodic
E
E
E i
i
i
UW
UW
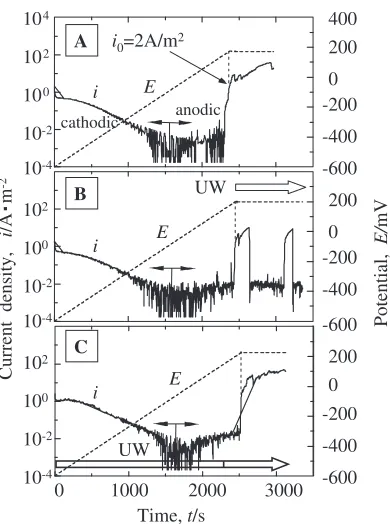
Fig. 3 Current density change when applying potential and ultrasonic wave on specimen. Potential was held when current density reached
i0¼2A/m2. A: without ultrasonic wave, B: application of ultrasonic
wave for 600 s after the current density reached 2 A/m2, and C: application
[image:2.595.50.286.71.372.2] [image:2.595.54.278.415.645.2]application of UW. No significant difference is found in the corrosion potential and in the current density in cathodic zone, anodic passive zone between the condition A (without UW) and condition C (with UW from the beginning). This indicates that the UW does not break the passive film down, or the partially broken passive film has been easily re-passivated. However, as is shown in Fig. 5 (condition C), an active anodic current peak appears in the passive zone. This
means that the breakdown of passive film occurs by UW although it was observed only once for 20 tests.
Effect of UW was observed mainly in pitting region. In the condition A shown in Fig. 3(A), when the anodic current
density reached i0¼2A/m2 at about t¼2:5ks and the
potential (E¼190230mV) was held at a constant value,
the current density slowly increased with time. Since the potential is in the pitting corrosion zone, the gradual increase 10-4 10-2 100 102 104 10-4 10-2 100 102 10-4 10-2 100 102 -600 -400 -200 0 200 400 -600 -400 -200 0 200 -600 -400 -200 0 200
Current density,
i / A m -2 Potential, E /mV
Time, t/s
0 1000 2000 3000
A
B
C
i0=10A/m2
anodic cathodic E E E i i i UW UW
Fig. 4 Current density change when applying potential and ultrasonic wave on specimen. Potential was held when current density reachedi0¼
10A/m2. A: without ultrasonic wave, B: application of ultrasonic wave
for 600 s after the current density reached 10 A/m2, and C: application of
ultrasonic wave from the beginning of test.
10-4 10-2 100 102 104 10-4 10-2 100 102 10-4 10-2 100 102 -600 -400 -200 0 200 400 -600 -400 -200 0 200 -600 -400 -200 0 200
0 1000 2000 3000
Current density,
i / A m -2 Potential, E /mV
Time, t/s
A
B
C
i0=50A/m2
anodic cathodic E E E i i i UW UW
Fig. 5 Current density change when applying potential and ultrasonic wave on specimen. Potential was held when current density reachedi0¼
50A/m2. A: without ultrasonic wave, B: application of ultrasonic wave
for 600 s after the current density reached 50 A/m2, and C: application of
ultrasonic wave from the beginning of test.
10 200 400 10 200 400 10 200 400 Time, t/ks 50 2000 4000 50 2000 4000 50 2000 4000
2.5 3.0 3.5 2 20 60 40 2.0 40 2 2 20 20 40
Current density,
i
/ A
m
-2
2.5 3.0 3.5
2.0 2.0 2.5 3.0 3.5
i0= 2A/m2 i
0=10A/m2 i0= 50A/m2
A B C A B C A B C
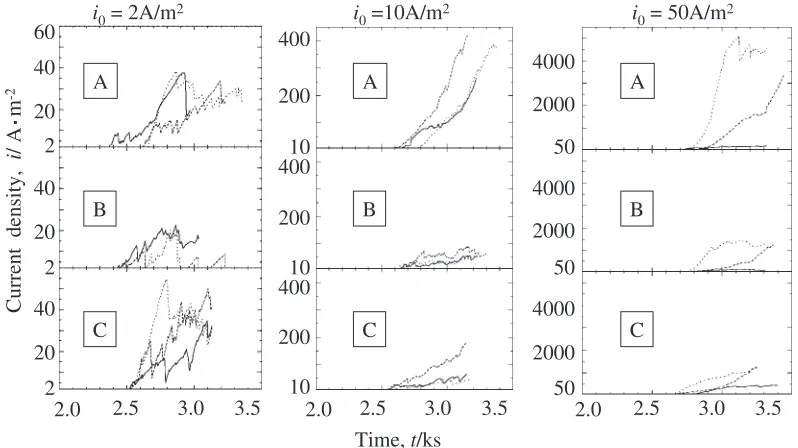
Fig. 6 Relationship between time and current density after the potential was held constant when current density reachedi0¼2, 10 or
50 A/m2. A: without ultrasonic wave, B: application of ultrasonic wave for 600 s after the current density reached 2, 10 or 50 A/m2, and
[image:3.595.72.264.71.324.2] [image:3.595.328.526.72.325.2] [image:3.595.99.498.408.632.2]in current density corresponds to the stable growth of pits. On the other hand, in the condition B with simultaneous holding of potential and applying of UW, two typical results were obtained. One is almost the same as that in the condition A, and another is that the current density sharply decreased to the passive current density level (Fig. 3(B)). It ought to be the re-passivation of the broken passive film and the stop of the growth of pits. In the condition C, where UW was applied from the beginning of the polarization, no significant change of current density was found.
According to Fig. 4, the time when the current density
reaches i0¼10A/m2 is about t¼2:6ks and the potential
ranges between 200250mV. In the condition A, the
current density during the potential holding period increases
faster than for i0¼2A/m2 (Fig. 3(A)). In addition, the
increase in current density in condition A (without UW) is much faster than the condition B and C (with UW).
As shown in Fig. 5, after about t¼2:7ks from the
beginning of the polarization, the anodic current density
reaches i0¼50A/m2 and the potential is about300320
mV. The increase in current density during the holding of potential is larger than those in Fig. 3 and Fig. 4, but the increase rate of current density is reduced by the application of UW.
In Fig. 3–Fig. 5, only one polarization curve for each condition is shown and the influence of UW application on the pitting corrosion current density is not so clear because of the logarithmic scale of vertical axis. Figure 6 shows three representative anodic current vs. time curves during the holding of potential at constant values after the anodic
current density reachesi0¼2, 10 or 50 A/m2. Despite of the
differenti0, the increase rate of current density is smaller in
the condition B than in the condition A under constant potential. In the condition C, the increase rate of current
density is also smaller except in the case of i0¼2A/m2.
Consequently, the growth of pits on stainless steel is suppressed by the UW application.
3.2 Observation of specimen surface and calculation of electric charge density for pit formation
Figure 7(a), (b) and (c) show the specimen surfaces after
holding of potential for 600 s at the current density ofi0¼2,
10 and 50 A/m2for three conditions. In the case ofi0¼2A/
m2, only few pits are observed as are marked by arrows. It is
clear from Fig. 7 that the density of pit becomes more when
the current density i0 and the increasing rate of current
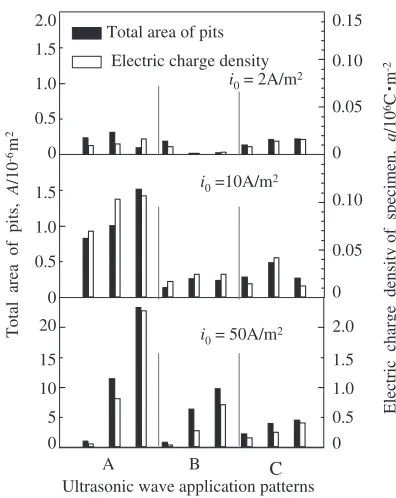
density during holding of potential are larger (Fig. 6). Figure 8 shows the total area of pits and the electric charge density for each specimen. The electric charge density was calculated by integrating the current density during the 600 s
holding of potential after the current density reachedi0¼2,
10, 50 A/m2. It corresponds to the dissolution amount of
metal ions into solution. The electric charge density changes with the total area of pits almost in the same ratio, meaning that the pits grow both in the depth and radius direction. In
the case ofi0¼2A/m2, the total area of pits and the electric
charge density in the conditions A (without UW) and C (with UW from the beginning) are almost the same, whereas those
in the condition B (with UW from i0¼2A/m2) is rather
small. In the case ofi0¼10or 50 A/m2, both the total area of
pits and the electric charge density in the conditions B and C are much smaller than those in the condition A.
Table 1 shows the total number of pits, the total area of pits and the calculated average area of each pit for 3 specimens in
each condition. In the case ofi0¼2A/m2, the total number
(a)
i
0=2A/m
2(b)
i
0
=10A/m
2(c)
i
0=50A/m
2A
B
C
A
B
C
A
B
C
Fig. 7 Optical aspects of specimen surface after polarization tests.
0 0.5 1.0 1.5 2.0
0 0.5 1.0 1.5
0 0.05 0.10 0.15
0 0.05 0.10
0 5 10 15 20
0 0.5 1.0 1.5 2.0
Total area of pits,
A
/10
-6m
2
Electric charge density of specimen,
q
/10
6C
m
-2
i0= 2A/m2
i0=10A/m2
i0= 50A/m2
A B C
Ultrasonic wave application patterns Total area of pits
Electric charge density
[image:4.595.85.510.74.205.2] [image:4.595.326.524.246.495.2]of pits in the conditions A and B are almost the same. However, the total area of pits and the average area of each pit in the condition B are smaller than those in the condition A. Furthermore, the total number of pits in the condition C is more than that in the condition B, while the average area of each pit in the condition C is almost the same as that in the
condition B. In the case of i0¼10 or 50 A/m2, the total
number of pits and the average area of each pit are small in the conditions B and C compared with those in the condition A. These mean that the decrease in the total area of pits by the application of UW is caused both by the decrease in the total number of pits and the decrease in the area of each pit.
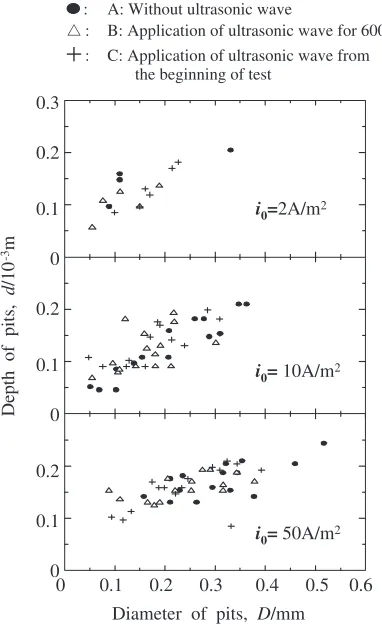
The relations between diameter and depth of pits in each current density and UW condition are plotted in Fig. 9. No significant influence of UW application on the ratio of diameter to depth of pits can be found. Consequently, the shape of pits is not changed but their total number and growth rate are decreased by the application of UW.
According to the above analysis, small number and small size of pits are formed on the specimen surface before the
current density reaches i0¼2A/m2. These pits grow with
the nucleation of new pits during the following 600 s holding of potential. However, they grow slowly and the number of newly formed pits is small. When the UW is applied, it is possible that the growth of some pits is stopped by re-passivation. Before the current density increases from 2 A/
m2to 10 A/m2, more and larger pits form on the surface and
they become larger with the nucleation of new pits during the following 600 s holding of potential. When the UW is applied, the growth of pits is suppressed and the total number of newly formed pits is less compared with that in the case not applying UW. Before the current density reaches
i0 ¼50A/m2, much more pits have already grown largely
and some of them have connected with others. When the UW is applied, the growth of pits becomes slower, but the tendency to connect with each other still exists.
3.3 Mechanism of suppression of pit growth by the application of UW
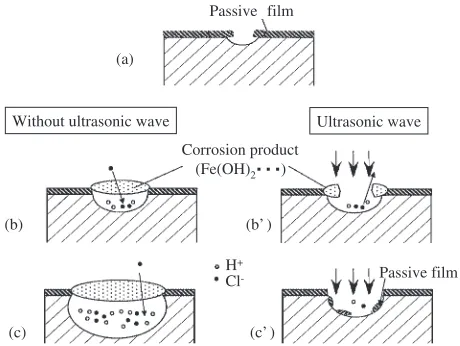
When the UW is applied to a specimen in a liquid, many fine bubbles are formed on specimen surface, and the collapse of the bubbles produces instantaneous local high pressure with shock wave. This phenomenon, cavitation, is widely used for cleaning, dispersion, cohesion, stirring and
mixing of materials in liquid.
When the UW is applied to the stainless steel surface with growing corrosion pits, the growth rate of pits is decreased. The mechanism is schematically shown in Fig. 10. When the UW is not applied, pits grow on the specimen surface (a) and
corrosion product covers the pit (b).1,2)The growth of pit is
accelerated due to the hydrogen ions produced by hydrolysis
reaction and the chloride ions attracted from solution (c).1)
When the UW is applied to the specimen surface, the
corrosion product is removed by the cavitation of UW (b0).
[image:5.595.46.551.85.234.2]The concentration of corrosive hydrogen ions and chloride ions decreases due to the stirring effect of cavitation, and the growth rate of pits decreases. Especially when the current
Table 1 Total number of pits, total area of pits on three specimens and average area of each pit after polarization test. Ultrasonic wave
application pattern i0¼2A/m
2 i
0¼10A/m2 i0¼50A/m2
Total number A 10 79 307
of pits on three B 10 45 192
specimens C 19 47 184
Total area of pits A 0.64 3.35 35.8
on three specimens B 0.23 0.64 16.9
(106m2)
C 0.57 1.04 10.7
Average area A 0.06 0.04 0.12
of each pit B 0.02 0.01 0.09
(106m2)
C 0.03 0.02 0.06
Diameter of pits, D/mm
0 0.1 0.2 0.3 0.4 0.5 0.6
0 0.1 0.2 0.3
0
0 0.1
0.1 0.2
0.2
Depth of pits,
d
/10
-3m
i0= 10A/m2
i0= 50A/m2 i0=2A/m2
: C: Application of ultrasonic wave from : B: Application of ultrasonic wave for 600s : A: Without ultrasonic wave
the beginning of test
[image:5.595.329.520.262.574.2]density before the application of UW is small and corrosion rate is small, the re-passivation can occur on the inner wall of
pits (c0).
The potentials when the anodic current density reaches
i0 ¼2, 10 or 50 A/m2 are almost the same regardless of the
condition A (without UW) and C (with UW from the beginning of the polarization) or the number of nucleated pits. It might be attributed to that the change of resistance is small compared with that of the solution even if the corrosion product is removed and the concentration of hydrogen and chloride ions is decreased by the application of UW.
In the case of i0 ¼2A/m2, the current density sharply
drops and increases during the holding time in the condition B but not in the condition C (Fig. 3). Furthermore, the increase in current density with increasing holding time is larger in the condition C (Fig. 6). It should be attributed to the difficulty of re-passivation in the pits in the condition C, because the pit size is small and the accumulated corrosion product stably covers the pit to enrich the hydrogen and chloride ions inside. On the other hand, in the condition B, the corrosion product can be suddenly removed by the application of UW and the re-passivation occurs by the
stirring effect. In the case of larger current density ofi0¼10
or 50 A/m2, the effect of UW application is large both in the
conditions B and C. This can be resulted from the weak structure of the corrosion product that the diameter of corrosion product on the pit is large. Thus, the corrosion product can be easily removed by the UW application.
Except the above physical effect of UW application in solution, a chemical effect should also be considered. When the UW is applied to an aqueous solution, water can be
decomposed to H and OH radicals, and the solution
becomes weak acidic.8) According to the report of Jana,8)
about 31021/m3 radicals are produced by the UW
(frequency: 20 kHz, intensity: 1:9105W/m2) and four
OHtransfer one Fe2þion to one Fe3þ. The frequency of the
UW in this research was 40 kHz, and the intensity on the
specimen surface is as smaller as about3103W/m2, and
the application time is short. Therefore, the amount of
radicals produced will be not large. However, it is possible that there is a contrary influence of radicals on the pitting corrosion behavior considering the breakdown of passive
film by lowered pH solution by H radical and the
re-passivation of the broken passive film by the OHradical with
strong oxidation ability.
4. Conclusions
SUS304 stainless steels were polarized in 3.5 mass% NaCl aqueous solution until pitting corrosion occurred on the
surface. When the anodic current density reachedi0¼2, 10
or 50 A/m2, the potential was held at a constant value for
600 s. The changes of anodic current densities during the 600 s were investigated under the application of ultrasonic wave (UW). Specimen surface was observed after the polarization, and the total number of pits, the area of pits and the depth of pits were measured. The results obtained are as follows:
(1) The cathodic current, passive current and corrosion potential in the polarization curve were not almost changed by the application of UW.
(2) When the anodic current density reachedi0 ¼2A/m2
and the potential was held at a constant value, the simultaneous application of UW resulted in a
re-passivation of pits. In the case ofi0¼10or 50 A/m2,
the application of UW resulted in the large reduction in the increasing rate of anodic current density as well as the total number and the area of total pits formed on specimens.
(3) The reason for the suppression of pit growth by UW should be attributed to the decrease in corrosive hydrogen ions and chloride ions concentrated in the pit by removing the corrosion product covering the pit and stirring the solution in pit.
Acknowledgement
The authors are very grateful to Mr. T. Tamari for his assistance of experiment.
REFERENCES
1) G. Wranglen:An Introduction to Corrosion and Protection of Metals, (Chapman and Hall, 1985) pp. 95–96.
2) Q. Zhang, R. Wang, M. Kato and K. Nakasa: Scripta Mater.52(2005) 227–230.
3) M. Kaneko and H. S. Isaacs: Zairyo-to-Kankyo (Corros. Eng.) 50
(2001) 226–230.
4) T. Fukutsuka, F. Anzai, M. Kaneda, Y. Matsuo, Y. Sugie and K. Fukaura: J. Soc. Mat. Sci., Japan53(2004) 1175–1179.
5) A. S. Vanini, J. P. Audouard and P. Marcus: Corrosion Science36
(1994) 1825–1834.
6) H. Baba, T. Kodama and Y. Katada: Corrosion Science 44(2002) 2393–2407.
7) G. C. Palit, V. Kain and H. S. Gadiyar: Corrosion49(1993) 977–991. 8) A. K. Jana and S. N. Chatterjee: Ultrasonics Sonochemistry2(1995)
s87–s9177.
9) R. C. Alkire and S. Perusich: Corros. Sci.23(1983) 1121–1125. 10) C. T. Kwok, F. T. Cheng and H. C. Man: Mater. Sci. Eng. A290(2000)
145–154.
(a)
(b)
(c)
Corrosion product (Fe(OH)2 )
Passive film
Ultrasonic wave Without ultrasonic wave
H+
Cl- Passive film
(b’)
[image:6.595.53.283.73.246.2](c’)