Molecular Dynamics Simulation of Sintering and Surface Premelting
of Silver Nanoparticles
H. A. Alari
fi
1, M. Atis
2, C. Özdo
ğ
an
3, A. Hu
1,+, M. Yavuz
1,3and Y. Zhou
11Department of Mechanical and Mechatronics Engineering, Centre for Advanced Material Joining, University of Waterloo,
200 University Avenue West, Waterloo, Ontario N2L 3G1, Canada
2Department of Physics, Nevsehir University, 2000 Evler, 50300 Nevsehir, Turkey
3Department of Materials Science and Engineering, Çankaya University, Yenimahalle, 06810 Ankara, Turkey
Sintering of Ag nanoparticles (NPs) is increasingly being used as a driving mechanism for joining in the microelectronics industry. We therefore performed molecular dynamics simulations based on the embedded atom method (EAM) to study pressureless sintering kinetics of two Ag NPs in the size range of (4 to 20 nm), and sintering of three and four Ag NPs of 4 nm diameter. We found that the sintering process passed through three main stages. Thefirst was the neck formation followed by a rapid increase of the neck radius at 50 K for 20 nm particles and at 10 K for smaller NPs. The second was characterized by a gradual linear increase of the neck radius to particle radius ratio as the temperature of the sintered structure was increased to the surface premelting point. Different than previous sintering studies, a twin boundary was formed during the second stage that relaxed the sintered structure and decreased the average potential energy (PE). The third stage of sintering was a rapid shrinkage during surface premelting of the sintered structure. Based on pore geometry, densification occurred during thefirst stage for three 4 nm particles and during the second stage for four 4 nm particles. Sintering rates obtained by our simulation were higher than those obtained by theoretical models generally used for predicting sintering rates of microparticles. [doi:10.2320/matertrans.MD201225]
(Received December 17, 2012; Accepted April 3, 2013; Published May 25, 2013)
Keywords: molecular dynamics, silver nanoparticles, sintering, shrinkage, densification, twin boundary
1. Introduction
Ag nanoparticles (NPs) have been extensively used for development of lead free soldering materials,1) wire bond-ing2) and in construction of nano scale devices.3) Some of these applications require the Ag NPs to sinter in order to achieve joining with other structures. Generally, sintering of NPs occurs at much lower temperatures than microparticles and might be driven by more than one mechanism such as surface diffusion, grain boundary diffusion, lattice diffusion, mechanical rotation, plastic deformation, and evaporation-condensation.4)
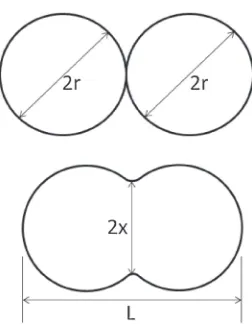
In prior work, sintering studies on NPs were numerically performed on Au,5,6) Cu6,7) and Ni8)and experimentally on ZrO29) and showed enhanced sintering rates due to higher diffusion coefficients for nano-sized materials and a large driving force of sintering, which is caused by high curvature of the NPs surfaces. Generally, sinterability of two particles is measured by the change in the neck radius to particle radius ratio (x/r) or by shrinkage ([4r¹L]/4r).10) As shown in Fig. 1,r is the particle radius,xis the radius of the formed neck between the two NPs, and L is the final length of sintered NPs.
Traditionally, sintering is characterised by three stages. The first is neck formation between two particles followed by a rapid increase in the neck radius. The second is gradual increase in the neck radius and the third is densification of the structure.11) However, the previously developed sintering theories were based on sintering of microparticles and may not be valid for NPs.10) Thus, we have used our own linear scaling parallel molecular dynamics (MD) code to simulate the sintering process of Ag NPs in the size range of (4 to 20 nm).12) The code allowed us to utilize
multiple processers simultaneously and hence to simulate relatively large NPs. We have found that sintering of two NPs passed also through three main stages. The first stage confirms previous sintering studies and was characterized by neck formation and rapid increase in the neck radius, which occurred at 50 K for 20 nm particles and at 10 K for smaller particles. The second stage was linear gradual increase of the neck radius to particle radius ratio (x/r) as the temperature increased toward the surface premelting point of the sintered structure. A twin boundary was formed during this stage, which relaxed the sintered structure and decreased the average potential energy (PE). Based on pore geometry, we found that densification occurred during the first stage for three 4 nm particles and during the second stage for four 4 nm particles. We showed that the third stage was characterized by rapid shrinkage of the structure and was driven by the surface premelting of the
Fig. 1 Geometrical parameters of two particles during the sintering process.
+Corresponding author, E-mail: a2hu@uwaterloo.ca
Special Issue on Nanojoining and Microjoining
[image:1.595.364.490.368.531.2]sintered structure. Our results showed higher sintering rates than those predicted by previous theoretical models for microparticles.
2. Theoretical Methods
2.1 Computational methods
The Ag atoms in each NPs were arranged based on FCC truncated Marks decahedra (Dh) structure that defines planes (100) and (111) as surface facets.13) The simulation of the sintering process of the NPs was based on the Voter-Chen version14)of the embedded atom method (EAM) potential.15) We implemented Hamming forth order predictor corrector with a step size of 2 femto seconds, which was found to be precise enough to guarantee conservation of the total kinetic energy (KE) within an accuracy range of 0.030.15%. Prior to heating, each NP was relaxed at 300 K (room temperature) for 20 pico seconds. The initial velocities of atoms in the NPs were generated according to the Maxwell-Boltzmann dis-tribution. The temperature of the system was calculated via the equibarition theorem. Heating of NPs was then gradually applied by increasing the average KE of all atoms based on the ratio between the target temperature and the present temperature. The holding time of the structure at each temperature was 20 ps.
The temperature of the structure was calculated by the following equation
T ¼kð32NhEki6Þ ð1Þ
where k is the Boltzmann constant, Ek is the total kinetic energy of the atoms in the NP, andNis total number of atoms in the NP. The heating process was started at 10 K and then periodic heating with a temperature step of 50 K was applied to the sintered structures in a range of temperatures (50 to 1675 K) except for the range of (825 to 1275 K) in which the temperature step was reduced to 10 K to capture the effect of surface premelting on the sintering behavior. The initial temperature in this range is less than the surface premelting temperature of a 4 nm particle (977 K), while the final is higher than the melting point of the bulk (1235 K).16)Atomic arrangements of the NPs during the heating process were shown by plotting three atomic planes at the center of sintered structure.
2.2 Analytical methods
Sintering can be driven by various mechanisms such as surface diffusion, grain boundary diffusion, and lattice diffusion. Diffusion coefficients of NPs are size and temper-ature dependent and can be calculated by the following equation.17)
Dðr; TÞ ¼Doð1Þexp Eð1Þ
RT exp
2Svibð1Þ 3R 1 r ro 1 2 6 6 6 4 3 7 7 7 5 2 6 6 6 4 3 7 7 7 5ð2Þ
whereris the NP radius,Tis the temperature,Do(¨) is the bulk pre-exponential constant, which is equal to (Do(¨)= 5©103m2/s) for surface diffusion, (D
o(¨)=1.2©10¹5 m2/s) for grain boundary diffusion, and (D
o(¨)=4.4©
10¹5m2/s) for volume diffusion,18)E(¨) is bulk activation energy and is equal to (E(¨)=2.661©105J/mol), (E(¨)=9©104J/mol), and (E(¨)=18.5©104J/mol) for surface diffusion, grain boundary diffusion, and lattice diffusion, respectively,18) Svib(¨) is the vibrational compo-nent of melting entropy of the bulk and is equal to 7.98 J/mol.K,19) ro is the radius of NP at which all atoms are located on the surface and is equal to 0.96 nm for Ag,20)and Ris the universal gas constant (8.314 J/mol.K).
Rates of sintering can be determined based on the change in neck radius to particle radius ratio (x/r), which can be calculated by the following equation:21)
x r ¼
Bt rm
1=n
ð3Þ
where t is the sintering holding time, B is a temperature dependent sintering function, the values of n and m vary based on the sintering diffusion mechanism. If sintering is driven by surface diffusion, eq. (3) becomes
x r surf ¼
4:17¤Ds£svt r4RT
1=6
ð4Þ
where ¤ is the surface layer thickness and is estimated as 0.3 nm for Ag,18) Ds is the surface diffusion coefficient calculated by eq. (2), £sv is the bulk solid-vapor interfacial surface energy and is estimated as 1.14 J/m2 for Ag,22) and ³ is the molar volume (10.3 cm3/mol for Ag). If sintering is driven by grain boundary diffusion, eq. (3) becomes
x r gb¼
32wDgb£svt r4RT
1=6
ð5Þ
where w is the grain boundary width and is estimated as 0.5 nm for Ag,18) and D
gb is the grain boundary diffusion coefficient, which can be calculated by eq. (2). For lattice diffusion sintering, eq. (3) becomes
x r 1¼
42:05D1£svt r3RT
1=4:78
ð6Þ
where Dl is the lattice diffusion coefficient calculated by eq. (2).
3. Results and Discussion
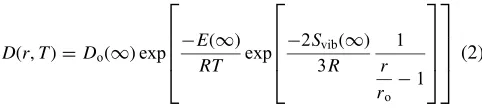
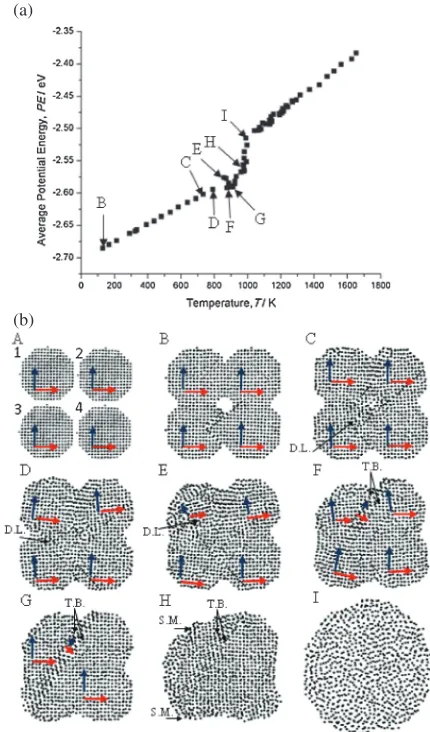
[image:2.595.49.290.682.736.2]distance and miss-oriented by 30°. Once heating was started at point B, particle 2 rotated in anti-clockwise direction and formed a neck with particle 1. The rotation of particle 2 was to minimize the interfacial energy at the grain boundary (G.B.) formed at the neck between the two particles (grains). The neck radius increased as heating continued to point C, which resulted in formation of an edge dislocation (D.L.) inside particle 2 that climbed to the surface at point E. Dislocation climb during sintering has been discussed in previous studies and was attributed to either vacancy annihilation or sintering stress exceeding the yield stress at the sintering temperature.10) At point E, a new grain was formed at the neck region that has slightly different ½101 direction than the½101directions inside the two particles. It is reasonable to deduce that the shear stress at the neck region has twisted this grain and formed a twin boundary (T.B.). The mirror crystallographic image on both sides of the twin boundary is a special characteristic of twin boundaries.23) This process relaxed the structure and slightly reduced the
slope of the PE curve as shown in Fig. 2(a). As the temperature increased to point G, average PE values in-creased rapidly as an indication of surface premelting (S.M.) shown by amorphous regions in the atomic plot. The amorphous regions first appeared at highly curved regions of the surface, which confirms the curvature effect on melting of nanoparticles.24)Rapid shrinkage only occurred during the melting process at the second stage of the PE curve. The two particles merged into one particle at point I, which is the melting point of the sintered structure. The slight change in the shape of the sintered structure between point A and C was due to the rigid rotation of the structure, which was also observed in the simulation domain during sintering of Au NPs.5)
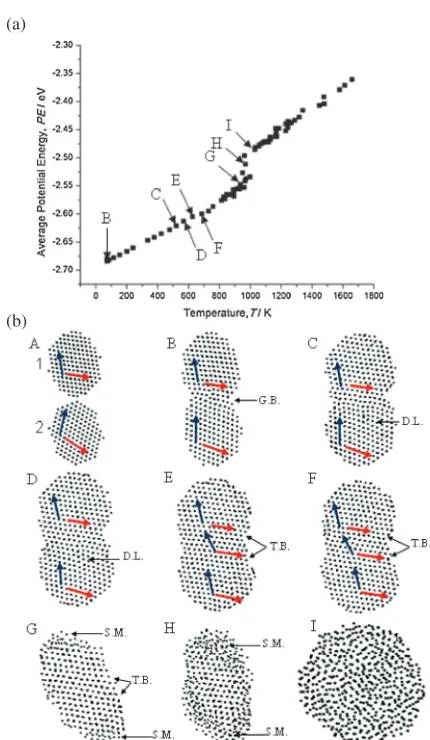
Sintering of two NPs of 4 nm as well as larger particles was divided into three main stages shown in Fig. 3. Thefirst stage is shown in Fig. 3(a) and was formation of a neck between the two NPs followed by a rapid increase in neck radius to particle radius ratio (x/r) at 50 K for 20 nm particles and at 10 K for smaller particles. Rapid increase in the ratio was observed at the beginning of heating before the ratio became constant for all sizes of NPs. Figure 3(a) also shows a slight increase in the neck radius to particle radius (x/r) as the temperature is increased to 100 K. Sintering of smaller Ag clusters was confirmed by MD simulation at 0.01 K and experimentally by transmission electron microscopy (TEM) at room temperature for Ag nanowires.25,26)According to the author’s best knowledge, sintering of NPs has not previously been experimentally examined below room temperature although it could be performed on a TEM stage cooled by liquid Nitrogen. The second stage of sintering showed gradual increase in the neck radius to particle radius ratio (x/r) as the temperature of the sintered structure reached its own surface premelting point. The increase of this ratio was linearly fitted as shown in Fig. 3(b). Figure 3(c) shows that sintering rates of two 4 nm particles and two 20 nm particles obtained by our simulation were higher than these obtained by theoretical models based on surface diffusion, grain boundary diffusion, and lattice diffusion. This is because the sintering process appeared to be driven by other mechanisms including mechanical rotation and dislocation climbing. Figure 3(d) shows the shrinkage rate of the sintered structure during the heating process. The shrinkage rate shows a small fixed value during the second stage of sintering and a rapid increase as the temperature reached the surface premelting temperature of the sintered structure. We characterize the rapid shrinkage between surface premelting point and melting point of the sintered structure as the third stage of sintering. The temperature regime in which the rapid shrinkage and melting occurred increased as the size of the NPs increased. This agrees with our previous work that suggested that the temperature regime at which melting of one single NP occurs increases as the size of the NP increases.16)
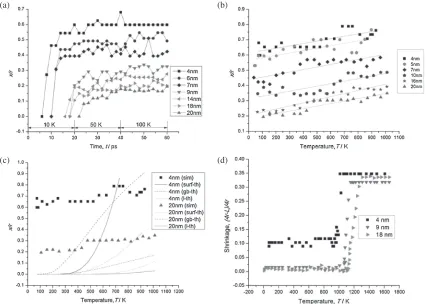
Figure 4 shows average PE values and atomic plots of three 4 nm particles during the heating process. The initial configuration of (100) plane at the center of the particles is shown at plot A with blue and red lines following [001] and [010] directions, respectively. The three NPs were separated by about 0.3 nm with particle 1 rotated in anti-clockwise (a)
(b)
Fig. 2 (a) Average PE values of all atoms in the sintered structure during the heating process of two 4 nm particles. (b) Atomic plots of (111) plane at the initial configuration of the two 4 nm Ag NPs at point A and during the heating process for other plots. Each dot in the atomic plots represents an atom. Blue and red arrows follow the crystallographic directions of
½101and [110], respectively. Black arrow heads point toward regions at which grain boundaries (G.B.), twin boundaries (T.W.), dislocations (D.L.), and surface premelting (S.M.) are located.
H. A. Alarifiet al.
[image:3.595.60.275.64.434.2]direction by 30°. As heating of the NPs was started at point B, the three particles joined each other with a slight clockwise rotation of particle 1 to reduce the interfacial energy with the other two particles. Further heating to point C led to further rotation of particle 1, densification, and formation of a grain boundary at the neck region between particle 1 and particle 3 and a twin boundary between these two particles and particle number 2. The reduction of the surface area and the formation of the twin boundary have relaxed the structure and dropped the average PE values. Further increase in temperature to point D led to diffusion between particle 1 and particle 3, which subsequently merged them into one single grain. At point F, amorphous regions started to appear on highly curved regions of the surface as an indication of surface premelting, which led to shrinkage of the structure as heating continued up to the melting point of the structure at point I. Plots F, G and H showed that the twin boundary remained stable during the surface premelting.
Figure 5 shows average PE values and atomic plots of four 4 nm particles during the heating process. The initial configuration of (100) plane at the center of the particles is shown in plot A with the blue and red arrows following [001] and [010] directions, respectively. The separating distance between the particles was about 0.3 nm. The four NPs joined each other and formed necks between them as heating started at point B. Further heating toward point C increased the
neck radius, which subsequently caused formation of an edge dislocation (D.L.) at particle 3. Densification occurred at point D, at which the dislocation climbed toward the surface of the particle driven by sintering stress or vacancy annihilation. At point E, another dislocation was formed at particle 1 that climbed to the surface of the particle at point F, at which a twin boundary was formed within particle 1 and decreased the slope of the PE curve. The twin boundary extended to particle 3 as the temperature of the structure was increased to point G, which further relaxed the structure and decreased the PE values. Similar to the sintering process of two particles in Fig. 2, the twin boundary was also formed and showed the crystallographic mirror on both sides of it. Melting and subsequent shrinkage of the sintered structure started at point H, at which amorphous regions started to appear on the highly curved regions of the surface. These amorphous regions extended toward the core of the structure to complete the melting process at point I. Similar to the case of sintering of three particles in Fig. 4, the twin boundary remained stable during and prior to the melting process.
Sintering of three and four NPs showed a similar general trend and stages to sintering of two NPs. They started by forming grain boundaries at the neck region followed by neck growth, which was driven by different mechanisms such as mechanical rotation, forming a twin boundary or dislocations. Thefinal stage started at the surface premelting temperature
(a) (b)
(c) (d)
[image:4.595.86.512.71.375.2]and caused the rapid shrinkage of the sintered structure. By comparing sintering process of three and four particles, we were able to clearly see the effect of pore geometry on the densification process. The three particles were densified at about 100 K while densification of four particles occurred at about 775 K. Both were driven by mechanical rotation, forming edge dislocations and twin boundaries within the sintered structure. Densification of two 4 nm Ag particles on Au substrate was confirmed by MD simulation at 523 K, which is within the temperature range of densification obtained here.27) The sintering kinetics obtained here are different than previous sintering theories in two respects.10,11) First, densification was not characterized as the third and last stage of sintering. Instead, it occurred during the second stage, which was characterized by gradual increase of the neck radius to NP radius ratio x/r. Also, the temperature at which densification occurs was strongly dependent on the pore geometry. Second, we have characterized the third stage as liquid state sintering driven by surface premelting of the structure.
4. Conclusions
Sintering behavior of Ag NPs in size range of (4 to 20 nm) was studied via MD simulation based on EAM. Our results showed that sintering of Ag NPs occurred in three main stages and showed higher sintering rates than those predicted by theoretical models of sintering of microparticles. Thefirst stage was neck formation and rapid growth of the neck radius to particle radius ratio (x/r) in temperature regime of (10 to 50 K) for all sizes of NPs. Second stage was characterized by gradual linear increase of the neck radius to particle radius ratio (x/r) as the temperature increased towards the surface premelting temperature of the sintered structure. Edge dislocations and a twin boundary were formed within the sintered structure during this stage. The formation of a twin boundary relaxed the structure and decreased the slope of the PE curve during the heating process. Rapid shrinkage of the sintered structure occurred during the third stage and was initiated at the surface premelting temperature and was driven by further melting of the surface layer toward the (a)
(b)
Fig. 4 (a) Average PE values of all atoms in the sintered structure of three 4 nm particles during the heating process. (b) Atomic plots of (100) plane at the initial configuration of the three 4 nm Ag NPs at point A and during the heating process for other plots. Each dot in the atomic plots represents an atom. Blue and red arrows follow the crystallographic directions of [001] and [010], respectively. Black arrow heads point toward grain boundaries (G.B.), twin boundaries (T.W.), and surface premelting (S.M.) regions.
(a)
(b)
Fig. 5 (a) Average PE values of all atoms in the sintered structure during the heating process of four particles of 4 nm diameter. (b) Atomic plots of (100) plane at the initial configuration of the four 4 nm Ag NPs at point A and during the heating process for other plots. Each dot in the atomic plots represents an atom. Blue and red arrows follow the crystallographic directions of [001] and [010], respectively. Arrow heads toward regions at which dislocations (D.L.), twin boundaries (T.W.), and surface premelting (S.M.) are located.
H. A. Alarifiet al.
[image:5.595.63.280.64.434.2] [image:5.595.318.533.71.437.2]core of the sintered structure. We have also found that pore geometry has a significant effect on the densification rate of the sintered NPs.
Acknowledgment
This work is partially supported by the National Science and Engineering Research Council of Canada (NSERC). H. A. Alarifi acknowledges the sponsorship of King Abdulaziz City for Science and Technology during this work and also acknowledges that the computations were performed at Çankaya University.
REFERENCES
1) A. Hu, J. Y. Guo, H. Alarifi, G. Patane, Y. Zhou, G. Compagnini and C. X. Xu:Appl. Phys. Lett.97(2010) 153117.
2) H. Alarifi, A. Hu, M. Yavuz and Y. Zhou:J. Electron. Mater.40(2011) 13941402.
3) Y. Zhou: Microjoining and Nanojoining, (CRC Press/Woodhead Publishing: Cambridge, U.K., 2008) pp. 250268.
4) Q. Jiang and F. G. Shi: J. Mater. Sci. Technol.14(1998) 171172. 5) S. Arcidiacono, N. R. Bieri, D. Poulikakos and C. P. Grigoropoulos:
Int. J. Multiphas. Flow30(2004) 979994.
6) P. Zeng, S. Zajac, P. C. Clapp and J. A. Rifkin:Mat. Sci. Eng. A252
(1998) 301306.
7) H. Zhu and R. S. Averback:Mat. Sci. Eng. A204(1995) 96100.
8) B. S. Bokstein, H. D. Bröse, L. I. Trusov and T. P. Khvostantseva:
Nanostruct. Mater.6(1995) 873876.
9) J. Rankin and B. W. Sheldon:Mat. Sci. Eng. A204(1995) 4853.
10) R. German:Sintering Theory and Practice, (John Wiley & Sons. Inc,
New York, 1996) p. 79.
11) V. Tikare, M. Braginsky, D. Bouvard and A. Vagnon:Comp. Mater. Sci.48(2010) 317325.
12) M. Atiş, C. Özdoğan and Z. B. Güvenç:Int. J. Mod. Phys. C16(2005) 969990.
13) L. D. Marks:J. Cryst. Growth61(1983) 556566.
14) A. F. Voter: Embedded Atom Method Potentials for Seven FCC metals: Ni, Pd, Pt, Cu, Ag, Au and Al; Los Alamos Unclassified Technical Report LA-UR 933901, (1993).
15) S. M. Foiles, M. I. Baskes and M. S. Daw:Phys. Rev. B33(1986) 79837991.
16) H. Alarifi, M. Atis, C. Ozdogan, A. Hu, M. Yavuz and Y. N. Zhou: J. Phys. Chem. C (under review).
17) Q. Jiang, S. H. Zhang and J. C. Li:Solid State Commun.130(2004) 581584.
18) W. K. Lee, R. L. Eadie, G. C. Weatherly and K. T. Aust:Acta Metall.
26(1978) 18371843.
19) Q. Jiang, X. H. Zhou and M. J. Zhao: J. Chem. Phys. 117(2002) 1026910273.
20) A. P. Chernyshev:Mater. Lett.63(2009) 15251527.
21) F. E. Kruis, K. A. Kusters, S. E. Pratsinis and B. Scarlett:Aerosol Sci. Tech.19(1993) 514526.
22) M. I. Alymov, E. I. Maltina and Y. N. Stepanov:Nanostruct. Mater.4
(1994) 737742.
23) D. R. Askeland and P. P. Phulé: The Science and Engineering of Materials, 5th Ed., (Thomson, Toronto, Canada, 2006) p. 129. 24) R. Kofman, P. Cheyssac, A. Aouaj, Y. Lereah, G. Deutscher, T.
Ben-David, J. M. Penisson and A. Bourret:Surf. Sci.303(1994) 231246.
25) J. Y. Guo, C. X. Xu, A. M. Hu, K. D. Oakes, F. Y. Sheng, Z. L. Shi, J. Dai and Z. L. Jin:J. Phys. Chem. Solids73(2012) 13501357.
26) P. Peng, A. Hu, H. Huang, A. P. Gerlich, B. Zhao and Y. N. Zhou:
J. Mater. Chem.22(2012) 1299713001.