Evaluation of Sensitivity of Remote Field Eddy Current Testing
and Low-Frequency Eddy Current Testing
for Inspecting Grooves of Metal Plate
Jing Wang
1,2,+, Noritaka Yusa
2, Hongliang Pan
1, Toshiyuki Takagi
3and Hidetoshi Hashizume
21School of Mechanical and Power Engineering, East China University of Science and Technology, Shanghai 200237, P. R. China 2Department of Quantum Science and Energy Engineering, Graduate School of Engineering, Tohoku University,
Sendai 980-8579, Japan
3Institute of Fluid Science, Tohoku University, Sendai 980-8577, Japan
We compare remotefield eddy current testing and low-frequency eddy current testing from the viewpoint of sensitivity to back-side grooves in a metal plate. We carry out experiments using three metal plates with different depths of artificial grooves. A U-shape magnetic shield gives rise to a remotefield eddy current as occurs in pipe inspection. The experiments show that the two methods have almost the same sensitivity to back-side grooves if a relatively low frequency and relatively far coil interval are used, which is also validated by three-dimensional
finite-element simulations. We conduct numerical investigations tofind the reason for this condition. [doi:10.2320/matertrans.M2012323]
(Received September 14, 2012; Accepted November 2, 2012; Published December 14, 2012)
Keywords: electromagnetic nondestructive evaluation,finite element simulation, sensitivity, depth of penetration, eddy currents, metal plate
1. Introduction
Remote field eddy current testing (RFECT) has been widely used for inspecting pipe abnormity for many years, because it has almost the same sensitivity to inner and outer
flaws.1) The reason is that it detects the magnetic flux that propagates outside the pipe and contains information both about inner and outer flaws.2) Since eddy currents induced inside a pipe wall significantly attenuate the magnetic flux propagating inside the pipe with the distance from the exciter, the magnetic flux propagating outside the pipe becomes dominant at a region sufficiently away from the exciter. Consequently, just situating a detector away from the exciter makes it possible to detect inner and outerflaws with almost the same sensitivity.
Several studies have attempted to use RFECT to inspect back-side grooves appearing in a plate.39) A problem with the application is how to create a region where the magnetic
flux propagating on the opposite side of the plate, which contains information both about surface-side and back-side grooves, is dominant. To overcome this difficulty, earlier studies have used shields to selectively attenuate the magnetic flux propagating on the surface-side of the plate. That is, the detector and/or exciter need to be surrounded by a metallic object so that the magneticflux propagating on the opposite side of the plate is effectively detected.
Earlier studies have validated the effectiveness of RFECT in inspecting back-side grooves in a plate both in numerical simulations and experiment. However, a shield makes it difficult to handle coils; the shield also makes noise especially when it is made from a magnetic material. From a practical point of view, the presence of a shield is therefore not preferable. Low-frequency eddy current testing (LFECT),
which does not need any magnetic shield, would be more advantageous, if it was comparable to RFECT in detecting back-side grooves of a metal plate. However, no quantitative comparison between RFECT and LFECT has been carried out by inspecting back-side grooves in a plate.
Based on the background above, we aim to compare RFECT and LFECT when inspecting back-side grooves in a plate. We carry out experiments and numerical simulations to
find out the condition under which LFECT has almost the same sensitivity as RFECT. Subsequent numerical inves-tigations reveal the physical nature of the condition.
2. Experimental Verification
Figure 1 illustrates the specimens and the coil used in this study. We used three metal plates made of SM490. They measure 500 mm in length, 300 mm in width and 6 mm in thickness, and contain rectangular grooves with a constant length of 150 mm, width of 10 mm and different depths of 1, 2 and 3 mm. Grooves are positioned over only half of the metal plate in order to measure noise by the other half of the plate. The coil consists of a single exciter and a single detector whose axes are parallel to the surface of the plate. The number of turns of the exciter and detector are 1082 and 2245 respectively. The outer and inner diameters of the exciter are 14 and 9 mm. The detector has the same diameters with the exciter. The lengths of the exciter and detector are 30 and 10 mm respectively. A U-shaped shield was prepared with a thickness of 7 mm, made of the same material as the metal plate, to conduct RFECT inspection. We used an exciting frequency of 20 Hz and a coil interval (Fig. 1) of 85 mm for RFECT inspection on the basis of preliminary simulations. In contrast, we used exciting frequencies of 20 and 220 Hz and coil intervals of 85 and 30 mm for LFECT inspections that did not use the shield in order to evaluate the effects of exciting frequency and coil interval. The lower frequency of 20 Hz was chosen because the depth of +Graduate Student, Tohoku University, East China University of Science
and Technology. Corresponding author, E-mail: jingwang8604@gmail. com
penetration at the frequency becomes almost same with the thickness of the specimen as shown below; the higher frequency of 220 Hz was chosen because it provides sufficient difference in the depth of penetration from 20 Hz for the further discussion as well as the stability of the experimental setup.
Figure 2 shows the experimental setup adopted. It con-sists of a signal generator, a power amplifier, a lock-in amplifier, an X-Y stage, an A/D convertor and a computer. An AC voltage with 1.5 Vp-p was produced by the signal generator and then amplified to 15 Vp-p by the power amplifier to excite the exciter. The signal induced in the detector was measured by the lock-in amplifier and gathered by the computer through the A/D converter. The X-Y stage
fixed the coil and moved the metal plate one-dimensionally with a pitch of 3 mm. Both sides of the specimens were measured to gather signals due to surface-side and back-side grooves.
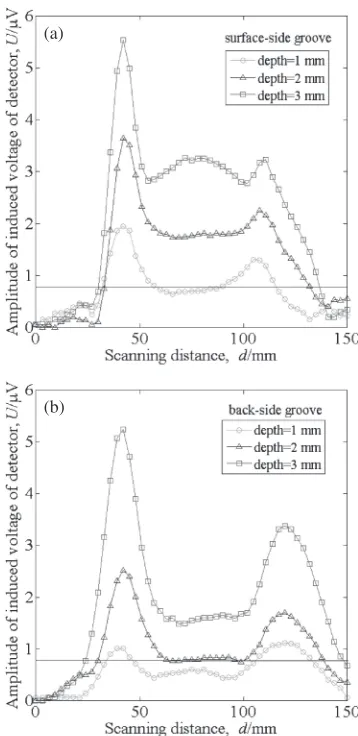
The results of the experiments are shown in Figs. 36. The horizontal lines in the figures indicate the maximum noise amplitude obtained during the coil scans where no groove is situated. The origin of the horizontal axes of the figure is defined as the position of exciter and detector depicted in Fig. 7. Figures 3 and 4 confirm that signals owing to the back-side grooves were clearly obtained regardless of the
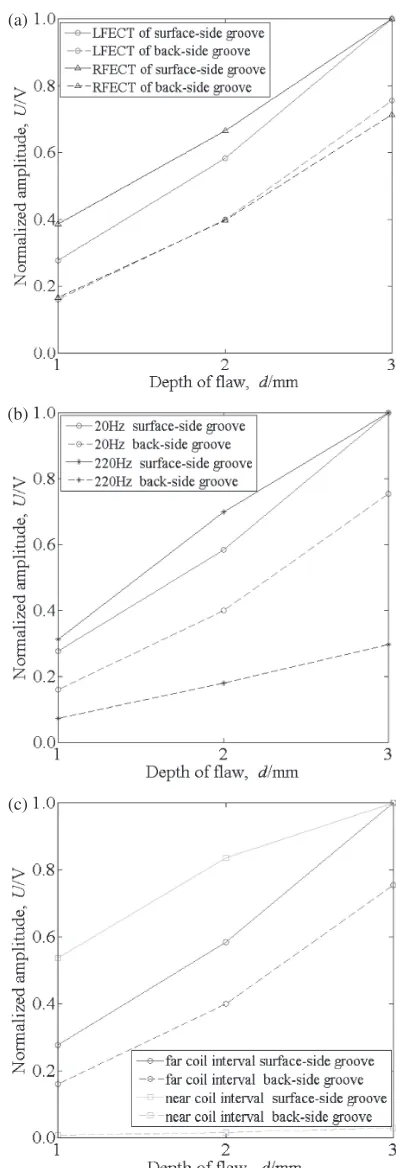
presence of the shield. That is, LFECT has almost the same sensitivity as RFECT to back-side grooves. Figure 5 reveals that using higher-frequency deteriorates the sensitivity of LFECT to backside grooves, which can be well explained by a shallower penetration depth. In contrast, Fig. 6 indicates that shortening the coil interval also leads to a poor sensitivity to back-side grooves.
Fig. 1 Geometry of specimen, coils and shield used in the experiment.
Fig. 2 Experimental apparatus when RFECT inspected the back-side groove of the metal plate.
(a)
(b)
[image:2.595.336.515.269.637.2] [image:2.595.50.290.271.430.2]3. Analysis by Numerical Simulation
Numerical simulations were carried out for further study. The simulations used a commercial finite-element software,
Comsol Multiphysics 4.2a. The configuration of the simu-lations is identical to the one presented in Fig. 1. The conductivity and relative permeability of the metal plate are 3.0e6 S/m and 80 respectively. If we neglect the nonlinearity
(a) (b)
Fig. 4 Scanning signals for inspection of grooves by RFECT with a frequency of 20 Hz and coil interval of 85 mm. (a) Surface-side groove, (b) back-side groove.
(a) (b)
Fig. 5 Scanning signals for inspection of grooves by LFECT with a frequency of 220 Hz and coil interval of 85 mm. (a) Surface-side groove, (b) back-side groove.
(a) (b)
[image:3.595.110.484.70.245.2] [image:3.595.112.482.293.462.2] [image:3.595.112.484.514.686.2]of the magnetic property because of the weak magnetic flux density, then the governing equation is
ðj½·½2¾ÞAþ®1r r A¼J
e ð1Þ
where ½ is the angular frequency, · the conductivity, ¾ the permittivity, A the magnetic vector potential, ® the perme-ability andJethe current density of the exciter. We discretized the plate with hexahedral edge elements and discretized the rest of the domain with tetrahedral edge elements. The total number of elements was 422,858. The size of the computa-tional domain was 800 mm©800 mm©800 mm, and we imposed a boundary condition of n©A=0 on the external boundary of the domain.
Figure 8 presents the results of the simulations to validate the experimental results. To evaluate the sensitivity to back-side grooves more clearly, the figure shows the relationship between the depth of a groove and the maximum signals due to the groove normalized by the maximum signal owing to a surface-side groove with a depth of 3 mm measured under the same condition. The results qualitatively agree with the experimental results, although there is a slight discrepancy mainly because of the presence of noise and unclear electromagnetic characteristics of the materials.
Figure 9 shows the difference the shield makes in the distribution of the Poynting vector on the cross-sectional surface containing the centers of the exciter and the detector. The figure clearly indicates that with the shield there is an energy path coming from the opposite side of the specimen. In contrast, without the shield there is no region where the magneticflux propagating on the opposite side of the plate is dominant. These results confirm that although LFECT and RFECT for the inspection of plate look similar as both of them need to situate the detector away from the exciter, a shield is indeed indispensable for realizing RFECT contrary to what recent publications indicate.6,9)
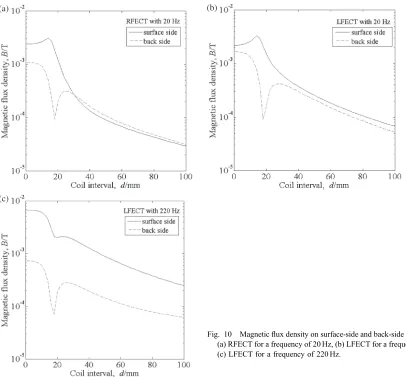
[image:4.595.326.524.66.650.2] [image:4.595.47.294.68.192.2]Figure 10 shows how the magnetic flux density, sqrt{[real(Bx)]2+[imag(Bx)]2+[real(By)]2+[imag(By)]2+ [real(Bz)]2+[imag(Bz)]2}, on the surface-side and back-side of the metal plate changes with the coil distance. Comparing Fig. 10(a) with Fig. 10(b), whose results are obtained with relatively low frequency by RFECT and LFECT respectively, the penetration depth reaches 7.26 mm at 20 Hz. These results can reasonably explain why LFECT has a similar sensitivity for inspecting grooves in a metal plate as RFECT does: The magneticflux density on the surface-side and back-side of the metal plate are similar. Figure 10(b) also shows that the low efficiency for inspecting back-side grooves using LFECT is
probably caused by the larger difference between the metal
flux density on the surface-side and back-side of the metal plate at a relatively near coil interval. Figure 10(c) shows the results for LFECT with a relatively high frequency, where the penetration depth reaches 2.19 mm at 220 Hz. Compared with Fig. 7 Diagram of the scanning process.
(a)
(b)
(c)
(a)
(b)
Fig. 9 Comparison of Poynting vector for a frequency of 20 Hz. (a) RFECT, (b) LFECT.
(a) (b)
[image:5.595.133.461.72.367.2](c)
[image:5.595.98.504.409.786.2]Fig. 10(b), these results demonstrate the negative effect of high frequency on inspecting back-side grooves in a metal plate.
4. Conclusion
This study compared LFECT and RFECT from the viewpoint of inspecting back-side grooves in a metal plate. Experimental and numerical evaluations revealed that LFECT has similar sensitivity to that of RFECT when a relatively low frequency and a relatively far coil interval are used at the same time. Subsequent numerical investigations confirmed that the essential mechanisms of the two methods are different from each other.
The results obtained in this study indicate it is necessary to situate the detector sufficiently far away from the exciter in order to estimate the sensitivity of LFECT to the back-side grooves appearing in a metal plate on the basis of the depth of penetration. The advantage of LFECT over RFECT is that it does not need shields that would work as additional noise source especially when the shield is magnetic and also would make coil handling easier. In contrast, the superiority of RFECT is mainly that higher frequencies are applicable, which enables faster inspection and also makes signals more stable.
Acknowledgments
This work was supported by the Tohoku University Global COE Program®World Center of Education and Research for Trans-disciplinary Flow Dynamics. The authors thank Mr. Toshiaki Ichihara and Mr. Ryoichi Urayama for their technical support during experiments.
REFERENCES
1) H. Fukutomi, T. Takagi and M. Nishikawa:NDT Int.34(2001) 1723. 2) T. R. Schmidt: Mater. Eval.8(1984) 225230.
3) Y. S. Sun, S. Udpa, W. Lord and D. Cooley: Mater. Eval.54(1996) 510 512.
4) Y. S. Sun, L. Udpa, S. Udpa, W. Lord, S. Nath, S. K. Lua and K. H. Ng: Mater. Eval.56(1998) 9497.
5) S. Sharma, Y. Sun and L. Udpa:IEEE Trans. on Magn.35(1999) 1750 1753.
6) N. Kasai, Y. Fujiwara, K. Sekine and T. Sakamoto:NDT Int.41(2008) 525529.
7) N. Kasai, S. Matsuzaki and T. Sakamoto:NDT Int.44(2011) 703707. 8) H. Wang, Q. Luo, X. Wang, G. Tian, L. Xing, P. Wang and Y. Li: Int. J.
Appl. Electromagn. Mech.33(2010) 12611266.
9) T. Yamamoto, T. Takagi and T. Uchimoto: Trans. on JSME Series B75