Constructing Processing Maps for Hot Working of Co-Ni-Cr-Mo Superalloy
Ika Kartika
*1, Yunping Li, Hiroaki Matsumoto and Akihiko Chiba
*2 Institute for Materials Research, Tohoku University, Sendai 980-8577, JapanIn this study, hot forging process of Co-Ni-Cr-Mo superalloy was carried out at temperatures ranging from 950 to 1200C and strain rates
ranging from 0.01 to 30 s1. In order to obtain an optimum forging condition, various processing maps were constructed, such as a power
efficiency map and an instability map, at different strain levels on the basis of a dynamic material model. At a strain of 0.5, temperatures 1050–
1200C and strain rates of 10–30 s1, dynamic recrystallization was observed with power efficiency values ranging from 35 to 44%. Flow
localization due to dynamic strain aging and/or deformation twinning at temperatures 950–1000C and at low strain rates were observed to be in
good agreement with those observed in the instability map. [doi:10.2320/matertrans.M2009103]
(Received March 26, 2009; Accepted June 9, 2009; Published July 23, 2009)
Keywords: cobalt-nickel-chromium-molybdenum superalloy, hot working, processing maps, power efficiency map, instability map, dynamic strain aging, deformation twin, dynamic recrystallization
1. Introduction
In the previous study,1) characteristics of a hot forging
process carried out on Co-Ni-Cr-Mo superalloy at temper-atures 950–1200C and strain rates 0.1–30 s1 have been
investigated and analyzed using a power law equation. The flow curves showed high work-hardening rates at temper-atures 950–1050C and strain rates 0.1–30 s1, which were
considered to result from strong dislocation-solute interac-tions–dynamic strain aging (DSA). The estimated apparent activation energy was significantly different from that of self-diffusion. High activation energy at temperatures lower than 1050C was thought to be associated with DSA and/or
deformation twinning resulting from the medium stacking fault energy of this superalloy. At temperatures 1000– 1200C, hot deformation was mainly accommodated by
dynamic recrystallization; the degree of dynamic recrystal-lization strongly depended on the strain rate.
A processing map is able to be used to identify either a ‘‘stable’’ or an ‘‘unstable’’ hot working process for a specific plastic deformation. Various unstable mechanisms were found to be related to processes such as flow localization, adiabatic shear band formation, and DSA; the final product formed as a result of these processes is likely to have poor mechanical properties. Hence, unstable domains should be avoided in the case of a practical hot working process. Among the safe domains observed in a processing map, the domain associated with dynamic recrystallization (DRX) is favored since dynamic recrystallization enhances intrinsic workability.2)
A power dissipation map was constructed on the basis of a dynamic material model.3,4) This model follows a system
approach and is based on the fundamental principles of continuum mechanics of large plastic flow.4,5)The workpiece
is considered to be a nonlinear dissipater of power, and its constitutive behavior describes the manner in which energy is converted into both thermal and microstructural forms at any instant; this process of conversion of energy is thought to be irreversible.
Following the system terminology,4,6) is found that the
instantaneous power dissipated is assumed to consist of the following two complementary components the G-content that represents an increase in temperature, and the J co-content that represents dissipation caused by metallurgical processes. The factor that divides power betweenJandGis the strain rate sensitivity (m) of flow stress, and the J co-content is expressed as follows:
J¼""m=_ ðmþ1Þ ð1Þ
whereand""_denote flow stress and strain rate respectively. For an ideal linear dissipater, m¼1 andJ¼Jmax¼""=2_ .
The efficiency of power dissipation of a nonlinear dissipater may be expressed as a dimensionless parameter as follows:
¼J=Jmax¼ 2m
mþ1 ð2Þ
A power dissipation map shows the variation in the efficiency of power dissipation with temperature and strain rate; this map also shows various domains in which specific microstructural mechanisms occur. An efficiency map rep-resents power transactions within a continuum, and under-standing the origin of this map and interpreting it in terms of atomistic mechanisms requires a correlation with some of the concepts of irreversible thermodynamics.4)The domains can be interpreted using Raj maps.7) Several dynamic metallurgical processes may contribute to power dissipation during hot working of materials, and these processes have their own characteristic ranges of dissipation efficiencies. Metallurgical processes such as dynamic recovery, dynamic recrystallization, internal fracture (void formation or wedge cracking), dissolution or growth of particles or phase under dynamic conditions, dynamic spheroidization of acicular structures, and deformation-induced phase transformation or precipitation under dynamic conditions may contribute to the changes in the value ofJ.3,4)
The continuum criterion for the occurrence of microstruc-tural instabilities is determined on the basis of Ziegler’s6) principle of maximum rate of entropy production. Instabil-ities in a microstructure will occur during processing if,
ð""_Þ ¼ f@ln½m=ðmþ1Þ=@ln _""g þm<0 ð3Þ
*1Graduate Student, Tohoku University
*2Corresponding author, E-mail: [email protected]
The objective of this study is to construct processing maps on the basis of the dynamic material model in order to obtain the optimum condition under which the Co-Ni-Cr-Mo superalloy is hot forged.
2. Experimental Procedures
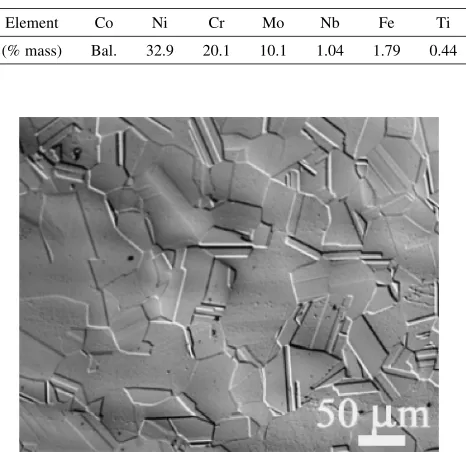
The chemical composition of the superalloy used in this study is shown in Table 1. A superalloy plate was machined into cylindrical specimens with a diameter of 8 mm and a height of 12 mm using an electro discharge machine (EDM). An annealing process was carried out at 1050C for 12 h to
obtain microstructure homogeneity before the hot compres-sion processes. Equiaxed grains with an average grain size of approximately 116mmand a few of annealing twins were obtained after homogenization, as shown in Fig. 1. Our previous XRD observation revealed that only the phase of an fcc structure was observed after the above homogenized process was carried out.1)
Graphite foil sprayed with boron nitride was used as a lubricant to minimize friction between a sample and anvils. Compression tests were performed in vacuum from 950C to
1200C at a temperature interval of 50C using a
computer-aided hot forging simulator (Thermecmaster-Z). A heating rate of 5C/s achieved by induction was controlled between
room temperature and scheduled temperatures. The sample was kept at the scheduled temperature for 300 seconds before it was compressed. As soon as the sample was compressed to the final strain level, a mixed gas of N2(6 MPa pressure) and
He (4 MPa) was used to quench the sample at a cooling rate of approximately 50C/s to room temperature. Strain rates
were chosen as""_¼0:01s1, 0.1 s1, 1 s1, 10 s1and 30 s1.
Microstructures were observed at the center of the sample along a direction perpendicular to the longitudinal direction using an optical microscope. The samples were machined gradually using sandpapers of different grades and finally,
they were electropolished with 10% H2SO4 solution of
methanol at an operating voltage of 6 V before observation. Microstructures formed after the compression tests were observed using a transmission electron microscope (JEOL 2000 EX; acceleration voltage: 200 kV). The samples were cut into thin discs (thickness: approximately 1 mm) by positioning of the EDM at the center of the sample and aligning it parallel to the longitudinal compression axis; these discs were then mechanically polished to a thickness of 0:1mm using a grinding paper (grade 3000). The discs were further ground to a thickness of approximately 40mm
using a dimple machine. Finally, thin foils for TEM observations were obtained by subjecting the discs to ion beam milling (Gatan M691; 3 keV).
The flow stress obtained experimentally under various conditions obtained in the experiment should be corrected by friction and adiabatic heating before the processing maps are constructed. Logarithmic flow stress versus logarithmic strain rate was fitted using a cubic spline function, and the strain rate sensitivity (m) was calculated from this fitting result under different conditions. The efficiency of power dissipation () (eq. (2)) was calculated from themvalues and plotted using Origin software in terms of contour map as a function of both the temperature and strain rate. The flow instability parameter () was calculated using eq. (3) and plotted by a method similar to that used to plot the power efficiency map.
3. Results and Discussion
3.1 Characteristics of deformation behavior in true stress-true strain curves
Typical flow stress curves derived from load displacement data at temperatures 950–1200C and at strain 0.5 are shown
in Figs. 2(a)–(f). Work hardening appeared just after the yielding especially at temperatures 950–1050C at all strain
rates. Values of flow stresses at a strain rate of 0.01 s1and at
temperatures 950–1050C were lower than those at other
temperatures, while the value of yield stress at this strain rate was higher than that at other strain rates (Fig. 2(a)). At temperatures 1100C and 1200C and strain rate 0.01 s1, a
small stress peak followed by steady-state flow behavior at high strain level was observed (Figs. 2(d) and 2(f)).
At temperatures 1100C and 1150C and strain rates 0.01 s1 and 0.1 s1 as well as at temperature 1200C and strain rates 0.01 s1, 0.1 s1and 1 s1, a decrease in the yield followed by moderate work hardening were observed, as shown in Figs. 2(d)–(f). The observed decrease in yield is attributed to the unpinning of the dislocations immobilized by the solute molecules surrounding the dislocations.1)
As shown in Fig. 3, an unusual phenomenon is observed in the superalloy used in this study such that the yield stress at temperatures of 950C and 1000C is independent of the
[image:2.595.54.287.541.770.2]strain rate. In general, the yield stress in the fcc metal strongly depends on the strain rate, especially at elevated temperatures. This unusual phenomenon is thought to probably occur due to DSA.1,8) As presented by C. E. Campbell et al.,9) the occurrence of DSA is the result of solute diffusion into dislocation during plastic deformation within a susceptible temperature range. DSA can reduce the movement of dislocation, and dislocation-solute interactions
Table 1 Chemical composition of Co-Ni-Cr-Mo superalloy used as
sample.1Þ
Element Co Ni Cr Mo Nb Fe Ti
(% mass) Bal. 32.9 20.1 10.1 1.04 1.79 0.44
are usually more effective within a limited range of strain rates.1,10) This implies that the yielding process at
temper-atures of approximately 950–1000C is not controlled by the
thermally activated process of dislocations. The yield stress increases with the strain rate at temperatures of approx-imately 1100–1200C and strain rates 0.01–30 s1.
There-fore, the dislocation glide is strongly dominated by the thermally activated process.
3.1.1 Compensation for friction and adiabatic heating Friction correction was carried out when the flow stress and friction coefficient were substituted into the following equation:1,13)
¼C2P=2½expðCÞ C1 ð4Þ
withC¼2ðr=hÞ
In this equation, is the stress in the absence of friction,
Pis the flow stress of the material under frictional conditions,
r and h are the radius and the height of the sample, respectively, and is the friction coefficient, which is determined from the barreling factor.was calculated using following equation:1,14,16)
¼ ðR=hÞ b
½4=pffiffiffi32b=3pffiffiffi3 ð5Þ withb¼4ðR=RÞ ðh=hÞ
wherebis the barreling factor,Ris the difference between the maximum radiusRmand the top radiusRtof the sample, R is the hypothetical frictionless radius of the sample after it is deformed without friction, h is the final height of the sample, andhis the difference between the initial and final heights of the sample.
The increase in temperature due to adiabatic heating during deformation is generally calculated as1,11–13)follows:
T ¼=c
Z"
0
d" ð6Þ
where is the efficiency of deformation heating, is the density andcis the heat capacity.
Figures 4(a)–(f) show the true stress-true strain curves after compensating for friction and adiabatic heating. The stress peaks vanished at temperatures 950C and 1050C and strain rates 0.01–30 s1. However, all the curves show the work-hardening characteristic for the overall strain range. This result is obtained due to the elimination of the effect of adiabatic temperature rise during deformation by means of compensation.
Fig. 2 True stress-true strain curves of Co-Ni-Cr-Mo superalloy obtained from load displacement data at all strain rates atT(C): (a) 950,
(b) 1000, (c) 1050, (d) 1100, (e) 1150, and (f) 1200.
Fig. 3 Variation in0:2of Co-Ni-Cr-Mo superalloy at variousT(C) as a
[image:3.595.86.512.70.333.2] [image:3.595.69.269.380.563.2]3.2 Interpretation of processing maps 3.2.1 Power dissipation maps
The domains shown in the processing maps are generally identified by correlating the efficiency variation with temper-ature and strain rate. Typical power dissipation maps of the superalloy used in this study are obtained at two different strains, i.e. 0.2 and 0.5, are shown in Figs. 5(a)–(b), respectively. For most of the strain rates, the strain of 0.2 corresponds to the strain close to the stress peak, while the strain of 0.5 corresponds to flow-softening and steady states. The contour in the maps represents the constant efficiencies of power dissipation expressed as percentages. The maps show the following different domains:
(i) Figure 5(a) shows domains at the strain of 0.2: the peak efficiency of approximately 44% is observed at temperatures 1150–1200C and strain rate 0.01 s1and
that of approximately 39% is observed at temperature 1200C and strain rate 30 s1. The contours show that the value of high power efficiency varies from 25 to 44% temperatures 1000–1200C and strain rates 0.01–
0.1 s1, and it varies from 25 to 39% at temperatures
1050–1200C and strain rates 10–30 s1.
(ii) Figure 5(b) shows the variations in the efficiency value in the range of 25–44% at temperatures 1000–1200C
and strain rates 1.8–30 s1 and that in the efficiency
value in the range of 25–35% at temperatures 950– 1200C and strain rates 0.01–0.03 s1. As shown in this
figure, the domains have a peak efficiency of 44% at temperatures 1150–1200C and strain rate 30 s1. The
nature of the maps at the strain of 0.5 (Fig. 5(b)) is not significantly different from that observed at the strain of 0.2 (Fig. 5(a)), although exact values of the power dissipation efficiency at both these strains were slightly different.
According to Raj maps,7) the domains shown in Figs. 5(a) and 5(b) correspond to either superplasticity or DRX. The power dissipation efficiency of superplasticity is generally very high (>60%). This is not observed in the maps
Fig. 4 True stress-true strain curves of Co-Ni-Cr-Mo superalloy at all strain rates atT(C): (a) 950, (b) 1000, (c) 1050, (d) 1100, (e) 1150,
and (f) 1200.
Fig. 5 Power efficiency contour of Co-Ni-Cr-Mo superalloy for": (a) 0.2,
[image:4.595.86.511.70.332.2] [image:4.595.326.528.383.679.2](Fig. 5(b)) since the peak efficiency is only approximately 44%. In view of this observation, the obtained domains do not represent superplastic deformation. The superalloy used in this study seems to undergo dynamic recrystallization. 3.2.2 Flow instability map
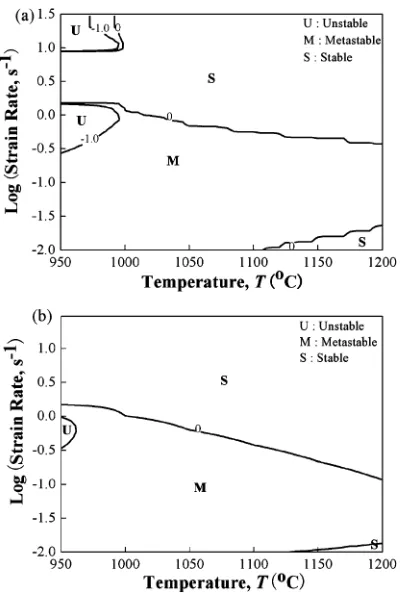
From the flow instability map, the variation in as a function of strain rate and temperature at strains 0.2 and 0.5 is evaluated and shown in Figs. 6(a) and 6(b), respectively. According to Gegel’s flow instability theory, the regime where0in the contour map corresponds to an unstable state (flow instability) in the material causes localized deformation.6) However, in this study, we set the border lines of the value ofon the basis of0< ,1< <0and
<1regimes. When the value ofis greater than zero, we consider that the regime is stable; this implies that materials in this regime are uniformly deformed. If the value oflies between 1 and 0, we define the regime to be a mixture of stable and unstable deformations and designate it as a metastable regime. When the value ofis lower than1, the regime is certainly considered to be one with an unstable deformation. In the unstable regime, material possibly exhibit instabilities in terms of flow localization, adiabatic shear bands, deformation twins and DSA. These instabilities affect the formability of a material while shaping and degrading its mechanical properties.15)
As shown in Figs. 6(a) and 6(b), the instability map of the superalloy used in this study at strains 0.2 and 0.5 showed a wide regime of metastable plastic flow at temperatures 950– 1200C and at strain rates lower than 1 s1. A small part of the unstable regime was observed at both the abovemen-tioned strains levels, temperatures 950–1000C, and strain
rates 0.1–0.3 s1. In addition, a small part of the unstable
regime within the metastable regime was observed at strain 0.2, temperatures 950–1000C, and strain rates 10–30 s1.
The stable regime at strains 0.2 and 0.5 were observed at all temperatures and strain rates higher than 1 s1 (Figs. 6(a)–
(b)).
In order to verify the accuracy of the current processing map, microstructure observation was carried out at strain 0.5; details of this observation will be discussed in the next section. Furthermore, the manifestation of flow instabilities is easily identified by the microscopic examination of deformed materials.4)
3.2.3 Processing maps related to the evolution of micro-structures
Figures 7(a) and 7(b) show the optical microstructures formed at a strain of 0.5, temperatures 950C and 1200C,
and strain rate 0.1 s1. At 950C (Fig. 7(a)), deformation
twins in the deformed microstructures were observed when the power efficiency was relatively low (approximately 5.8%). While at 1200C (Fig. 5(b)), dynamic recrystallized
grains were formed with an average grain size of 24mm
(Fig. 7(b), with an efficiency of approximately 25%). These figures also show that nucleation of DRX depends on both strain and temperature.
Fig. 6 Instability map of Co-Ni-Cr-Mo superalloy show at": (a) 0.2, and
(b) 0.5.
[image:5.595.70.270.69.367.2] [image:5.595.83.515.598.770.2]At a strain of 0.5, temperatures 950–1200C, and strain rate 0.01 s1, the peak of power efficiency was observed to be
approximately 35% (Fig. 5(b)), while in instability map (Fig. 6) both stable and metastable regimes of plasticity were observed. Metastable plasticity was observed at temperatures 950–1100C and strain rate 0.01 s1, whereas stable
plasti-city was observed at temperatures 1150–1200C and strain
rate 0.01 s1. Microstructures shown in Figs. 8(a)–(d) were
observed in order to confirm the validity of the current stability map at temperatures 950C, 1050C, 1150C and
1200C and strain rate 0.01 s1. Deformation twins in the
deformed microstructures (Fig. 8(a)) were observed at 950C
and strain rate 0.01 s1. In addition, at 1050C and strain rate
0.01 s1, numerous new fine dynamic recrystallized grains nucleated and grew along the grain boundaries (Fig. 8(b)). However, in the case of the superalloy used in this study, the microstructures observed at temperatures 950–1050C and
strain rate 0.01 s1were metastable. On the other hand, strain
rate sensitivity was observed to be low at temperatures 950–1000C, suggesting that the effect of DSA still existed
(Fig. 3).
Furthermore, the flow instability map showed that a stable regime was formed at temperatures 1150–1200C and strain
rate 0.01 s1 (Fig. 6). As shown in Figs. 8(c) and 8(d),
deformed microstructures were replaced with dynamic recrystallized grains. These dynamic recrystallized grains were not completely formed at temperatures 1150–1200C
and strain rate 0.01 s1.
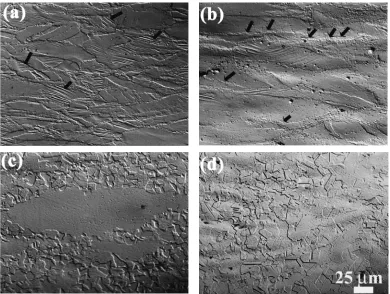
The instability map showed that stable plasticity occurred at temperatures 950–1200C and strain rates 10–30 s1with a strain of 0.5 (Fig. 6(b)). The microstructures shown in
Figs. 9(a)–(f) confirmed the validity of the current stability map; these microstructures were observed at temperatures 950–1200C and strain rate 10 s1. The microstructures
Fig. 8 Optical microstructures of Co-Ni-Cr-Mo superalloy showed at"¼0:5at""_¼0:01s1inT(C): (a) 950, (b) 1050, (c) 1150, and
(d) 1200.
Fig. 9 Optical microstructures of Co-Ni-Cr-Mo superalloy showed at
"¼0:5at""_¼10s1inT(C): (a) 950, (b) 1000, (c) 1050, (d) 1100, (e)
[image:6.595.103.493.71.365.2] [image:6.595.305.548.416.697.2]observed at 950C and strain rate 10 s1 (Fig. 9(a)) were
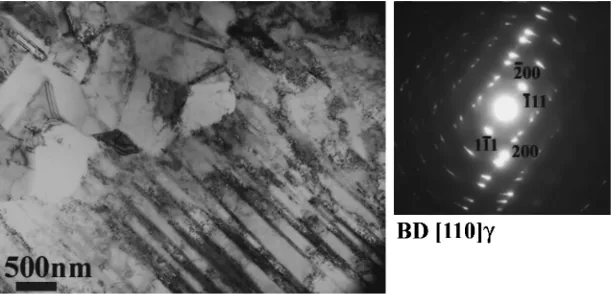
different from those observed in the stable regime repre-sented in the instability map. Deformation twinning in the deformed microstructures based on flow localization was observed at the abovementioned temperature and strain rate. Figure 10 shows the TEM micrograph at 950C and strain
rate 10 s1corresponding to Fig. 9(a). These microstructures
show numerous deformation twins and dense dislocations; recovered microstructures are not observed except for the new grains nucleating along the grain boundaries in the deformed microstructures. At 1000C, numerous new fine
dynamic recrystallized grains were observed along both grain boundaries and deformation twin boundaries (Fig. 9(b)). Furthermore, a low strain rate sensitivity value indicates that DSA and/or deformation twinning still contribute to the deformation processes. These typical microstructures are avoided. Therefore, the regime formed at temperatures 950– 1000C and strain rate 10 s1is not preferred for the current
superalloy. P. V. Sivaprasadet al.2,4)reported that the various
mechanisms in the unstable domain are manifested as flow localization; deformation twinning, adiabatic shear band formation and DSA, which are detrimental to the processing of the material. On the other hand, microstructures observed at temperatures 1050–1200C and strain rate 10 s1showed
that dynamic recrystallized grain were completely formed (Figs. 9(c)–(f)). These temperature ranges are satisfied by the regime in the instability map i.e., stable regime. Therefore, dynamic recrystallized grains are preferable for processing the current superalloy.
4. Conclusion
Hot working characteristics and construction of processing maps at temperatures 950–1200C, wide strain rate ranges
from 0.01 to 30 s1 and at strain 0.5 of Co-Ni-Cr-Mo
superalloy have been studied. Results of this study are summarized as follows:
(1) Negative or almost zero values ofmof the yield stress at temperatures 950–1000C were observed in the
Co-Ni-Cr-Mo superalloy. This characteristic is considered to be associated with the high work hardening rate attributed to the strong dislocation-solute interaction (DSA) combined with deformation twinning during hot deformation.1)
(2) The optimum safe processing regime based on the instability map was observed to be formed at temper-atures 1050–1200C and strain rates 10–30 s1. In the
domain of dynamic recrystallization, the power effi-ciency value varied in the range 35–44%.
(3) The instability map showing the metastable regime at temperatures 950–1000C and strain rates lower than
1 s1 is in good agreement with microstructure
obser-vation, where deformation twins were observed. A low value ofmis thought to be associated with DSA and/or the occurrence of deformation twinning. DSA and deformation twinning were considered to be detrimen-tal to processing.
(4) From the instability map, it was found that the regime formed at temperatures 950–1000C and strain rate
10 s1 were stable at strain 0.5, which was not in good
agreement with the microstructure observation, where deformation twins and partial dynamic recrystallized grains were observed. In addition, the processes of formation of metastable regime and the evolution of a microstructure differed from each other at 1200C and
strain rate 0.1 s1.
Acknowledgment
This research was supported by a Cooperation of Innova-tive Technology and Advanced Research in Evolutional Area from the Ministry of Education, Culture, Sports, Science and Technology of Japan.
REFERENCES
1) I. Kartika, H. Matsumoto and A. Chiba: Metall. Mater. Trans. A40
(2009) 1457–1468.
2) P. V. Sivaprasad, S. Venugopal, Sridhar Venugopal, V. Maduraimuthu, M. Vasudevan, S. L. Mannan, Y. V. R. K. Prasad and R. C. Chaturvedi:
JMPT132(2003) 262–268.
3) Y. V. R. K. Prasad, H. L. Gegel, S. M. Doraivelu, J. C. Malas, J. T.
Morgan, K. A. Lark and D. A. Barker: Metall. Trans. A15A(1984)
1883–92.
4) Y. V. R. K. Prasad and T. Seshacharyulu: Int. Mater. Rev.43(1998)
245–258.
5) H. Ziegler: Progress in Solid Mechanics, 4th ed., (John Wiley and Sons, New York, 1963) pp. 93–113.
[image:7.595.145.453.73.220.2]6) P. E. Wellstead: Introduction to Physical System Modeling, Academic Press, London, 1979.
7) R. Raj: Trans. AIME12(1981) 1089–1097.
8) A. Chiba, X. G. Li and M. S. Kim: Philos. Mag.79(1999) 1533–
1554.
9) C. E. Campbell, W. J. Boettinger and U. R. Kattner: Acta Mater.50
(2002) 775–792.
10) H. J. McQueen and N. D. Ryan: Mater. Sci. Eng.322(2002) 43–63.
11) G. E. Dieter: Mechanical Metallurgy, 2nd ed., (McGraw Hill Book Co., New York, 1976) p. 138.
12) G. E. Dieter: Mechanical Metallurgy, 2nd ed., (McGraw Hill Book Co., New York, 1976) p. 311.
13) H. Monajati, M. Jahazi, S. Yue and A. K. Taheri: Metall. Mater. Trans.
36(2005) 895–905.
14) R. Ebrahimi, A. Najafizadeh and R. Shateri: Proc. 81st Steel Symp. Isphahan Iran (Iranian Institute for Iron and Steel, 2003) pp. 230– 237.
15) S. Venugopal, S. L. Mannan and Y. V. R. K. Prasad: Scr. Mater.28
(1993) 715–720.
16) Y. P. Li, E. Onodera, H. Matsumoto and A. Chiba: Metall. Mater.