Diffusion of Re and Ru in the
0
Phase of Ni Based Alloys
Efendi Mabruri
1;*1,*2, Shingo Sakurai
1;*1, Yoshinori Murata
1,
Toshiyuki Koyama
2and Masahiko Morinaga
11
Department of Materials, Physics and Energy Engineering, Graduate School of Engineering, Nagoya University, Nagoya 464-8603, Japan
2National Institute for Materials Science, Tsukuba 305-0047, Japan
The diffusion of Re and Ru in the0-Ni
3Al phase has been investigated at a range of temperatures 1423–1523 K by using the pseudo-binary
diffusion couples. It was found that the concentration gradient of Re appeared to promote the uphill diffusion of Al, whereas that of Ru did not promote the Al uphill diffusion. The cross interdiffusion coefficients ofDD~Ni
AlReandDD~NiAlRuwere independent of the matrix ordering since they were
comparable qualitatively between those in the0-Ni
3Al and in the-Ni phases. The tracer diffusion coefficients for Re and Ru in Ni3Al were
estimated by extrapolation and the obtained activation energies were consistent with the site preferences of the elements reported in the literature. Further, the results of this work suggest that the diffusion of Ru in Ni3Al is mostly governed by the diffusion in Ni sublattice and the
diffusion of Re is mainly controlled by the formation of anti-site defects in the Ni sublattice with negligible contribution of the anti-site bridge mechanism. [doi:10.2320/matertrans.MRA2007632]
(Received December 27, 2007; Accepted March 3, 2008; Published May 1, 2008)
Keywords: rhenium, ruthenium, diffusion,0phase, nickel three aluminum, superalloys
1. Introduction
The development of the next generation single crystal Ni based superalloys pays an intensive attention to the roles of Re and Ru as the potent alloying elements. The combination of these two elements has been found to enhance high temperature capability of the superalloys.1–5) Providing mobility data for these elements in nickel based alloys is an important issue since it is indeed required in designing the superalloys with respect to high temperature processes such as the precipitation and growth of the0, creep, rafting, etc. The diffusion of these elements in the phase of binary and ternary nickel based alloys have been documented in literature.6–12) However, to the author’s knowledge there is no report concerning on the diffusion of these elements in the
0phase. The0phase has an order structure of L1
2 type in which Ni atoms are located at the face center site while Al atoms are at cubic corner site. In the stoichiometric Ni3Al, a Ni atom is surrounded by the nearest neighbors 8 Ni and 4 Al atoms, while an Al atom is surrounded only by 12 nearest neighbor Ni atoms. Due to the order structure, the diffusion of atoms occupying the Al site is expected to be slower than the atoms occupying the Ni site. Thus, the diffusion of solutes in the0 depends strongly on their occupation behaviors in the Ni3Al lattice.13,14)
The present paper presents the diffusion of Re and Ru in the Ni3Al within a range of temperatures 1423–1523 K. The extrapolated tracer diffusion coefficients in Ni3Al are estimated and the activation energies are correlated with the existing data of the elements from a point of view of the site preferences. In addition, some of the cross interdiffusion coefficients in the systems of Ni3Al-Re and Ni3Al-Ru are also evaluated qualitatively from the redistribution profile of Al which is initially a constant.
2. Experimental Procedure
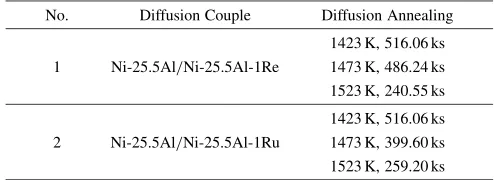
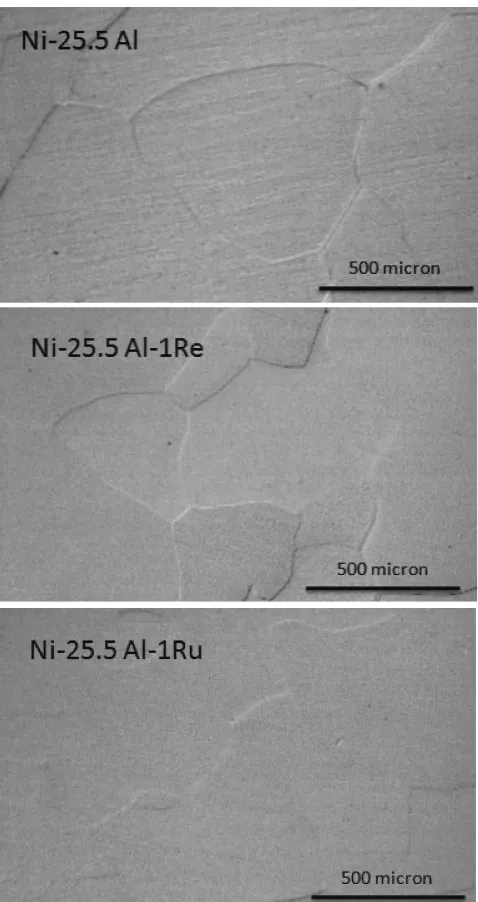
[image:1.595.302.549.695.785.2]The experiments used the pseudo-binary diffusion couples with a constant Al concentration. Due to the limited solubility of Re and Ru in the Ni3Al (about 2 mol% for Re at 1313 K15) and about 4 mol% for Ru at 1373 K16)) dilute concentration of these elements was used in the alloys for the diffusion couples. The composition of the diffusion couples in mol% after homogenization and the heat treatment condition used in this study are presented in Table 1. The aluminum concentration of the alloys shown in the table deviates slightly from stoichiometric composition of Ni3Al and this may be due to the melting condition. Thus, these alloys can be considered to be the Al-rich Ni3Al. The button ingots of the alloys were prepared by arc melting in high purity argon gas atmosphere. The ingots were annealed at 1523 to promote homogenization and grain growth. Sufficient large grain sizes were obtained for the three alloys as shown in Fig. 1. Then, the ingots were cut into plate-shape and ground flat and parallel. The plates were polished with a 0.25mmfinish of diamond slurry and cleaned by acetone in an ultrasonic cleaner. The diffusion couples were assembled with alumina fibers of several micrometers in diameter placed between the polished surfaces of the plates as the inert marker of initial interface. The diffusion couples were then clamped with molybdenum holders. Before the arrangement, the surfaces
Table 1 Composition (mol%) of the diffusion couples and condition of diffusion annealing.
No. Diffusion Couple Diffusion Annealing
1423 K, 516.06 ks 1 Ni-25.5Al/Ni-25.5Al-1Re 1473 K, 486.24 ks 1523 K, 240.55 ks
1423 K, 516.06 ks 2 Ni-25.5Al/Ni-25.5Al-1Ru 1473 K, 399.60 ks 1523 K, 259.20 ks
*1Graduate Student, Nagoya University
*2Corresponding author, E-mail: [email protected]
of the holders were coated by 0.3mmin diameter alumina powders to prevent direct contact with the alloys. The diffusion couples were sealed in quartz ampoules under an argon atmosphere and then annealed at the given temper-atures for the given times presented in Table 1. After diffusion annealing the ampoules were quenched in water by breaking them. The diffusion couples were then sectioned perpendicular to the diffusion interface and polished to a 0.3mm alumina-powders finish and cleaned by acetone in an ultrasonic cleaner. The redistribution profiles of the elements along the diffusion zone were measured by SEM/ EDX with the position of the inert marker fixed as origin of the distance.
3. Results and Discussion
Figure 2(a) and (b) presents the typical redistribution profiles for Re and Ru in their respective diffusion couples
after annealing at 1523 K for 240.55 ks and 259.2 ks, respectively. The full line is the fitting profile representing the measured profiles by the error-function type equation as follows:17)
CiðxÞ ¼Ci þ Cþ
i C
i
2 ½1þerfðfxÞ; ð1Þ
where C
i and C
þ
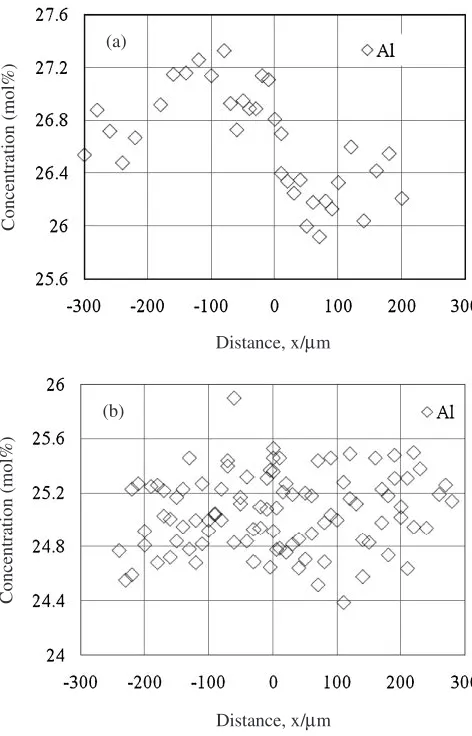
i are the terminal concentrations of element i at the distance x of 1 and þ1, respectively and fxis the polynomial function uponx. The examples for redistribution profiles of Al which has an initially constant concentration in the couples are shown in Fig. 3(a) and (b) in the Re-containing and Ru-containing diffusion couples, respectively, after annealing at 1523 K. It is observed from this figure that the Al redistribution profile shows uphill diffusion in the presence of the Re concentration gradient (Fig. 3(a)) and it stays roughly constant along the diffusion zone in the presence of the Ru concentration gradient (Fig. 3(b)). It indicates that Re in Ni3Al changes the chem-ical potential of Al to drive the Al diffusion but Ru does not. The Re addition into Ni3Al is expected to increase the activity of Al considering that the diffusion of Al originated from the area of higher content of Re. Further, as the uphill diffusion is attributable to the cross interdifffusion coeffi-Fig. 1 Microstructure of the alloys for diffusion couples after
homoge-nization at 1523 K.
Concentration (mol%)
Distance, x/µm (b)
Concentration (mol%)
Distance, x/µm (a)
[image:2.595.49.288.70.521.2] [image:2.595.310.546.70.436.2]cients, the cross terms of DD~Ni
AlRe and DD~ Ni
AlRu which represent the influence of Re and Ru concentration gradients, respec-tively, on the Al fluxes can be deduced qualitatively from the redistribution profile of Al. The results are displayed in Table 2 in the form of the ratio of cross to major coefficients in comparison with those for the phase of the respective system reported by Mabruri et al.9) and Hattori et al.10) It is shown that both DD~Ni
AlRe and DD~NiAlRu are qualitatively consistent between those in theand0phases indicating that these coefficients are independent of the matrix ordering.
Based on the fitted redistribution profiles expressed by eq. (1) the interdiffusion coefficients for Re and Ru at the range of temperatures 1423–1523 K are calculated by Sauer and Freise method18)using the following equation:
~ D
D¼ ð1=2tÞðdx=dYiÞ ð1YiÞ
Zx
1
YidxþYi
Zþ1
x
ð1YiÞdx
;
ð2Þ
where Yi is the normalized concentration defined by Yi¼ ðCiCiÞ=ðC
þ
i C
i Þ, t and x are the time and the distance, respectively. The estimated interdiffusion coeffi-cients of Re and Ru are presented in Fig. 4. Both coefficoeffi-cients appear to vary slightly with the respective element concen-tration. However, they all can be represented by linear lines. Further, as the systems concerned here are assumed as the pseudo-binary solution, the tracer diffusion coefficient for both Re and Ru in Ni3Al can be deduced from these lines by considering the Darken-Manning equation19,20)as follows:
~ D
D¼ ðNADBþNBDAÞS; ð3Þ
whereDD~,DD~
AandDD~Bare the interdiffusion coefficient, the A-tracer diffusion coefficient and the B-A-tracer diffusion coef-ficient, respectively. NAandNB are the atomic fraction for element A and B, respectively, is the thermodynamic factor andSis the vacancy wind factor. By taking theNBis zero for the very dilute solution, bothandSwill be equal to unity. At this point (NB¼0) the interdiffusion coefficientDD~ is expected to be identical with the tracer diffusion coefficient
~ D D
B. Then, the extrapolated value ofDD~ to the zero concen-tration of B can be considered asDD~
B.
Concentration (mol%)
Distance, x/µm
Concentration (mol%)
Distance, x/µm (a)
(b)
[image:3.595.50.286.70.438.2]Fig. 3 Typical redistribution profiles of Al in (a) Re- and (b) Ru-containing diffusion couples after diffusion annealing at 1523 K for 240.55 ks and for 259.2 ks, respectively.
Table 2 The ratio of cross to major interdiffusion coefficients inand0 phases of both Ni-Al-Re and Ni-Al-Ru systems.
Phase DD~Ni
AlRe=DD~NiAlAl DD~NiAlRu=DD~NiAlAl Reference
0 Positive 0 This work
0.2 0.05
Mabruriet al.9Þ Hattoriet al.10Þ
Re interdiffusion coefficient (m
2s -1)
Ru interdiffusion coefficient (m
2s -1)
1473 K 1523 K
1423 K
Re concentration, CRe/mol% (a)
1473 K 1523 K
1423 K
Ru concentration, CRu/mol%
(b)
Fig. 4 The interdiffusion coefficients of (a) Re and (b) Ru in Ni3Al as a
[image:3.595.307.548.73.426.2] [image:3.595.45.290.531.585.2]By considering that the term A is for Ni and B is for Re or Ru, the extrapolated tracer diffusion coefficients for Re and Ru in 0-Ni
3Al (DD~ð 0Þ Re andDD~
ð0Þ
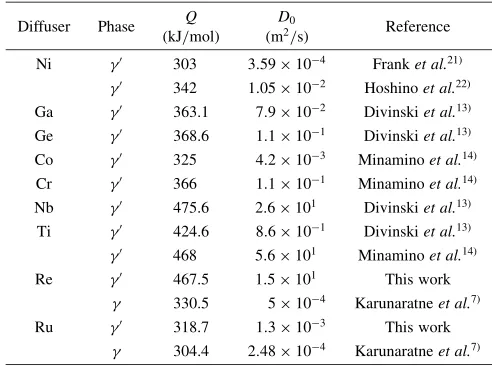
Ru , respectively) are obtained from Fig. 4 and they are presented in Fig. 5 as a function of the reciprocal absolute temperatures. It is seen from Fig. 5 that the diffusion coefficient of Re in the 0 phase is lower than that of Ru along the range of experimental temperatures and this is consistent with their difference in the phase.6,7) The activation energy and the frequency factor for the tracer diffusion of Re and Ru obtained from Arrhenius plot in Fig. 5 is shown in Table 3. The Arrhenius parameters for diffusion of Re and Ru in the phase and of other elements in the0 phase reported in the literature are also displayed in Table 3 for comparison. It can be seen from the table that the activation energy for diffusion of Re in the 0 phase is significantly larger than that in thephase. Also, this energy is comparable with those for Nb and Ti in the 0 phase as shown in Table 3, and hence it is likely that Re diffuses in Ni3Al in a similar mechanism with that of the two latter elements. As for Ru, the activation energy shows a com-parable value in both phases, indicating that Ru diffuses in
the0phase by a similar mechanism with that in thephase,
i.e. through the Ni vacancies in the Ni sublattice. The migration of Ru atoms from Al site to Ni site or vice versa seems to be negligible and do not contribute to the total diffusion activation energy. This behavior is similar to the cases of Ni and Co as the diffusion activation energies for the three elements (Ni, Co, Ru) in the 0 phase are com-parable as listed in Table 3.
It is well accepted that the diffusion of elements in Ni3Al depends strongly on the elements site preferences.13,14)The elements occupying Ni site diffuse via Ni vacancies, whereas the elements occupying Al site diffuse as anti-site defects in Ni sublattice. The elements occupying both sites may diffuse by the mechanism similar to that for Ni substituting elements. The ordinary diffusion activation energy for Ru resulted in this study reflects that Ru occupies for Ni site preferentially or for both sites. On the other hand, the large diffusion activation energy for Re in the 0 phase reflects that Re occupies Al site preferentially. The site preference of the elements of 3d, 4d and 5d in Ni3Al has been reported to depend on the composition and on the temperature.23,24)In Al-rich Ni3Al alloys, as this kind of alloy is used in this work, Ru shows a preference for Ni site at low temperature, but with increasing temperature the fraction of Ru in the Ni sublattice decreases to such extent that their site preference is reversed.24)At a range of temperatures applied in this work, about 55–65%24,25)fraction of Ru is located at Al site. Due to the vacancy concentration in the Ni site is five times larger than that in Al site,26)the diffusion of Ru in Ni3Al is mostly governed by the diffusion in Ni sublattice. This gives the activation energy for diffusion of Ru in Ni3Al appears to be comparable with that for Ni and the Ni substituting element Co.
On the other hand, Re shows consistently a predominant preference for the Al site at all temperatures.24)At a range of temperatures concerned in this work, about 80%27)or 98%24) fraction of Re atoms are located at the Al site. Considering that the disordering activation energy of Ni3Al alloyed with the elements Nb, V, Ti and W which substitute strongly for the Al site, is much larger than the ordering activation energy,28)it is hard to be expected that the atoms occupying Al site diffuse accompanied by this kind of disordering. If this is true for Re, then the diffusion of Re atoms in the Ni3Al will be controlled by the formation of the anti-site atoms in the Ni sublattice. The anti-site atoms in Ni sublattice are the atoms of Al or Al-substituting elements available in Ni sublattice as an impurity.
Furthermore, it is shown also in Table 3 that activation energies for Re, Ti and Nb are much larger with respect to that for Ge and Ga even though all these elements occupy the Al site predominantly. This indicates that the contribution of the so called anti-site bridge (ASB) mechanism to the diffusion of anti-site atoms of Re, Ti, Nb seems to be negligible. It has been proposed that the ASB mechanism enhances the diffusion of Al, Ge and Ga in Ni3Al by enhancing the number of probable sites which can be reached by the anti-site atoms.13) The ASB mechanism enables the anti site atoms in Ni sites and the nearest neighbor atoms in Al sites exchange their host lattices while maintaining the order state. Since the effective activation enthalpy for the
Extrapolated tracer diffusion coefficient (m
2s -1)
Reciprocal temperature, 1/T/K-1
[image:4.595.52.290.78.241.2]Fig. 5 Temperature dependence of the extrapolated tracer diffusion coefficients for Re and Ru in Ni3Al.
Table 3 The Arrhenius parameters for the diffusion of the elements in
and0phases.
Diffuser Phase Q (kJ/mol)
D0
(m2/s) Reference
Ni 0 303 3:59104 Franket al.21Þ
0 342 1:05102 Hoshinoet al.22Þ Ga 0 363.1 7:9102 Divinskiet al.13Þ Ge 0 368.6 1:1101 Divinskiet al.13Þ Co 0 325 4:2103 Minaminoet al.14Þ Cr 0 366 1:1101 Minaminoet al.14Þ Nb 0 475.6 2:6101 Divinskiet al.13Þ
Ti 0 424.6 8:6101 Divinskiet al.13Þ
0 468 5:6101 Minaminoet al.14Þ
Re 0 467.5 1:5101 This work
330.5 5104 Karunaratneet al.7Þ
Ru 0 318.7 1:3103 This work
[image:4.595.44.290.325.508.2]ASB jumps is of the order of the corresponding energies for diffusion by the Ni sublattice mechanism,13) so that the activation energies for diffusion of Ge and Ga are comparable with that for Ni diffusion. In cases of Re, Ti and Nb the formation enthalpy of their anti-site atoms is expected to be larger than that of Al anti-site atoms causing the probability of the ASB jumps is decreased. Hence, the diffusion of Re, Ti and Nb is mainly determined by diffusion of the anti-site atoms in Ni sublattice. As a consequence, the activation energy for diffusion of Re, Ti and Nb is increased by the formation energy for the anti-site atoms in Ni sublattice.
4. Conclusion
The diffusion of Re and Ru in the0-Ni3Al phase has been investigated at a range of temperatures 1423–1523 K by using the pseudo-binary diffusion couples. It was found that Al uphill diffusion was observed in the presence of Re concentration gradient, whereas it was not observed in the presence of Ru concentration gradient. The cross interdiffu-sion coefficients ofDD~Ni
AlRe andDD~NiAlRuappeared not to depend on the matrix ordering since they were qualitatively comparable between those in the 0-Ni
3Al and in the -Ni phases. The tracer diffusion coefficients for Re and Ru in Ni3Al were estimated by extrapolation and the obtained activation energies were consistent with the site preferences of the elements reported in the literature. The results of this work suggest that the diffusion of Ru in Ni3Al is mostly governed by the diffusion in Ni sublattice and the diffusion of Re is mainly controlled by the formation of anti-site defects in the Ni sublattice with negligible contribution of the anti-site bridge mechanism. The tracer diffusion coefficients of Re and Ru in the 0-Ni
3Al can be described by the following relationships:
~ D
DðRe0Þ ¼1:5101expð467;463=RTÞ
~ D Dð0Þ
Ru ¼1:310 3
expð318;726=RTÞ
Acknowledgements
This work was supported in part by Grant-in-Aid for Scientific Research of Japan Society for the Promotion of Science (JSPS), Japan.
REFERENCES
1) P. Caron: Superalloys 2000 (TMS, Warrendale, PA) pp. 737–746. 2) Y. Koizumi, T. Kobayashi, T. Yokokawa, Z. Jianxin, M. Osawa, H.
Harada, Y. Aoki and M. Arai: Superalloys 2004 (TMS, Warrendale, PA) pp. 35–43.
3) F. Pyczak, B. Devrient, F. C. Neune and H. Mughrabi: Acta Mater.53
(2005) 3879–3891.
4) S. Walston, A. Cetel, R. Mackay, K. Ohara, D. Duhl and R. Dreshfield: Superalloys 2004 (TMS, Warrendale, PA) pp. 15–24.
5) L. J. Rowland, Q. Feng and T. M. Pollock: Superalloys 2004 (TMS, Warrendale, PA) pp. 697–706.
6) M. S. A. Karunaratne, P. Carter and R. C. Reed: Mater. Sci. and Eng.
A281(2000) 229–233.
7) M. S. A. Karunaratne and R. C. Reed: Acta Mater.51(2003) 2905– 2919.
8) M. Hattori, N. Goto, Y. Murata, T. Koyama and M. Morinaga: Mater. Trans.46(2) (2005) 163–166.
9) E. Mabruri, M. Hattori, K. Hasuike, T. Kunieda, Y. Murata and M. Morinaga: Mater. Trans.47(5) (2006) 1408–1411.
10) M. Hattori, N. Goto, Y. Murata, T. Koyama and M. Morinaga: Mater. Trans.47(2) (2006) 331–334.
11) E. Mabruri, S. Sakurai, Y. Murata, T. Koyama and M. Morinaga: Mater. Trans.48(10) (2007) 2718–2723.
12) E. Mabruri, S. Sakurai, Y. Murata, T. Koyama and M. Morinaga: Mater. Trans.49(2008) 792–799.
13) S. V. Divinski, ST. Frank, U. Sodervall and CHR. Herzig: Acta Mater.
46(2003) 4369–4380.
14) Y. Minamino, S. B. Jung, T. Yamane and K. Hirao: Metall. Trans. A23
(1992) 2783.
15) S. Miyazaki, Y. Murata and M. Morinaga: Tetsu-To-Hagane80(2) (1994) 161–165.
16) B. Tyron and T. M. Pollock: Mater. Sci. Eng. A430(2006) 266–276. 17) T. Ikeda, A. Almazouzi, H. Numakura, M. Koiwa, W. Sprengel and H.
Nakajima: Acta Mater.46(15) (1998) 5369–5376. 18) F. Sauer and V. Freise: Z. Elektrochem.66(1962) 353–363. 19) L. S. Darken: Trans. Am. Inst. Min. Eng.175(1948) 184. 20) G. S. Manning: Acta Metall.15(1967) 817–826.
21) St. Frank, U. Sodervall and Ch. Herzig: Phys. Stat. Solid. B191(1995) 45–55.
22) K. Hoshino, S. J. Rothman and K. S. Averback: Acta Metall.36(1988) 1271–1279.
23) A. V. Ruban and H. L. Skiver: Phys. Rev. B55(1997) 856–873. 24) C. Jiang and B. Gleeson: Scripta Mater.55(2006) 433–436. 25) A. P. Ofori, C. J. Rossouw and C. J. Humphreys: Acta Mater.53(2005)
97–110.
26) M. Shimotomai, T. M. Wang and M. Doyama: J. Nucl. Mater.116
(1983) 347–348.
27) S. Miyazaki, Y. Murata and M. Morinaga: Tetsu to Hagane80(2) (1994) 73–77.