The Effect Of Probability And
Uncertainty Models On Hedge Fund
Performance Analysis
John Muteba Mwamba, University of Johannesburg, South AfricaABSTRACT
This paper implements two types of framework to investigate the outperformance, selectivity, and market timing skills in hedge funds: uncertainty and probability. Using the uncertainty framework, the paper develops an uncertain fuzzy credibility regression model in the form of a linear and quadratic CAPM in order to estimate these performance skills. Using the probability framework the paper implements frequentist and Bayesian CAPMs (linear and quadratic) to estimate the same performance skills. We consider a data set of monthly investment style indices published by Hedge Fund Research group. The data set extends from January 1995 to June 2010. We divide this sample period into four overlapping sub-sample periods that contain different market trends. Using the probability framework, our results show that bounded rationality triggers inefficiencies in the market that fund managers can utilise to outperform the market. This market outperformance is due to selectivity and market timing skill during periods of economic recovery only. We admit that these results contradict the rational expectations model. However, with the uncertainty framework this effect disappears on behalf of the rational expectations model and the efficient market hypothesis. This disappearance may be a result of the increased amount of high frequency trading witnessed recently that has made market inefficiencies, which are the main source of hedge fund performance, rarer.
Keywords: Hedge Fund Performance Analysis; Probability and Uncertainty Models
1. INTRODUCTION
his paper reports on an empirical investigation into the decision-making of investment styles employed by hedge fund managers. The study is based on data recorded over a period of 15 years. The key finding of the study is the demonstration of the difference between decision-making under risk (where probability models such as the frequentist and Bayesian models are used) and decision-making under uncertainty (where fuzzy credibility theory is relevant). Probability models are based on the assumption of normality and precise probability distributions, whereas fuzzy credibility model allows for a higher degree of ambiguity. The study shows that, in a probability framework, the success of a fund manager depends on:
Selectivity skill
Market timing skill (during recovery period),
This finding contradicts the rational expectations model (and the EMH). When the fuzzy credibility (uncertainty) framework is used, this effect disappears. The paper makes a distinction between probability and uncertainty in order to explain the discrepancy between the two predictions in the hedge fund universe.
During the past decades hedge funds have become central to the global financial system, providing loans, liquidity, insurance, and other important services that used to be the exclusive domain of banks (Lo, 2008). There is a growing concern that the hedge fund industry is not adequately regulated. The empirical results obtained in this paper may contribute in this regard.
Hedge fund managers have enjoyed flexibility and favourable market conditions that have enabled them to achieve better performance than the traditional markets (Fung & Hsieh, 1997) due to the general upward market trend. Given lower correlation with the equity markets, studies on hedge fund performance carried out during generally upward market trends have led to contradictory conclusions.
Using only one period framework for their study, Brown et al. (1999) and Kosowski, Naik, and Teo (2007) find hardly any evidence of the existence of differential managers’ skills. On the other hand, using a two-period framework analysis Agarwal and Naik (2000) and Hwang and Salmon (2002) find evidence of managers’ skills in hedge fund performance. Furthermore, using two periods as well as multi-periods framework analyses, Capocci and Hubner (2004) argue that managers’ skills can be found among average performers.
Moreover, Ennis and Sebastian (2003) show that, in general, fund managers did not provide protection of their clients’ investment capital after the stock market crisis of March 2000; rather, their better performance was mostly due to the presence of good market timing skills of their managers during the US stock market bubble that preceded it.
These arguments suggest that hedge fund performance analysis depends solely on the time window under consideration. This paper differs from the abovementioned works in the sense that it assumes non-linearity and asymmetry in performance measures and applies robust probability (Bayesian theory) and uncertainty (fuzzy credibility theory) techniques to investigate the persistence of hedge fund performance. These approaches, to the best of our knowledge, are new to the hedge fund universe.
In addition, our performance analysis is carried out over four overlapping sub-sample periods representing different economic cycles during which persistence in performance is assessed in order to identify the style that outperforms the market in bull and especially bear markets. We use only the post-1994 sample periods in order to deal with survivorship bias (Capocci & Hubner, 2004). During our whole sample period of January 1995 to June 2010, the global stock market experienced different economic cycles, including the 1995 financial crisis in Japan, the 1997 financial crisis in Asia, the Dotcom bubble in 2000, the 1998 Russian financial crisis, and the 2008-2009 sub-prime crisis. Hence our performance analysis is not affected in any way by the time window periods that have affected the previous research mentioned above.
This paper uses the Jensen (1968) and Treynor and Mazuy (1966) performance measures only in order to separate managers’ skill into outperformance, selectivity, and market timing skills. We use probability (frequentist and Bayesian) and uncertainty (fuzzy credibility theory) methods to generate the Jensen (1968) and the Treynor and Mazuy (1966) coefficients. Our performance persistence analysis is carried out in a two-period framework using a contingency table, chi-square, and regression analysis simultaneously.
This paper contributes to the growing literature on persistence in performance of hedge funds in two ways. Firstly, it employs a robust probability method; i.e., the Bayesian theory, to obtain managers’ skills (outperformance, selectivity, and market timing skills) and uses three different techniques (contingency table, chi-square, and regression analysis) simultaneously in order to check the consistency of the performance. These probability results show that there is strong evidence of outperformance, selectivity, and market timing skills in hedge fund managers. Secondly, the paper employs a robust uncertainty method known as fuzzy credibility theory (Liu, 2007) in order to generate the Jensen alphas, the Treynor and Mazuy (1966)’s selectivity and market timing skills. The results of the uncertainty fuzzy method show that there is no evidence of outperformance skill in hedge fund managers; however, selectivity and market timing skills can be found in these managers.
The rest of the paper is structured as follows: Section 2 presents and discusses the estimation of coefficients of managerial skills (Jensen alpha, selectivity, and market timing) using both linear and non-linear CAPMs. Section 3 discusses the two-period performance analysis using three techniques; i.e., contingency table, chi-square, and cross-sectional regression. Empirical results are presented in Section 4, while Section 5 discusses the results and concludes the paper.
2. JENSEN ALPHA, SELECTIVITY, AND MARKET TIMING SKILLS ESTIMATION 2.1 The Frequentist Model
The Jensen alpha (1968) is simple and is one of the most widely used performance measures in practice. It calculates the performance of a fund manager by measuring the deviation of his portfolio’s return from the securities market line: it f mt i J it f it
r
r
r
r
(
)
(1)where
r
it,
r
f,
r
mt,
i, represent the return on investment stylei
used by the fund manager, the risk free rate, the market returns at timet
, and the systematic risk of the main style respectively.The intercept term in Equation (1) is referred to as Jensen alpha and measures the skill of the fund manager. This model is based on the assumption that markets are efficient in the famous Fama (1984) efficient market hypothesis context. In this context all market participants have the same beliefs about asset prices, which presumably suggest no mispricing in the market.
A skilled manager attempts to exploit any mispricing that occurs in the market, thereby generating a certain value of alpha statistically different from zero. Where the value of alpha is positive (negative) it is a signal that the investment style whose rate of returns is
r
it is underpriced (overpriced) and the fund manager would gain from the style if s/he takes a long (short) position.The Treynor and Mazuy measure (1966) is a performance measure that separates managerial skill into two: selectivity and market timing skills. A manager with forecasting ability gains more than the market does when the market return is forecast to rise, and loses less than the market does when the market is forecast to fall. Therefore, his portfolio returns will be a concave function of the market returns:
it f mt i f mt i i f it
r
r
r
r
r
r
1(
)
2(
)
2
(2)Treynor and Mazuy (1966) showed how the significance of
2i provides evidence of the over-performance of a portfolio. Admati et al (1986) suggested that
i in Equation (2) can be interpreted as the selectivity component of performance and theE
[
2i(
r
mt
r
f)
2]
interpreted as the timing component of performance.This paper employs three robust econometric models to estimate the Jensen alpha, selectivity, and market timing coefficients from Equations 1 and 2 respectively. The first two (frequentist and Bayesian) are referred to as probability models, while the last one (fuzzy credibility theory) is referred to as an uncertainty model. Our aim in using these three different econometric models is to assess whether the estimated coefficients will lead to the rejection of the null hypothesis, which would signify that fund managers do not have enough skills (selectivity and market timing) to outperform the market consistently.
2.2 Credibility Theory and Fuzzy Credibility Regression Model
A fuzzy random variable is a function from a measurable space to the set of fuzzy variables. Let
be a non-empty set of events, andP
(
)
2
a power set on
. LetA
be an event from
; credibility measure theory assigns to each eventA
a numberCr
A
which indicates the credibility thatA
2
will occur. Following Liu (2004, 2007), the following axioms apply:Axiom 1:
Cr
1
Axiom 2:
Cr
is increasing; i.e., for allA
B
,
Cr
A
Cr
B
Axiom 3:Cr
is self-dual; i.e.,Cr
A
Cr
A
C
1
,
A
2
Axiom 4:
Cr
0
.
5
,
for
any
A
ithat
has
Cr
A
i
0
.
5
i i i iSup
Cr
A
A
Axiom 5: Let
kbe a non-empty set of events on whichCr
ksatisfy the first four axioms. (k
1
,
2
...,
n
)
and
1
2
....
n,
then;
n
Cr
Cr
n
nCr
1,....,
1
1
...
(3)
,....,
. each For
1
n Definition 1: (Liu 2004, 2007) any set function
Cr
satisfying the first four axioms is called “credibility measure.”Moreover, the credibility measure of an empty set is zero; i.e.,
Cr
0
Definition 2: (Liu, 2007). A fuzzy random variable
can be defined in Liu’s framework as a mappingfrom credibility space
,
P
(
),
Cr
to the space of real numbers; i.e.,
:
,
P
(
),
Cr
.Example 1: Let
1,
2
and
Cr
1
Cr
2
0
.
5
then
,
P(
),
Cr
is a credibility space,and the function
2 1if
,
1
if
,
0
is a fuzzy variable in the credibility theory framework.Example 2: Let
,
2
Cr
and
1
,
0
. Then
,
P
(
),
Cr
is a credibility space and the function
is a fuzzy variable in the sense of credibility theory.NB: A crisp number
C
may be regarded as a special fuzzy variable. In fact, it is the constant function
C
on the credibility space
,
P
(
),
Cr
. A fuzzy variable
is said to be: Non-negative if
Cr
0
0
Positive if
Cr
0
0
Simple if there exists a finite sequence
x ,....,
1x
n
such thatCr
x
1,...,
x
n
0
Definition 3: (Liu, 2007). A
n
dimensional fuzzy vector
1,....,
n
is defined as a function from a credibility space
,
P
(
),
Cr
to the set ofn
dimensional real vectorsX
x
1,....,
x
n
.Fuzzy arithmetic is similar to that of real numbers. The sum (product) of two fuzzy numbers
1and
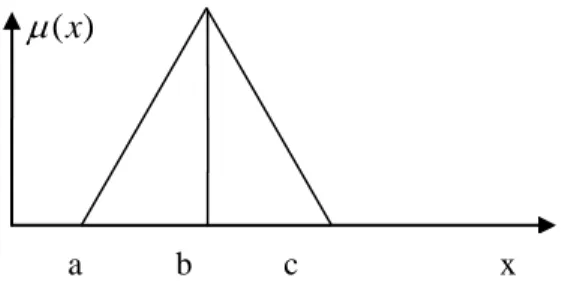
2is also a fuzzy number. The product (sum) of a fuzzy number with a scalar number is also a fuzzy number. We refer interested readers to Liu (2004) for proof.2.3 Membership Function
The membership function represents the degree of possibility that the fuzzy variable
takes some prescribed value. If a fuzzy variable is defined on the triplet
,
P
(
),
Cr
then its membership function is derived from the credibility measure by:
x
2
Cr
x
1
;
x
(4)A triangular fuzzy variable is defined by the triplet
a ,
,
b
c
where crisp valuesa
b
c
; and has the following membership function:
otherwise
,
0
b
x
if
,
1
c
x
b
if
,
b
x
a
if
,
c
b
c
x
a
b
a
x
x
(5)Graphically a membership function for a triangular fuzzy variable has the following form:
)
(x
Figure 1: Membership Function of a Triangular Fuzzy Variable
2.4 Credibility Distribution
Liu (2002) defined the credibility distribution
:
0
,
1
of a fuzzy variable
to take a value less or equal tox
as:
x
Cr
x
/
(6)Let
be a fuzzy variable with membership function
, then Liu (2007) defines its credibility distribution as:
x
;
y
1
y
2
1
Y YSup
Sup
x
(7) 2.5 Chance DistributionA random fuzzy variable is a function from the credibility space
,
P
(
),
Cr
to the set of random variables. It is worth noting that two measures are involved in chance distribution, namely the credibility measure defined in
,
P
(
),
Cr
and the probability measure defined in
, A
,
Pr
where
andA
are defined as the fundamental non-empty set events and the event defining the sigma algebra. The combination of credibility and probability measures leads to a hybrid theory referred to as the chance measure theory that models both random and fuzzy events simultaneously. The chance of a random fuzzy event
is a function from
0
,
1
to
0,1
defined as:
Pr
)
(
Sup
Inf
Ch
A Cr (8)Zhu and Liu (2004) define the chance distribution as:
x
Ch
x
x
,
(9)The first and second moments of a triangular fuzzy variable are given by:
The mean
4
2
b
c
a
E
(10)And the variance
24
2
a
c
Var
(11)The average chance distribution of a random fuzzy variable is a chance distribution involving credibility and probability measure theories. It is used in this paper to model both randomness and fuzziness (ambiguity) in the hedge fund universe. Liu (2007) defines the average chance distribution of a random fuzzy variable
by:
1 0x
Pr
:
x
dx
Cr
x
Ch
(12)2.6 Fuzzy Credibility Regression Model
Credibility regression analysis with average chance distribution describes the relationship of both random variables (such as investment style returns, asset prices, etc.) and fuzzy variables (such as the fund manager’s belief about the general market trends, the degree to which a fund manager is bullish, the degree to which a fund manager is bearish on a given investment style, etc.).
1 n i k k ki i
y
x
e
(13) wheren
1 or 2,
2 1 2x =(
r
mt
r
f) for n=1 or x =(
r
mt
r
f) for n=2; i
1,2,...,T
If
n
1
, then this model nests the linear CAPM model shown in Equation (1), ifn
2
, the model in Equation (13) nests a quadratic CAPM shown in Equation (2).In Equation (13)
y
i,
x
i,
,
i,
e
i represent the excess return on the main style, excess return on the factori
, the alpha, sensitivity ofx
kito changes iny
iand the disturbance term respectively.To express the uncertainty about alpha, the ambiguity surrounding the coefficients generating process, the difficulties in verifying the validity of assumptions of the underlying data distribution, the inaccuracy and the distortion introduced by linearization, we present a corresponding fuzzy credibility regression model of the form:
1
ˆ
ˆ
ni k k ki i
y
x
e
(14)where
ˆ~
,
ˆ~
i,
~
e
i are triangular fuzzy numbers under credibility measure theory representing the alpha, the sensitivity ofx
kito changes iny
iand the disturbance term respectively. In matrix form, Equation (14) can be written as:e
~
ˆ~
X
Y
(15)where
ˆ
ˆ,
ˆ
1 for a linear CAPM,
ˆ
ˆ, ,
ˆ ˆ
1 2
for a quadratic CAPM; i.e.,
ˆ
is a vector of triangular fuzzy coefficients estimated under credibility measures. The triangular fuzzy disturbance term is defined in such a way that it contains both randomness and fuzziness; i.e., probability and uncertainty information respectively. Hence it can be written as:
e
~
(16)where
is a random disturbance component defined on a probability space
, A
,
Pr
and
a fuzzy (uncertainty) disturbance component defined on
,
P
(
),
Cr
.We define a triangular fuzzy set of event
corresponding to the disturbance term:
~
e
i/
~
e
iy
ix
tiˆ~
;
i
1,2,....,
T
(17)Following Liu (2004), the expected mean and variance of the triangular fuzzy disturbance term
~
e
i are as follows:
(2 0) 0 4 i h h E e (18)
6 h e ~ Var 2 1 (19)where
h
0
is the spread of a triangular fuzzy number centred at zero. To estimate the parameters
ˆ~
and
Var(
ˆ~
i)
we use the maximum uncertainty principle proposed by Liu and Liu (2003), which states that for any fuzzy event, if there are multiple reasonable values that a chance measure may take, then the value as close to 0.5 as possible is assigned to the event. Under this principle, the average chance M-estimation of parameters
ˆ~
,
a,
b,
c,
and
Var(
ˆ~
i)
consists in minimizing the following objective function:
2 1 2 1 ˆ ˆ Q , a, b, c, / , ,...., ; a, b, c, 0.5 2 Subject to E e 0 4 n t t T i i i Minimize y y y y x a b c
(20)where
ˆ
t
ˆ
0,...,
ˆ
k
; k=1 or 2
(k
1
for linear CAPM or 2 for quadratic CAPM,
ˆ
0
).Notice that to obtain
ˆ
we need to get the first derivatives of the objective functionQ
(.)
with respect to
~
subject toa
2
b c
0
and equalize it to zero. The same for 1ˆ
,
ˆ
2,a
,
b,
c,
and
. In fact we need to obtainK
1
parameter estimates from the fuzzy credibility regression model in Equation (14) and four other parametersa
,
b,
c,
and
related to the triangular mean and standard deviation of the coefficient estimates. Hence we need to solve a system of
K
5
non-linear equations subject toa
2
b
c
0
.The solution to this optimization problem is obtained using a numerical method proposed by Dennis (1977) and known as the non-linear least square optimization method.
2.7 Bayesian Regression Model
The main purpose in applying Bayes’s theorem to skill coefficients estimation is to combine the information derived from the investment style returns series with the fund manager’s prior belief. We begin by building the posterior distribution from which simulated skill coefficients are generated and averaged to form the posterior outperformance, the posterior selectivity, and the posterior market timing skills. The following equation is used for this purpose:
( /
)
( /
) ( )
p
X
L
X
(21)where
is the set of skill coefficients, andX
is the matrix of excess returns on investment styles. The posterior(
/
)
p
X
distribution contains all relevant information about the unknown parameter
.L
(
/
X
)
is the likelihood function, and
( )
is the prior distribution of
depending on one or more parameters.Let
,
1
for a linear CAPM or
, ,
1 2
for a quadratic CAPM be a vector of skill coefficients to be estimated and
2the variance of the disturbance term to be estimated as well. Assuming that the skill coefficients vector
has a normal prior distribution conditional on
2, and that
2 has an inverted chi-square:
2 prior distribution; i.e.,2 0
/
N
(
,
A
)
(22) and)
,
(
-Inv
2 0 02 2C
(23)Four parameters have to be determined a priori, namely:
0,
A
,
0,
and
C
02. The scale matrixA
,
is often chosen to be
1(
'
)
1 in order to obtain a prior covariance the same as the covariance matrix of the ordinary least square estimator of
up to a scaling constant. Varying the scale parameter
allows one to adjust the degree of confidence one has that
’s mean is
0. The smaller the value of
the greater the degree of uncertainty about
. The posterior distribution for
with informative prior is:2
0
(
/
, ,
)
(
,
)
p
N
(24)where
0and
are the posterior mean and posterior covariance matrix of
respectively. We simulate 21,000 values of
from the posterior distribution using the Gibbs sampler method. Their average value represents the posterior outperformance, the posterior selectivity and the posterior market timing skills reported in the empirical results section.3. TWO-PERIOD PERFORMANCE ANALYSIS
We test the null hypothesis of no managerial skills (neither selectivity nor market timing skills) in two period framework using three different techniques simultaneously, namely: the contingency table, the chi-square test, and the cross-sectional regression. Following some previous studies (Capocci et al., 2003), we divide our sample data into four overlapping subsamples that include different economic market trends such as the 1995 financial crisis in Japanese, the 1997 financial crisis in Asian, the Dotcom bubble in 2000, the 1998 Russian financial crisis, and the 2008-2009 sub-prime crisis. It is worth noting that the aim of this paper is not to identify crisis dates that are already known by average informed investors, but instead to assess the effectiveness of each investment style during different economic market trends.
Persistence in performance in this context relates to fund managers who are winners in two consecutive periods (from subsample period 1 to sub-sample period 2 or from sub-sample period 2 to sub-sample period 3 or from sub-sample period 3 to sub-sample period 4) denoted by WW, or losers in two consecutive periods, denoted LL. Similarly, winners in the first period and losers in the second period are denoted by WL, and LW denoted the reverse.
Firstly, the cross product ratio (CPR) proposed by Christensen (1990) is used to detect the persistence in performance of fund managers. The CPR is given by:
WL LW
LL WW CPR * * (25)The CPR captures the ratio of the funds which show persistence in performance to the ones which do not. Under the null hypothesis of no persistence in performance, the CPR is equal to one. This implies that each of the four categories denoted by WW, WL, LW, and LL represent 25% of all funds. To make a decision about the rejection of the null hypothesis, we make use of the Z-statistic given by:
) CPR ( Ln CPR Ln statistic Z (26) whereLL
LW
WL
WW
CPR Ln1
1
1
1
) (
(27)For example, a Z-statistic greater than 1.96 indicates evidence of the presence of significant persistence in performance at a 5% confidence level. (For more details see Kat & Menexe, 2003; De Souza & Gokcan, 2004.)
Secondly, the chi-square test is also used to compare the distribution of observed frequencies for the four categories WW, WL, LW, and LL for each investment style with the expected frequency distribution. Studies carried out in persistence performance using chi-square test (Carpenter & Lynch, 1999; Park & Staum, 1998) reveal that this test based on the numbers of winners and losers is well-specified, powerful, and more robust than other test methodologies, as it deals carefully with the presence of survivorship bias. The chi-square test statistic (see Agarwal & Naik, 2000) is given by:
4 2 4 3 2 3 2 2 2 1 2 1 2 D D LL D D LW D D WL D D WW Cal (28) where
N LL WL * LL LW D N LW WW * LL LW D N LL WL * WL WW D N LW WW * WL WW D 4 3 2 1Lastly, the cross-sectional regression technique is used to investigate the persistence in performance of hedge fund managers. Current period performance parameters (outperformance, selectivity, and market timing skill coefficients) are considered dependent variables, while previous parameters are considered independent variables. If the coefficient of the independent variable is positive and statistically significant then it is an indication that current performance is explained by previous performances; hence there is evidence of persistence in performance; i.e., evidence of managerial skill across two consecutive periods.
4. EMPIRICAL RESULTS
4.1 Data
We consider a set of returns on hedge fund indices provided by Hedge Fund Research Inc. (HFRI). The monthly returns series are HFRI investment style indices representing the equally weighted returns, net of fees, of hedge funds classified in each investment style. The dataset extends from January 1995 to June 2010. A complete list of all investment styles used in this paper and their respective labels is available from the author. To account for survivorship bias we consider only the sample periods of after 1994. According to Capocci and Hubner (2004), hedge fund data starting after 1994 is more reliable and does not contain any survivorship bias.
Based on previous work done by Capocci et al. (2003); we divide our sample period into four overlapping sub-samples. We use the Russell 3000 as the benchmark index and consider March 2000 as a separation date between sub-sample period 1 (before March 2000) and sub-sample period 2 (after March 2000) as in Capocci et al. (2003). During the sub-sample period 1 (January 1995 to March 2000), the Russell 3000 posted positive monthly
returns in 70% of months, with an average yearly return of 19.4%, whereas during the sub-sample period 2 (April 2000 to Dec 2002), the index posted positive monthly return in 39% of months, with an average yearly return of -16.9%. During sub-sample period 3 (January 2003 to January 2007), the Russell 3000 index posted positive monthly returns in 69% of months, with an average annual return of 15.01%. During the sub-sample period 4 (February 2007 to June 2010), the Russell 3000 index had a negative monthly return in 56% of months, with an annualized rate of return of nearly -11.7%.
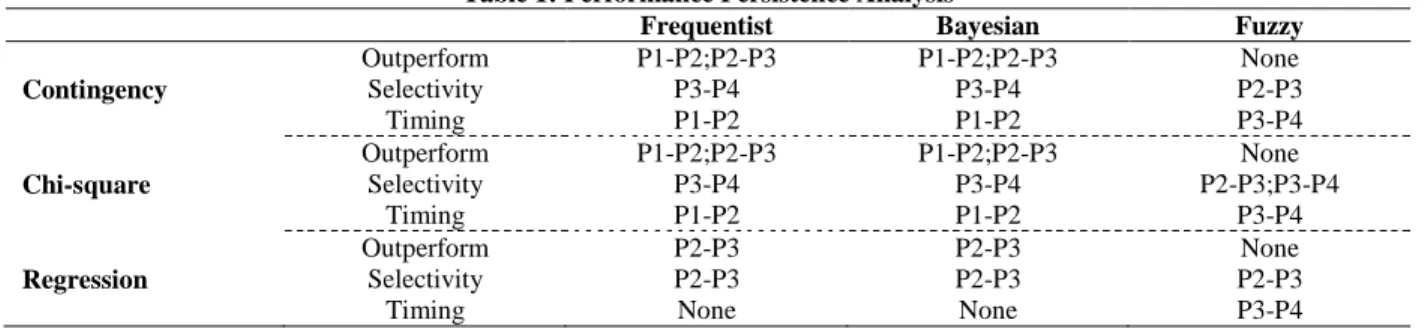
We summarize the results of our investigation on hedge fund performance persistence analysis in the Table 1. More detailed results corresponding to each econometric model are available from the author. The table reports the persistence in performance per econometric model used in columns, while it reports the technique used to identify persistence in performance for each skill coefficient in rows. For example, the first column of this table can be read as follows. Using the frequentist econometric model, the contingency table results show that there is outperformance skill in hedge funds from sub-sample period 1 to sub-sample 2, and from sub-sample period 2 to sub-sample period 3. This outperformance is due to market timing skill during sub-sample period1 to sub-sample period 2; without selectivity skill during the same sub-sample periods.
Table 1: Performance Persistence Analysis
Frequentist Bayesian Fuzzy
Outperform P1-P2;P2-P3 P1-P2;P2-P3 None Contingency Selectivity P3-P4 P3-P4 P2-P3 Timing P1-P2 P1-P2 P3-P4 Outperform P1-P2;P2-P3 P1-P2;P2-P3 None Chi-square Selectivity P3-P4 P3-P4 P2-P3;P3-P4 Timing P1-P2 P1-P2 P3-P4 Outperform P2-P3 P2-P3 None Regression Selectivity P2-P3 P2-P3 P2-P3
Timing None None P3-P4
The results of the first two econometric models (frequentist and Bayesian) show that hedge fund managers exhibit persistence in outperformance skills during the period between sub-sample period 1 and sub-sample period 3. These results contradict the EMH and show that some fund managers have skills to outperform the market during periods of low and strong economic recovery. However, the results obtained with the fuzzy credibility model show that fund managers do not exhibit any presence of outperformance skills during the overall sample period, therefore supporting the EMH according to which no market participant can make risk-adjusted abnormal rates of return.
In addition, the first two econometric models (frequentist and Bayesian) show that fund managers exhibit significant selectivity skill during the period between sub-sample period 3 and sub-sample period 4, while the third model (fuzzy credibility) shows that few hedge fund managers exhibit selectivity skill during period of economic recovery only.
With regard to market timing skills, the first two econometric models show that there is presence of persistence in market timing skill “for some managers” during the period between sample period 1 and sub-sample period 2 only. The third econometric model shows that fund managers exhibit persistence in market timing skill during the period between sub-sample period 3 and sub-sample period 4. Many market experts believe that the period after the sub-prime crisis would see asset prices coming off their lows, making it easy for many fund managers to time the market precisely when it is coming out of the recession.
5. DISCUSSION OF RESULTS AND CONCLUSION
The main objective of this paper is to determine whether fund managers can outperform the market consistently during different economic market trends. To reach this objective, monthly returns on hedge fund indices collected from the HFRI group (one of the largest hedge fund data providers in the world) are considered for the period between January 1995 and June 2010. With this main objective in mind, we divide our entire sample into four overlapping sub-sample periods in order to determine whether skilled fund managers would consistently outperform the market in these different sub-sample periods. Our sample sub-division is consistent with what has been done previously in the literature (see for example Capocci et al., 2003; Carhart, 1997).
We base our inferences on the EMH as a prediction model by assuming that the market is efficient and that fund managers cannot outperform it. To carry out this performance analysis, we use the CAPM (Sharpe, 1964) and quadratic CAPM (Treynor & Mazuy, 1966) and employ three different econometric models, namely the frequentist, the Bayesian, and the fuzzy credibility models to estimate the outperformance, the selectivity and the market timing skill coefficients. The first two models are referred to as probability models, while the last one is termed an uncertainty model. Using three different techniques widely applied in hedge fund performance analysis (see for example Naik, 2009) – contingency table, chi-square test, and cross-sectional regression – we obtain the following results.
The performance analysis results obtained with the first econometric model (Frequentist) show that fund managers have skills to outperform the market during the entire sample period. However, this outperformance is mostly due to market timing skill rather than selectivity skill. In order to test the robustness of our findings, we replicated the same analysis using the second and third econometric models; i.e., the Bayesian and fuzzy regression models.
For the Bayesian regression model, we employed the Monte Carlo simulation method using the Gibbs sampler with 21,000 simulations. Results obtained with this econometric model show that fund managers have the skills to outperform the market during sub-sample period 1 through sub-sample period 3. This market outperformance is due to market timing skill during sub-sample period 1 and sub-sample period 2 and to selectivity skill during sub-sample period 2 through sub-sample period 3.
The last econometric model (fuzzy regression) results in findings that are opposite to those obtained with the two previous probability models. These results show that although there are some managers with little selectivity skill (during sub-sample 3 to sub-sample period 4) and timing skill (during recovery period only), fund managers do not have enough skills to outperform the market because of lack of market timing.
One major economic explanation of the difference between probability and uncertainty models is that, theoretically speaking, the source of hedge fund performance is market inefficiencies which are exploited by skilled fund managers to generate alphas. The recent increase in the number of sophisticated computer programs such as high frequency trading, which detect market mispricings and exploit them spontaneously, has made market inefficiencies even rarer, thereby leading to greater market efficiency. Given the pressure from their investors, some fund managers attempt to conduct illicit activities such as insider trading in order to create alphas.
The scarcity of market inefficiency is an indication that the results obtained with our uncertainty model are reliable. Uncertainty models use quantity information (return series) as well as fuzziness (scarcity of market inefficiency, level of bullishness or bearishness, etc.) to show that the risk-adjusted investment returns of hedge funds may be equal to those of the market (especially in bear markets) due to the high management and performance fees that hedge funds charge to their investors. In these circumstances, EMH partisans would argue that due to information dissemination, there is no arbitrage opportunity in hedge funds.
In contrast, probability models show that the presence of some fund managers endowed with selectivity and market timing skills is proof that bounded rationality leads to market inefficiency. This finding contributes to on-going research in the field of behavioural finance which believes that market inefficiencies are the result of less than fully rational behaviour on the part of some market participants.
Although some fund managers can beat the market, investors in hedge funds need to understand that their money is held for a long lock-in period and that the administration and management fees they pay to hedge funds can lower their profit and make their risk-adjusted return equal to that of the market.
The uncommon risk-taking behaviour we have witnessed recently in the hedge fund industry is a result of the fact that the compensation of fund managers is determined by their performance. If the performance is better, the manager is likely to get large bonus. Consequently each fund manager attempts to take higher risk in order to obtain better performance. When fund managers take risky positions, they know that they expose their firm to significant risk, but they do not care about it because their compensation scheme does not force them to face the consequences of the risk they take.
In many cases, fund managers are compensated largely on the size of the risky positions they take and not on the long-term performance of these positions. We recommend that policy-makers create a safer environment for investors in hedge funds by holding back a portion of an individual fund manager’s bonus on a rolling one-year basis, for example, as tangible insurance for future losses caused by that fund manager, and also by shortening the lock-in period to allow short-term redemption options. This can limit excessive risk-taking behaviour.
AUTHOR INFORMATION
John Muteba Mwamba, Ph.D., University of Johannesburg, Department of Economics and Econometrics. Office: D-ring 218, Auckland Park, 2006, South Africa. Tel: +27115594371; Fax: +27115593039. E-mail: [email protected]
REFERENCES
1. Adamti, A., Bhattacharya, S., Pfleiderer, P., & Ross, S. A. (1986). On timing and selectivity. Journal of
Finance, 41(3), 715-730.
2. Agarwal, V., & Naik, N. Y. (2000). Multi-period performance persistence analysis of hedge funds. Journal
of Financial and Quantitative Analysis, 35, 327-342.
3. Brown, S. J., Goetzman, W. N., & Ibbotson, R. G. (1999). Offshore hedge funds: Survival and performance 1989-1995. Journal of Business, 72, 91-118.
4. Capocci, D., & Hübner, G. (2004). An analysis of hedge fund performance. Journal of Empirical Finance,
11, 55-89.
5. Capocci, D. P. J., & Hubner, G. (2003). An analysis of hedge fund performance. Journal of Empirical
Finance, 11, 55-89.
6. Carhart, M. (1997). On persistence in mutual fund performance. Journal of Finance, 52, 57-82.
7. Carpenter, J. N., & Lynch, W. A. (1999). Survivorship bias and attrition effects in measures of performance persistence. Journal of Financial Economics, 54, 337-374.
8. Christensen, R. (1990) Log-linear models. Springer-Verlag, New York.
9. De Souza & Gokcan (2004). Hedge fund investing: A quantitative approach to hedge fund manager selection and de-selection. Journal of Wealth Management, 6(4), 52-73.
10. Dennis, J. E., Jr. (1977) Nonlinear least-squares: State of the art in numerical analysis, Ed. D. Jacobs, Academic Press.
11. Ennis, R. M., & Sebastian, M. D. (2003). A critical look at the case for hedge funds. Journal of Portfolio
Management, 29(4), 103-112.
12. Fama, E. F. (1984). The information in term structure. Journal of Financial Economics, 13, 509-528. 13. Fung, W., & Hsieh, D. A. (1997). Empirical characteristics of dynamic trading styles: The case of
hedge funds. Review of Financial Studies, 10, 275-302.
14. Hwang, S., & Salmon, M. (2002). An analysis of performance measures using copulae. Performance
Measurement in Finance, 160-197.
15. Jensen, M. (1968). The performance of mutual funds in the period 1945-196. Journal of Finance, 23, 389-416.
16. Kat, H. M., & Menexe, F. (2003). Persistence in hedge fund performance: The True value of a track
record. (Working Paper). City University, London.
17. Kosowski, R., Naik, N. Y., & Teo, M. (2007). Do hedge funds deliver alpha? A Bayesian and bootstrap analysis. Journal of Financial Economics, 84(1), 229-264.
18. Liu, B. (2002). Theory and practice of uncertainty programming. Physcia-Verlag, Heidelberg
19. Liu, B. (2004). Uncertain theory: An introduction to its axiomatic foundations. Springer-Verlag, Berlin. 20. Liu, B. (2007) Uncertainty theory. Series: Studies in Fuzziness and Soft Computing, Vol. 154, Springer. 21. Liu, B., & Liu Y. K. (2003). Fuzzy random variables: A scalar expected value operator. Fuzzy Optimization
and Decision Marketing, 2(2), 143-160.
22. Lo, A. W. (2008). Hedge funds, and the financial crisis of 2007-2008: Written testimony for the house
oversight committee hearing on hedge funds. (Working Paper). MIT Sloan School of Management.
23. Park, J. M., & Staum, J. C. (1998). Performance persistence in alternative investment. (Working Paper). Paradigm Capital Management, Inc.
24. Sharpe, W. (1964). Capital asset prices: A theory of market equilibrium under conditions of risk. Journal of
Finance, 19(3), 425-442.
25. Treynor, J. L., & Mazuy, F. (1966). Can mutual funds outguess the market? Harvard Business Review, 44, 131-136.