Munich Personal RePEc Archive
Does economic freedom lead or lag
economic growth? evidence from
Bangladesh
Tanin, Tauhidul Islam and Masih, Mansur
INCEIF, Malaysia, INCEIF, Malaysia
12 May 2017
Page 1 of 28
Does economic freedom lead or lag economic growth? evidence
from Bangladesh
Tauhidul Islam Tanin1 and Mansur Masih2
Abstract
Despite a drop of 0.2 points in 2015 in the Index of Economic Freedom, Bangladesh is awarded an upgraded economic status by the World Bank due to a consistent and boosted economic growth. However, there is a debate as to whether Economic Freedom leads or lags economic growth. Using ARDL approach and taking Bangladesh as a case study, this paper investigates whether economic freedom leads or lags economic growth in Bangladesh during the period 1995 - 2015. This study chooses Heritage Foundation's Index of Economic Freedom as it is widely accepted. The results tend to indicate that Economic Freedom does clearly lead and enhance economic growth in the context of Bangladesh during the period under review.
Keywords: Economic Freedom, Economic Liberalization, Economic Growth, Bangladesh, ARDL
1
Graduate student in Islamic finance at INCEIF, Lorong Universiti A, 59100 Kuala Lumpur, Malaysia.
2Corresponding author, Professor of Finance and Econometrics, INCEIF, Lorong Universiti A, 59100 Kuala Lumpur, Malaysia.
Page 2 of 28
1. Introduction
Economic growth refers to the economic development of a country. Therefore, the economic growth and its flourishment are awaited by all economies in the world. It is composed of human capital, physical capital and technology (Rivera-Batiz & Romer 1990). Across the ages, economic growth has continually remained a significant focus in addressing economic problems of various countries (Justesen 2008). In line with the influential contribution of Romer (1986), economic growth has witnessed a significant amount of studies in the last decade, bringing a revitalization for it. Moreover, the economists in these days, count economic growth as a critical matter in lessening misery and world poverty (Compton et al. 2011). Therefore, one might wonder “which economic policies are most
favourable to growth” (Berggren 2003)? One of the probable answers would be the policies and practices that stimulate economic freedom as a viable solution towards a sustainable economic growth.
That statement is validated by Berggren (2003), Berggren & Kurrild-Klitgaard (2004) and De Haan et al. (2006) stating that economic freedom is a vital determinant for attaining the economic growth. The countries which are entitled to higher levels of economic freedom enjoy higher growth rates and greater factor efficiency (Bengoa & Sanchez-Robles 2003). Wu (2011) notes that “In an economically free society, individuals are free to work, produce, consume, and invest in any way they please, with that freedom both protected by the state and unconstrained by the state.” Economic freedom is undoubtedly the fundamental right of everyone to control one’s own labour and property. It necessitates competition thus there can be compelling reasons to assume that free economies develop faster than that of less free (Gwartney et al. 2011) as competition directs to greater economic growth.
Moving forward with Bangladesh and a glimpse of its economic standing in the current world: The potential of Bangladesh to grow economically is quite notable. It is maintaining an overall increasing growth rate since its advent in 1971. In the year of 2015, the growth rate of Bangladesh was 6.6% which is quite praiseworthy compared to many other countries. Asian Development Bank (ADB) documented that Bangladesh is estimated to grow by 7.1% in the financial year of 2016, higher than earlier forecasts (ADB 2016). Also, among all South-Asian countries, the economic growth rate of Bangladesh is at the second rank which means the presence of Bangladesh in this region may be considered noteworthy. It may note that the economy of Bangladesh is the 44th largest in nominal terms and 32nd largest by purchasing power parity (PPP) in the world. Moreover, it categorised among the Next Eleven3 evolving market economies by the analysts.
3 The Next Eleven (also known by N-11) are the 11 countries – Bangladesh, Egypt, Indonesia, Iran, Mexico, Nigeria, Pakistan, the
Philippines, Turkey, South Korea and Vietnam are classified by Goldman Sachs investment bank and economist Jim O'Neill as having a high potential of becoming, alongside the BRICS countries, among the world's largest economies in the 21st century
Page 3 of 28 Earlier, the World Bank declared that Bangladesh might jump to the lower-middle income countries’ category if Bangladesh can maintain a per capita Gross National Income (GNI) of USD 1,046 or above for three consecutive years. Following that declaration, in the 1 July 2015, the World Bank upgraded the status of Bangladesh from the least developed countries (LDCs) category to the lower middle-income classification (Quadir 2015). Because Bangladesh managed to maintain consistent growth rate with a better GNI per capita, say slightly more than USD 1,046 for the last three years.
In 2015, Bangladesh experienced significant improvements in some indicators of Index of Economic Freedom namely corruption, labour, and monetary. Despite all, Bangladesh remains trapped in the
“mostly unfree” category concerning economic freedom. With a score of 53.9, Bangladesh is ranked 131th freest out of 186 countries in 2015 Index of Economic Freedom published by Heritage Foundation in partnership with The Wall Street Journal (Gwartney et al. 2015). While in 2013, the rank of Bangladesh was 132nd and remained unchanged for the year of 2014. Then the index points fell by 0.2 points in 2015 because of a remarkable decline in business freedom and investment freedom, making it 131th freest country in the globe. For the last five years, Bangladesh’s economic freedom floated around the lower end of the “mostly unfree” group.
These sorts of dynamics make us interested in examining whether economic freedom has any impact on economic growth in Bangladesh. So far, to the best of the knowledge of the authors, no single study has yet been conducted with the primary focus on Bangladesh. Therefore, this study takes the opportunity and makes a humble attempt to investigate the causal relationship between economic freedom and economic growth. The research objective is to test whether economic freedom leads or lags economic growth of Bangladesh. Therefore, this paper aims to employ a time-series technique, namely autoregressive distributed lag (ARDL) approach following the existence of the regressors of I(0) and I(1). While data for economic freedom sourced from Heritage Foundation, other economic data extracted from World Development Indicators (WDI) of World Bank. The study will cover a period of 1995 to 2015 constrained by the availability of the Index of Economic Freedom. This paper is expected to offer a comprehensive evidence on the underlying relationship between economic freedom and growth to formulate robust economic policies by the economists and regulatory bodies in Bangladesh.
Page 4 of 28 of economic freedom in 2015, the growth of Bangladesh economy continues to rise. VDC also suggests that the degrees of exogeneity of GDP growth rate, inflation, and real interest rate are expected to be unchanged in the eight years of horizons. Also, the robustness tests using IRFs suggest that although the changes in economic freedom can destabilise all the variables allowing a long time to adjust, it seems that economic freedom is not affected by shocks emanating from other variables. For instance, a shock in economic growth seems to have no impact on the economic freedom which is clearly leading. Besides, both the stability tests - CUSUM and CUSUMSQ indicate that the coefficients are all stable and have no structural break that means the results appear to be reliable.
Page 5 of 28
2. Theoretical Background and Empirical Framework
2.1 Economic freedom
There are numerous definitions of economic freedom according to the literature. Economic freedom, for instance, denotes for “…the absence of government coercion or constraint on the production, distribution, or consumption of goods and services beyond the extent necessary for citizens to protect and maintain liberty itself.’’(Miles et al. 2004, p.50). However, Gwartney & Lawson (2003, p.406) defined this freedom as a “…personal choice, voluntary exchange, freedom to compete, and protection
of persons and property”. Alike, “world economic freedom includes the stability and security of the legal system, monetary policy, freedom to own foreign currency, the structure of capital markets, private ownership of banks, international exchange rates, and avoidance of negative interest rates”
(Compton et al. 2011).
It also highlights that presence of economic freedom simply means the presence of the rule of law, comprising state protection of compliance and property rights with agreement settled (Berggren 2003; Wu & Davis 1999). Economists reach to an agreement that economic freedom alongside civil liberties and political freedom is one of the pillars of a country’s institutional structure, and following so, institutions are among the outstanding factors in defining cross-country variances in living standards (Doucouliagos & Ulubasoglu 2006). For example, Easterly & Levine (1997) note that classical factors such as human and physical capital and labour supply do not justify the growth in Africa entirely and instead highlights institutional variations.
2.2 Economic Growth
Wu (2011) notes that the typical Ricardian theory defines economic growth using quantity of output produced by the economy. It believes the economy as a production machine is transforming labour, capital, and natural resources into the output. Fundamentally, the Ricardian theory assumes that an
economy’s potential, as explained by its technology and resources, will be wholly realised. Thus, once output expands more rapidly, it may either due for larger quantities of inputs or come from better technology. This assumption seems far-fetched to the development economists as they claim that
less-developed countries’ problem is not an absence of potential but incapability to realise that.
Page 6 of 28 accompanying the most traditional variables such as physical, labour and human capital, and technology used in endogenous and neoclassical growth models (Olson 1996).
2.3 Economic Freedom and Economic Growth
One might wonder what could be the theoretical relationship between economic freedom and economic growth and how it affects economic growth. The earlier literature states that economic freedom is, “the
extent to which countries possess free market institutions that protect property rights and implement policies which provide for trade and voluntary exchange is instrumental in achieving economic
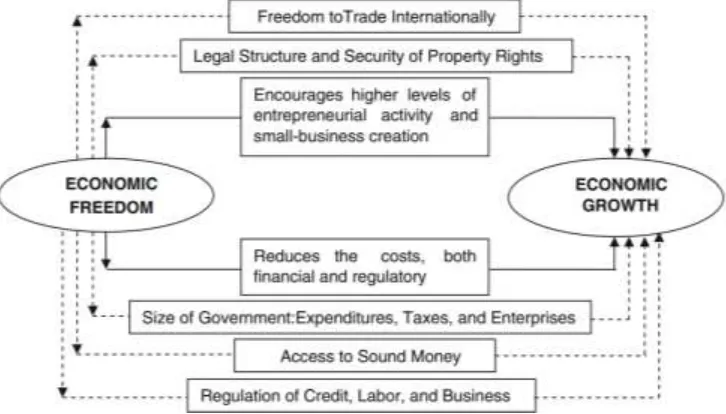
[image:7.595.117.480.380.587.2]growth” (Justesen 2008). Since economic freedom supposed to influence the incentive structure where investors, economic agents, and producers play around, it most likely to have an impact on wealth and poverty, and so on economic growth. Per se, economic freedom is a vital indicator, and its discrete dimensions are about to exercise diverse impacts on the economic health (Ayal & Karras 1998; Heckelman & Stroup 2000; Dawson 2003; Berggren & Jordahl 2006; Carlsson & Lundström 2002). Figure 1 below suggests a conceptual framework for economic freedom and economic growth.
Figure 1: Conceptual Framework: Economic Freedom and Economic Growth. Source:(Gwartney et al. 2008)
Gwartney & Lawson (2008)defined economic freedom as a means of five following dimensions: (1) The size of government4, (2) Property rights and legal structure, (3) Sound money5, (4) International
trade and trade policies, and (5) Regulation of business, labor and credit markets. There are theoretical reasons to suspect for each indicator that free economies will perform otherwise from centrally planned, highly regulated, or anarchic economies (De Haan et al. 2006). However, Heritage Foundation (2016a)defines economic freedom based on ten qualitative and quantitative factors under
Page 7 of 28 the hood of four broad categories or pillars such as (1) Rule of Law6, (2) Limited Government7, (3)
Regulatory Efficiency,8 and (4) Open Markets9. One can notice that two groups of people define
economic freedom quite similarly. Also, the philosophical foundations remain the same in both the indexes (Debroy et al. 2014). That means, the language of economic freedom is universal. Considering the interest of this paper, it will be talking about the later pillars of the Index of Economic Freedom.
2.3.1 Rule of Law
Economic growth most likely depends on the degree of laws of a country to protect private property rights or enforced laws to those by the government. Theoretically, property rights are inclined to the reason that safeguards private property rights are essential for founding firm and individual level incentives to produce and invest (North 1990). As Justesen (2008) states, to enable economic exchanges and appreciate mutually beneficial proceeds from property rights, trade and contracts need to be rightly enforced. Uncertain property rights suggest a greater risk that expected gains from present investments would be missing either of theft or unconditional government expropriation (Olson 2000). Furthermore, uncertain property rights are expected to alter resources allocations. That is, more resources employed to immediate consumption over long-term savings and investments.
In contrast, corruption is "misuse of public power for private benefit" (Transparency International 2010) and deteriorates economic freedom using uncertainty and insecurity into economic relationships. Husted (1999) finds that corruption significantly linked to GNP per capita, masculinity, power distance, and uncertainty avoidance. To minimise corruption from the economy through awareness generation process, Transparency International (TI) dedicated since 1995 building a Corruption Perceptions Index (CPI) measuring the corruption level in 178 countries. This Index works as media to send an influential message to the governments thereby are forced to take into consideration and act upon helping the economic growth (Transparency International 2016).
2.3.2 Limited Government
We know that taxation affects the economy very well and fiscal freedom is a measure of the tax burden levied by the government. It consists of both the direct tax burden in the form of top tax rates on corporate and individual incomes and the comprehensive sum of tax revenue as a GDP percentage. High taxation rate may misrepresent incentives to invest, work, and produce, as taxes decrease returns from productive effort and private investment, and resultantly may lead to upsurges in demand for
6 Property rights and freedom from corruption 7 Fiscal freedom and government spending
Page 8 of 28 leisure rather than work (Easterly & Rebelo 1993). Meaning that it lowers the aggregate production down impairing economic growth.
However, a higher government spending asks for a higher taxation scheme, and this spending reflects government expenditures levels as a GDP percentage which includes transfers and consumption and, making up the entire score. Justesen (2008) documented that different visible features of government consumption might affect growth in dissimilar manners. For example, pure government transfers may proceed individual incentives to reduce the work/leisure ratio (i.e. work less). It usually documented that government provision for a certain level of public goods such as infrastructure, communications, transport, and legal system boost up economic growth, lessened transaction costs and hence enables realised gains from trade. Moreover, government spending in health and education sectors possibly increase the quality of human capital and so on economic growth.
2.3.3 Regulatory Efficiency
Business freedom represents the lack of inclusive burden of regulation alongside the government efficiency in the regulatory process. In contrast, the labour freedom exhibits numerous aspects of the regulatory and legal framework in the labour market of a country. It explains regulations regarding minimum wages, severance requirements, laws inhibiting layoffs, and quantifiable regulatory burdens on hiring, hours, and so forth. Moreover, monetary freedom defines price stability with a valuation of price controls whereby both price controls and inflation alter market activity. It is likely that government regulations on labour, business and money markets might have an impact on economic growth.
As theory says, heavy regulatory burdens enforce high transaction costs on businesses and likely distort competition (and subsequently lower efficiency) by adding entry barriers in certain industries, perhaps with the aim of shielding certain producer interests (Justesen 2008). Such regulations possibly affect the economic activities thereby growth, significantly. Compared to average, businesses in developing countries experience up to three times burdensome regulations than that of richer countries concerning administrative costs, and up to two times larger bureaucratic delays and procedures (World Bank 2005, p.3). If it is the case, then the economic growth effect more likely to be lowered down substantially in the developing countries due to the rigid business regulations. However, controversy remains regarding the organisation of industrial relations and effect of labour market regulations on economic growth (Calmfors & Driffill 1988; Freeman 1988; De Haan et al. 2006).
Page 9 of 28 policies thereby theoretically tend to corrode the value of redistributing income and savings from receivers to borrowers hence will affect creditors' eagerness to loan money. Likewise, long-standing financial investments may be depressed if inflation generates uncertainty concerning future payoffs (Briault 1995).
2.2.4 Open Markets
Trade freedom defines the absence of barriers, tariff, and non-tariff that affect exports and imports of goods and services. Moreover, there might be no restrictions on the movement of investment capital. In a free economy, firms and individuals would be permitted to make an inflow and outflow of their resources concerning specific activities, locally and globally without any restriction. Similarly, financial freedom stands for the independence of financial sector from government control and interference. National ownership financial institutions such as banks, insurers, and capital markets reduce competition and typically lowers available services’ level. In an ideal financial environment,
there would be a minimum level of government interference, independent central bank’s supervision
and regulation would limit to averting fraud and applying contractual obligations.
International trade is stated to be a noteworthy proximate reason of economic growth (Sachs et al. 1995; Frankel & Romer 1999; Dollar & Kraay 2003; Winters 2004). One typical argument for free trade environment is that it enables countries to specialise in making certain goods comparatively more effective than other countries alongside engaging in mutually favourable exchanges and secure comparative returns from trade (Justesen 2008). Likewise, free trade zones efficiently increase market size for producers allowing utilisation of their comparative advantages in production and eventually leads to a more effective allocation of resources (De Haan et al. 2006). Albeit many trade theory implies that freedom increases economic growth few have questioned the link between trade and economic growth (Rodriguez & Rodrik 2001; Yanikkaya 2003).
3. The Economic Growth-Freedom Nexus: Bangladesh Chapter
3.1 Economic Growth and Bangladesh
Page 10 of 28
Figure 2: (i) Economic Growth of Bangladesh (ii) Economic Freedom in Global & Bangladesh case
Source: TheGlobalEconomy.com (2016) Source: The Heritage Foundation (2016b)
As said by IMF, the economy of Bangladesh is the second fastest rising major economy of 2016, with a growth rate of 7.1% (Tribune 2014; Devnath 2016). Bangladesh is the second top garment exporter in the globe, after China (Tribune 2014) and holds a second largest position in the subcontinent regarding financial sector development. With significant reserves of natural gas, Bangladesh becomes Asia's seventh largest gas producer (Akram 2016). Due to many reasons including offering maritime access for landlocked regions and countries, Bangladesh is strategically vital for the economies of India, Nepal, and Bhutan (Chowdhury 2013; Yesmin 2013; Rahmatullah 2013). China also sees Bangladesh as a promising doorway for its non-coastal south-west areas including Tibet, Sichuan and Yunnan (Akram 2016).
3.2 Economic Freedom and Bangladesh
We call an economy is freer while government intervention is little to the markets and individuals, which makes an individual or market to be able to make the transactions that are protected and enforceable. As illustrate by Gwartney et al. (2015)that “Individuals have economic freedom, when
(a) property they acquire without the use of force, fraud, or theft is protected from physical invasions by others and (b) they are free to use, exchange, or give away their property as long as their actions do
not violate the identical rights of others.”
[image:11.595.69.530.89.235.2]Page 11 of 28 accountability. As seen in Figure 2 (ii), the overall score of world economic freedom is 60.4%10 while
Bangladesh managed to secure a percentage of 53.9, pretty closer to the world average.
As Rahman (2015) states, lack of a state consensus relating to the direction of forthcoming policy changes has reduced the momentum for economic improvements, and weakening prospects for near-term developments in economic freedom make it improbable that the comparatively high growth rates of recent years can preserve. Heritage Foundation’s Index states that “countries with higher levels of economic freedom substantially outperform others in economic growth, per-capita incomes, health care, education, protection of the environment, reduction of poverty and overall well-being”, he added.
4. Literature Review
Many studies have been conducted defining the effect of economic freedom on economic growth, before. In 1776, Adam Smith well-documented the link between growth and economic freedom in his influential work namely The Wealth of Nations (Wu 2011).Afterwards, Rabushka (1979) investigate economic freedom, probably for the first time, taking Singapore as a study area. Besides, Scully and Slottje (1991) established a relationship between economic freedom and economic growth employing an economic freedom index and possibly, it was the first study of its kind. However, Index developed by Fraser Institute has been studied previously by Gwartney & Lawson (2003), De Haan & Sturm (2000), Carlsson & Lundström (2002), Dawson (2003) and Vega-Gordillo & Álvarez-Arce (2003). Conversely, the Heritage Foundation’s Index tested by Heckelman (2000), O'Driscoll et al. (2001), Wu (2011), Seputiene & Skuncikiene (2011), Bashir & Xu (2014), Tiwari (2011), and some others. However, Heckelman & Stroup (2000) uses both the indexes for a single study.
Former studies have employed numerous indicators of economic freedom examining the relationship between economic freedom and growth. For example, measuring government falsifications of markets more generally, Barro (1994) used the black market premium on foreign exchange as a proxy, and the results suggest that markets’ distortions are adversative for economic growth. Alesina et al. (1997) employed supplementary variables on the risk of expropriation, corruption, the rule of law and repudiation of contracts as well as the black premium. All the variables usually distress economic growth. However, studies like De Haan & Sturm (2000) employed direct indicators of economic freedom such as international trade, taxes, black market, international capital flow, government intervention, banking, monetary policy and inflation, price controls and regulations and market entry. That study concludes that higher economic freedom nurtures economic growth.
De Haan (2003) documented that yet most of the papers finds a relation between economic freedom and growth, but this relation is not wholly robust in all studies. Some studies suggest that the findings
Page 12 of 28 remain unsettled to some extent. Carlsson & Lundström(2002), for example, documented that the link between economic freedom and growth rely upon greatly on what elements of economic freedom tested. He finds that property rights’ level is a vital cause of economic growth but does not observe any significant causal relationship between taxation, trade policies, and government intervention, and economic growth. Using the same Granger-causality tests, Justesen (2008) also finds economic freedom regarding government size and regulatory policies components have vigorous, positive influences on economic growth, while other components of freedom do not.
However, in studies on causality, Farr et al. (1998) examined the relationship between economic freedom and the GDP level (a proxy for economic growth) and found that the causality between the two goes both ways. Heckelman (2000)also tests Granger causality using Heritage Foundation’s Index and found that level of and change in international trade seems to be autonomous to economic growth. However, the results also suggest that the level of and change in government size is to be Granger-caused by economic growth, rather than a cause of economic growth. Demonstrating the economic freedom level, Dawson (2003) finds Granger-causes economic growth whereas the relationship amongst the change in economic freedom and economic growth is a bi-directional causal.
Likewise, many studies are likely to find the change in economic freedom is substantially related to economic growth than that of the level of freedom (De Haan et al. 2006; Ashby & Sobel 2008; Carlsson & Lundström 2002). Justesen (2008) states that although some studies specifically highlighted a positive correlation can recognise amid economic growth and a collective measure of economic freedom. It does not portray whether some factors of economic freedom is substantial to economic growth compared to others, or, whether all factors of economic freedom drives growth in the identical direction. Thus, studies of compounded measures of economic freedom do not offer much perception regarding a detailed exposure of the freedom–growth relationship, as he mentioned.
Page 13 of 28 The prior studies have used cross-country datasets to study the effects of economic freedom on economic growth and documented mixed results. So far, to the best of the knowledge of the authors, no single study has been conducted with the primary focus on Bangladesh. Therefore, complementing earlier literature with a good reason to visit the relationship between economic freedom and growth, this paper humbly attempt to address the case of Bangladesh.
5. Data and Methodology
5.1. Determinants of Economic Growth and Freedom, and Variable Selection
Many studies commonly used GDP Growth rate as a means of economic growth. Among them the study of Abid et al. (2016), Wu (2011),Pattanaik & Nayak (2014), and Razmi & Refaei (2013) are mentionable. Following those studies, this paper aimed to employ GDP growth rate as a proxy for economic growth. In former days, the economic freedom index developed by Fraser Institute was mostly used by many (Easton & Walker 1997; Gwartney et al. 1999; Bengoa & Sanchez-Robles 2003; Carlsson & Lundström 2002; Doucouliagos & Ulubasoglu 2006; De Haan & Siermann 1998; Justesen 2008).
However, it seems that the trend has changed thus most of the current studies (for example, Wu 2011; Seputiene & Skuncikiene 2011; Bashir & Xu 2014; Tiwari 2011; Heckelman & Stroup 2000) depends on Index of Economic Freedom developed by Heritage Foundation with a partnership with The Wall Street Journal. Also, the economists of Bangladesh have an augmented interest over yearly economic freedom status coming from Heritage Foundation. Hence, this paper tends to use that source defining economic freedom. Besides, following the study of Pattanaik & Nayak (2014),Wu (2011) andBengoa & Sanchez-Robles (2003), the inflation rate is considered as a control variable. As Masih et al. (2009) took real interest rate as a control variable studying causality between financial development and economic growth, the paper aims to follow so adding a control variable.
5.2 Data
This paper considers the relationship between economic freedom and economic growth for Bangladesh using a non-seasonally adjusted annual data for the period of 1995 – 2015, as per the availability of the economic freedom data. All variables are sourced from World Development Indicators (WDI) of World Bank whereas the economic freedom data collected from Heritage Foundation. As a proxy for economic growth, the annual GDP growth rate (GDPG)11 with weighted average aggregation method
used.
11 Annual percentage growth rate of GDP at market prices based on constant local currency. Aggregates are based on constant 2010
Page 14 of 28
For the economic freedom variable, Heritage Foundation’s aggregate Index of Economic Freedom
(EF)12 employed which is measured on a scale from 0 to 100. Both the inflation (INF) and real interest
rate (RIR) included in the model as control variables. Here, inflation measured by GDP Deflator13
(annual %) calculated by median aggregation method. Finally, real interest rate14 stands for real
Lending interest rate (%) adjusted for inflation. All data are in a percentage except for Index of Economic Freedom which is in a scale form. Therefore, to have a uniformity with other variables, data of aggregate Index of Economic Freedom has been transformed into natural logarithm form.
5.3 Method and Model Specification
We employed Auto-Regressive Distributive Lag (ARDL) method (also known as the bounds testing approach) proposed by Pesaran et al. (2001) which is free from the limitations of the unit root and cointegration tests. This approach does not necessitate the restriction imposed by cointegration technique that the variables are I(1) or I(0). Moreover, it even used for a shorter time series observations. For example, Pattichis (1999) applied ARDL bounds test with 20 observations while studies of Mah(2000) and Tang & Nair (2002)had observations of 18 and 28 respectively. Moreover, the bounds testing approach can be applied even if the explanatory variables are endogenous (Alam & Quazi 2003). Hence, for this analysis, we used ARDL method because of its robustness and due to having a small sample size of 21 observations with a mixture of I(1) and I(0) variables.
The ARDL technique consists of two stages. Firstly, the existence of a long-run relationship between variables is tested using F test which conducted by formulating an unrestricted error correction model (ECM) with each variable in sequence as a dependent variable. Using variable addition test, we test whether the ‘lagged levels of the variables’ in each of the error correction equations are statistically significant (i.e., whether the null of ‘no long run relationship’ is accepted or rejected). The second stage involves the estimation of the long-run coefficients based on the optimum order of the variables. These estimations can be done using AIC or SBC criteria. However, we preferred SBC over AIC15
subsidies not included in the value of the products. It is calculated without making deductions for depreciation of fabricated assets or for depletion and degradation of natural resources (DataStream Definitions).
12 The Index covers 10 freedoms: property rights, freedom from corruption, fiscal freedom, government spending, business
freedom, labour freedom, monetary freedom, trade freedom, investment freedom and financial freedom. Each of the ten economic freedoms within these categories is graded on a scale of 0 to 100. A country’s overall score is derived by averaging these ten
economic freedoms, with equal weight being given to each. Based on its aggregate score, each country graded in the Index is
classified as “free” (combined scores of 80 or higher), “mostly free” (70-79.9), “moderately free” (60-69.9), “mostly unfree” (50-
59.9) and “repressed” (under 50) (Heritage Foundation Definitions).
13 Inflation, as measured by the annual growth rate of the GDP implicit deflator, shows the rate of price change in the economy as
a whole. The GDP implicit deflator is the ratio of GDP in current local currency to GDP in constant local currency (DataStream Definitions).
14 Real interest rate is the lending interest rate adjusted for inflation as measured by the GDP deflator. The terms and conditions
attached to lending rates differ by country, however, limiting their comparability (DataStream Definitions).
Page 15 of 28 criterion for all estimations. Next, the associated error correction model is estimated to obtain the speed of adjustment and identify whether variables are endogenous or exogenous. The base equation follows:
GDPG = ∫ (EF, INF, RIR)
Where GDPG denotes annual GDP growth rate, EF stands for Economic Freedom, INF is for inflation (control variable), and RIR represents real interest rate (control variable). The functional relationship between GDP growth rate (GDPG), Index of Economic Freedom (EF), inflation (INF) and real interest rate (RIR) can be estimated using ARDL approach with the following specification (µ is the error term, and “D” shows the differenced form of the variables):
𝐷𝐺𝐷𝑃𝐺𝑡= 𝛼0+ ∑ 𝛽1𝐷𝐺𝐷𝑃𝐺𝑡−𝑖
𝑘
𝑖=1
+ ∑ 𝛽2𝐷𝐸𝐹𝑡−𝑖
𝑘
𝑖=0
+ ∑ 𝛽3𝐷𝐼𝑁𝐹𝑡−𝑖
𝑘
𝑖=0
+ ∑ 𝛽4𝐷𝑅𝐼𝑅𝑡−𝑖
𝑘
𝑖=0
+ 𝛽5𝐺𝐷𝑃𝐺𝑡−1
+ 𝛽6𝐸𝐹𝑡−1+ 𝛽7𝐼𝑁𝐹𝑡−1+ 𝛽8𝑅𝐼𝑅𝑡−1+ 𝜇𝑡
6. Results
6.1 Descriptive Results
Table 1: (i) Plot Graph (ii) Descriptive Statistics
Variable(s) GDPG LEF INF RIR
Mean 5.5552 3.9116 6.3338 6.1043 Std. Deviation 0.8802 0.0691 3.3221 2.8723 Minimum 3.8300 3.7111 3.2600 -4.3200 Maximum 7.0600 3.9908 19.1400 9.8300 Skewness -0.0318 -1.3462 2.7935 -2.1444 Kurtosis-3 -1.0048 1.6097 8.7342 6.4758 Coef. of Variation 0.1585 0.0177 0.5245 0.4705
The plot graph in Table 1 (i) illustrates the dynamics of the original variables which are in percent
form except for Index of Economic Freedom (EF) which located on the secondary Y axis. Despite moving in opposite directions of both inflation (INF) and real interest rate (RIR) at the beginning, they tend to have soothed states over time. The time trending behaviour of line graphs may suggest a long-run relationship among the variables.
The Table 1 (ii) above presents the descriptive statistics of the variables used in our analysis.
[image:16.595.65.532.374.511.2]Page 16 of 28 two-thirds of the observations will fall within one Standard Deviation of the mean (0.635 to 0.767), and 95% will be within two Standard Deviations of the mean. The skewness of GDPG is -.0318, which denotes that the distribution has a slightly negative skew, and the kurtosis of GDPG is -1.0048, which is reasonably lower compared with 3.0 for a normal distribution. In contrast, the skewness of INF illustrates a positive skew of the distribution while the skewness of both EF and RIR shows that the distributions negatively skewed for them. Finally, the kurtosis of INF and RIR are far above of normal distribution. However, it is only 1.6097 for EF which is below normal distribution.
6.2 Empirical Results
We will be testing whether economic freedom has any impact on economic growth in Bangladesh
perspective using 21 years’ annual data and employing ARDL approach to cointegration tests. For ARDL to give robust results, the underlying variables can be either I(0) or I (1) but not I(2) or above. Therefore, we test the variables using unit root tests such as ADF, PP, and KPSS16. Many consider
SBC as a reliable approach17 compared to the AIC thus we will be reporting only the SBC approach
throughout the paper.
Table 2: Unit Root Test
ADF PP KPSS
Variable T-Stat. C.V. Result T-Stat. C.V. Result T-Stat. C.V. Result
L
ev
el
Fo
rm GDPG -1.8379 -6.144 NS -2.4311 -3.677 NS 0.27167 0.321 S
LEF -1.873 -4.122 NS -4.2344 -3.677 S 0.20388 0.321 S INF -0.2455 -3.934 NS -3.662 -3.677 NS 0.19586 0.321 S RIR -1.4911 -3.934 NS -4.3238 -3.677 S 0.22203 0.321 S
1s
t D
if
f.
Fo
rm DGDPG -1.8692 -4.558 NS -5.2735 -2.976 S 0.19971 0.392 S
DEF -3.2711 -3.189 S -9.8777 -2.976 S 0.22968 0.392 S DINF -2.0415 -3.512 NS -8.3901 -2.976 S 0.19094 0.392 S DRIR -2.5382 -2.3934 S -9.3582 -2.976 S 0.21626 0.392 S
Notes: (1) NS denotes Non-Stationary and S stands for Stationary. (2) For ADF test, SBC criterion presented here.
As shown in Table 2, unit root tests offer mixed results. While ADF reports all the level form variables
as Non-Stationary, KPPS suggests those as Stationary and PP also say the same except for GDPG and INF. After taking first differences of variables, both GDPG and INF becomes stationary in PP while ADF reports those as Non-Stationary. Considering PP as a robust test as it corrects both the autocorrelation and heteroscedasticity problems by using the Newey-West adjusted-variance method, we tend to follow the PP reports defining stationarity. We end up with the result that GDPG and INF are I(1), and rest two variables are I(0). Hence, we can use ARDL bound test approach for further analysis.
Page 17 of 28
Table 3: The Bounds Test for the Existence of a Level Relationship
Model/Panel F-Stat. [Prob.] Result I(0): 95% L. B. I(1): 95% U. B.
F (GDPG | LEF, INF, RIR) 1.0155 [.480] No Conintegraton 2.85 4.049 F (LEF | GDPG, INF, RIR) .78426 [.581] No Conintegraton 2.85 4.049 F (INF | GDPG, LEF, RIR) 4.9666 [.054] Conintegraton 2.85 4.049 F (RIR | GDPG, LEF, INF) 2.0322 [.228] No Conintegraton 2.85 4.049
Notes: (1) P-values are in the Brackets. (2) ARDL approach based on SBC Criterion.
Moving forward with the test of theexistence of acointegration that means a long-run relationship
between variables. Pesaran et al. (2001) note that under the null hypothesis of no cointegration, the asymptotic distribution of the test statistic is non-standard. Thus, they tabulate two critical values sets for the cases when the variables are all stationary and all non-stationary. In our context, we may conclude favouring cointegration among the variables irrespective of whether stationary or not if the apparent test statistic exceeds the upper critical bound. The Table 3 suggests that only the model 3 of F (INF | GDPG, LEF, RIR) succeeds to get a cointegration as its F-statistics (4.967) crosses the upper bound of 95% critical bound of 4.049. The significance level (5.4%) is quite interesting as it is slightly higher than 5%, however, at 10% it passes the test. So, the result suggests a long-term relationship exists among inflation and other variables namely GDP growth rate, economic freedom and real interest rate.
Table 4: Diagnostic Tests
Panel 1 Panel 2 Panel 3 Panel 4
Dependent Variable GDPG LEF INF RIR
Diagnostic Tests LM Ver. F Ver. LM Ver. F Ver. LM Ver. F Ver. LM Ver. F Ver. Serial Correlation18 0.0094 0.0061 0.0775 0.0545 0.0781 .047046 .25222 .15327
[.923] [.939] [.781] [.819] [.780] [.832] [.616] [.702] Functional Form19 0.9728 0.6646 0.3220 0.2291 5.798** 4.8991** 1.2500 .80003
[.324] [.430] [.570] [.640] [.016] [.047] [.264] [.389] Normality20 4.9714* N/A 1.7259 N/A 1.6290 N/A 1.8254] NA
[.083] [.422] - [.443] - [.401] -
Heteroscedasticity21 0.3193 0.2920 0.9034 0.8515 0.0166 .014983 .13338 .12084
[.572] [.596] [.342] [.368] [.897] [.904] [.715] [.732]
Notes: (1) P-values are in the Brackets. (2) *** p<0.01, ** p<0.05, * p<0.1. (3) ARDL approach is based on SBC criterion.
Our aim is to employ the diagnostic tests to diagnoses the models. The Table 4 reports that the model
where GDPG is the dependent variable has a normality problem under the significance level of 10% according to LM version of normality test. As our aim is to take 5% significance level for the analysis, we discarded the existence of this problem. However, for the case of Panel 3 (INF is the dependent variable), both LM and F version of diagnostic tests validate that there is a functionality problem as
18 Lagrange multiplier test of residual serial correlation. 19 Ramsey's RESET test using the square of the fitted values. 20 Based on a test of skewness and kurtosis of residuals.
[image:18.595.62.535.435.594.2]Page 18 of 28 per 5% significance level. Hence, we acknowledge this problem for our study for that specific model only. From these diagnostic tests, we can conclude that except Panel 3, all other panels are out of serial correlation, functionality, normality and Heteroscedasticity problems whatsoever.
Table 5 exhibits error correction representation/model (ECM) alongside short-term relationships
among the variables. As seen here, both the inflation and real interest rate have a significant negative effect on GDP growth rate in the short-run with a 95 percent confidence level. We also observed that real interest rate negatively affects the inflation rate and inflation rate also does the same to the real interest rate. In both cases, the significance level is 1%. Nevertheless, in ECM, the coefficient of ecm(-1) (-0.3478) found negatively significant for the case of GDP growth rate model. That means, GDP growth rate possibly will take more than four months for adjustment to come back to the equilibrium from disequilibrium. However, for both the economic freedom and real interest rate cases, the adjustment would take around 5 to 6 months, and this result will be valid if we impose a 10% significance level only.
[image:19.595.64.539.500.691.2]Most significantly, the ECM illustrates that the coefficients of ecm(-1) for both the GDPG and EF are significant with a significance level of 5% and 10% accordingly. That means GDPG and EF are both endogenous (dependent variable) which indicates that there is a bidirectional relationship between GDPG and EF in Bangladesh. Precisely, ecm(-1) captures all the variables of the model in the level form and thus affects the dependent variable. As such, we may say that EF affects the GDPG following the result of Panel 1, while GDPG also affects the EF taking Panel 2 into consideration.
Table 5: Error Correction Representation/Model (ECM)
Panel 1 Panel 2 Panel 3 Panel 4
ARDL (1,1,0,0) (1,0,0,0) (1,1,0,1) (1,1,0,1)
Regressor dGDPG dEF dINF dRIR
dGDPG - -0.0091 -0.2988 -0.2606
- [.594] [.359] [.370]
dLEF 0.0554 - -0.0399 -0.071
[.984] - [.991] [.982]
dINF -0.2844** 0.008 - -.8754***
[.047] [.535] - [.000]
dRIR -0.3916** 0.0015 -1.1017*** -
[.018] [.923] [.000] -
ecm(-1) -0.3478** -.5234* -0.3107 -.4051*
[.045] [.062] [.176] [.096]
Notes: (1) P-values are in the Brackets. (2) *** p<0.01, ** p<0.05, * p<0.1. (3) ARDL approach is based on SBC criterion.
Page 19 of 28 decomposes the variance of a variable regarding the proportion attributable to each variable including its own past. The golden rule is, if one variable is highly reliant on its past lags compared to others, that variable would be the most leading one making others the followers. It may be worth pointing out here that our focused variables are only GDPG and EF for this study.
To sum up, the VECM results tend to suggest that there is a bi-directional relationship existing between economic growth and economic freedom in Bangladesh. This result is fully in line with the study of Carlsson & Lundström (2002), Farr et al. (1998) and Dawson (2003) where they find that the relationship between the change in economic freedom and economic growth is bilateral.
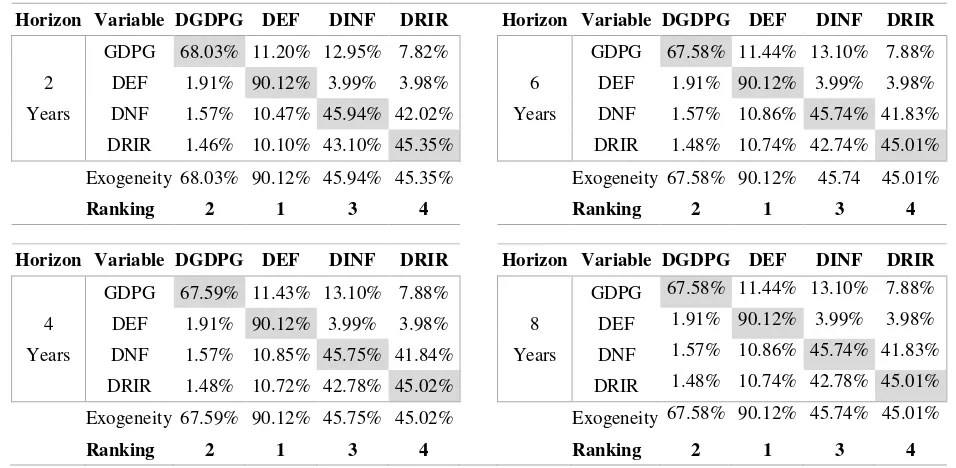
Using Variance Decomposition (VDC), we check the relative exogeneity or endogeneity of a variable
[image:20.595.58.536.340.574.2]over time. The ranking is identified based on the degree of self-dependence of a variable. Next, we are presenting tables with the results from Generalised VDC22 after applying normalisation.
Table 6: Generalized Variance Decomposition
Horizon Variable DGDPG DEF DINF DRIR Horizon Variable DGDPG DEF DINF DRIR
GDPG 68.03% 11.20% 12.95% 7.82% GDPG 67.58% 11.44% 13.10% 7.88% 2 DEF 1.91% 90.12% 3.99% 3.98% 6 DEF 1.91% 90.12% 3.99% 3.98% Years DNF 1.57% 10.47% 45.94% 42.02% Years DNF 1.57% 10.86% 45.74% 41.83%
DRIR 1.46% 10.10% 43.10% 45.35% DRIR 1.48% 10.74% 42.74% 45.01% Exogeneity 68.03% 90.12% 45.94% 45.35% Exogeneity 67.58% 90.12% 45.74 45.01%
Ranking 2 1 3 4 Ranking 2 1 3 4
Horizon Variable DGDPG DEF DINF DRIR Horizon Variable DGDPG DEF DINF DRIR
GDPG 67.59% 11.43% 13.10% 7.88% GDPG 67.58% 11.44% 13.10% 7.88% 4 DEF 1.91% 90.12% 3.99% 3.98% 8 DEF 1.91% 90.12% 3.99% 3.98% Years DNF 1.57% 10.85% 45.75% 41.84% Years DNF 1.57% 10.86% 45.74% 41.83%
DRIR 1.48% 10.72% 42.78% 45.02% DRIR 1.48% 10.74% 42.78% 45.01% Exogeneity 67.59% 90.12% 45.75% 45.02% Exogeneity 67.58% 90.12% 45.74% 45.01%
Ranking 2 1 3 4 Ranking 2 1 3 4
From the Table 6 presented above, we can see that in all selected horizons, economic freedom appears to be the most exogenous. VDC illustrates that economic freedom will be 90.12% dependent on its own past lag in all the selected horizons. The result supports the findings of De Haan & Sturm (2000), Ashby & Sobel (2008), De Haan (2001), Vega-Gordillo & Álvarez-Arce (2003) as they documented that economic freedom has a noteworthy causal impact on economic growth. Moreover, Carlsson & Lundström (2002), De Haan et al. (2006) and Ashby & Sobel (2008) also documented that the change in economic freedom is substantially related to economic growth. One justification would be that
22 Orthogonalized VDC depends on the particular ordering of the variables in the VAR, and assumes that when a particular variable
Page 20 of 28 economic freedom is expected to influence the incentive structure where investors, economic agents, and producers play around, it is most likely to have an impact on wealth and poverty and hence economic growth. The ranking status of GDP growth rate, inflation, and real interest rate is expected to remain constant throughout the selected horizons making these variables relatively followers.
6.3 Robustness and Stability Test
[image:21.595.65.532.326.613.2]To test the robustness of our findings, we run additional time series techniques such as Impulse Response Functions (IRFs). Hence, it may help the regulatory bodies to formulate or upgrade their economic policies and strategies in Bangladesh making those more versatile. Since both the economic growth and the economic freedom surely have an impact, whether direct or indirect, collectively or individually over the economy, the policy makers, economists and the government may get benefitted observing our findings.
Figure 3: Impulse Response Functions
We have examined the short-run dynamics of the variables using generalised Impulse Response
Functions (IRFs) that investigate the response of others using “shocking” one variable at various time
horizons23. Results presented in Figure 3. It is eminent that after having a shock from a variable, all the
variables stabilise within four years of time except for economic freedom. A shock in economic freedom makes other variables volatile for around six years changing the whole momentum. The shock in economic freedom destabilises all the variables and takes more time to adjust, but it seems that
23 Generalized IRFs do not rely on the ordering of the variables in the VAR system thus more robust than the Orthogonalized one.
-0.6 -0.4 -0.2 0.0 0.2 0.4 0.6 0.8
0 2 4 6 7
Generalised Impulse Responses to one SE shock for DGDPG
DGDPG DEF DINF DRIR
-1.5 -1.0 -0.5 0.0 0.5 1.0
0 2 4 6 7
Generalised Impulse Responses to one SE shock for DEF
DGDPG DEF DINF DRIR
-3 -2 -1 0 1 2 3
0 2 4 6 7
Generalised Impulse Responses to one SE shock for DINF
DGDPG DEF DINF DRIR
-3 -2 -1 0 1 2 3
0 2 4 6 7
Generalised Impulse Responses to one SE shock for DRIR
Page 21 of 28 economic freedom is not affected by the shock(s) coming from other variables. Therefore, we could state that economic freedom might be the dominant “leader” which we have witnessed before using VDC.
Furthermore, a shock in both the inflation and real interest rate exhibits almost same picture for all three variables. That means, the shock coming from inflation and real interest rate seems less influential and allows other variables to adjust promptly, say, in less than three years. However, a shock in GDP growth rate pushes real interest rate up while the same shock affects inflation in an opposite way. However, both inflation and real interest rate take the quite similar time to get back to the equilibrium from disequilibrium. Interestingly, a shock in economic growth seems to have no impact on the economic freedom meaning that economic freedom would remain unaffected by the shock of the economic growth in the long run. Probably, we have found a reasonable justification for this finding in the earlier stage, namely VDC that economic freedom is the most leading variable thus its shock is resilient.
[image:22.595.67.527.546.665.2]The IRFs also reveal that a shock in economic freedom and real interest rate affect GDP growth rate positively whereas inflation does so negatively. However, the effect of economic freedom on GDP growth rate seems much higher compared to the influence of real interest rate and inflation. This result again validates the earlier finding what we witnessed on VDC. So, economic freedom is anticipated to show the most resilient position against the shock(s) among all as it is getting back to the equilibrium immediately afterwards having a variable-specific shock(s) which is the usual nature of the most leading variable. Hence, the results imply that the policy makers should pursue the economic freedom (liberalisation) for the sustainable development of the country.
Figure 4: Stability Test using CUSUM and CUSUMSQ Tests
This study so far employed diagnostic tests in Table 4 using ECM and then a robustness check (IRFs) that presented in Figure 3. Almost all tests reveal that this study could be a reliable one as all panels (except for Panel 3) showed that the variables are fairly free from problems of autocorrelation, functional form, normality, and heteroscedasticity. Point to be noted is that we are focusing mainly on Panel 1. However, Pesaran(1997) states that the cumulative sum of recursive residuals (CUSUM) and
-20 -10 0 10 20
1997 2002 2007 2012 2015
The straight lines represent critical bounds at 5% significance level
Plot of Cumulative Sum of Recursive Residuals
-0.5 0.0 0.5 1.0 1.5
1997 2002 2007 2012 2015
The straight lines represent critical bounds at 5% significance level
Page 22 of 28 CUSUM square (CUSUMSQ) could be applied to the residuals of the estimated error correction
models testing parameter constancy. The existence of cointegration does not necessarily infer that the estimated coefficients are stable, and if the coefficients are unstable, the results will be unreliable.
Therefore, we have run a stability test to check the stability of the coefficients of our main model (Panel
1 presented in Table 5) using CUSUM and CUSUMSQ tests. The results in Figure 4 from both the CUSUM and CUSUMSQ tests indicate that the coefficients are all stable as they are within the critical bounds at 5% significance level. Besides, the significance of CUSUM and CUSUMSQ test with this study is to check whether there any structural changes taking place due to crises. Moreover, the figures above illustrate that the crisis has not resulted in any instability in the coefficients of the variables in the study. As the stability tests state that coefficients of the variables quite are stable to proceed, one might get the further confidence to draw a conclusion from this study.
7. Conclusions and Policy Implications
Since the beginning of the development of economics, economic freedom has been treated as a basic characteristic of an economic entity, while the growth of an economy is an integral part. The aim of this study was to investigate the relationships between economic freedom and economic growth in the context of Bangladesh. The main finding of the paper is that economic freedom tends to lead economic growth significantly in the case of Bangladesh. The observed result opposes the real-life scenario of Bangladesh which is, despite a drop down in the points of economic freedom in 2015, the growth of Bangladesh economy continues to rise.
Therefore, the result can explain by the fact that although economic freedom appears to be a relative
“leader”, there might be other factors that might have affected economic growth of Bangladesh to have a better economic success. It also expected that economic freedom would continue to lead economic growth significantly, in the foreseeable future in Bangladesh as suggested by VDC. This state might come true once many of the citizens will be aware of the underlying mechanisms of economic freedom and then will try to fit in within that framework.
Page 23 of 28 tests indicate that the coefficients are all stable and there is no structural break. Meaning that the results inherited from our focused model appear to be reliable.
To draw a line between policy implications and our findings, we infer that the identification of economic freedom-growth Nexus is crucially significant for social welfare and economic development of Bangladesh. While many studies established a positive and statistically significant relationship between economic freedom and economic growth, we also confirm the same suggesting a positive effect of economic freedom on physical capital and so forth. The findings might be useful for the economists and regulatory bodies formulating robust policies in Bangladesh.
This finding enables us to look at the dominant influence of economic freedom on economic growth in Bangladesh over a time frame which has not been done before, to the best of our knowledge. So, it hoped that this paper would have significant policy implications.
8. Limitations and Probable Future Study
Page 24 of 28
10. Bibliography
Abid, F., Bahloul, S. & Mroua, M., 2016. Financial development and economic growth in MENA countries.
Journal of Policy Modeling, 38(6), pp.1099–1117.
ADB, 2016. Bangladesh: Economy. Asian Development Bank, Bangladesh, November 21, 2016.
Akram, S., 2016. Encouraging growth in a low-growth world. The Financial Express, Op-Ed.
Alam, I. & Quazi, R., 2003. Determinants of capital flight: An econometric case study of Bangladesh.
International Review of Applied Economics, 17(1), pp.85–103.
Alesina, A., Hems, L.C. & Chinnock, K., 1997. The political economy of high and low growth. Washington DC.
Alexandrakis, C. & Livanis, G., 2013. Economic Freedom and Economic Performance in Latin America: A Panel Data Analysis. Review of Development Economics, 17(1), pp.34–48.
Ashby, N.J., Bueno, A. & Martinez, D., 2013. Economic Freedom and Economic Development in the Mexican States. Journal of Regional Analysis & Policy, 43(1), pp.21–33.
Ashby, N.J. & Sobel, R.S., 2008. Income inequality and economic freedom in the US states. Public Choice, 134(3–4), pp.329–346.
Ayal, E.B. & Karras, G., 1998. Components of economic freedom and growth: an empirical study. The
Journal of Developing Areas, 32(3), pp.327–338.
Barro, R.J., 1994. Democracy & Growth, National Bureau of Economic Research.
Barro, R.J., 1997. Determinants of Economic Growth. MIT Press, Cambridge, MA.
Bashir, M.F. & Xu, C., 2014. Impact of Political Freedom , Economic Freedom and Political Stability on Economic Growth. Journal of Economics and Sustainable Development, 5(22), pp.59–68.
Bengoa, M. & Sanchez-Robles, B., 2003. Foreign direct investment, economic freedom and growth: New evidence from Latin America. European Journal of Political Economy, 19(3), pp.529–545.
Berggren, N., 2003. The benefits of economic freedom: a survey. The independent review, 8(2), pp.193– 211.
Berggren, N. & Jordahl, H., 2006. Free to trust: Economic freedom and social capital. Kyklos, 59(2), pp.141–169.
Briault, C., 1995. The costs of inflation. Bank of England Quarterly Bulletin, 35(1), pp.33–45.
Bruno, M. & Easterly, W., 1998. Inflation crises and long-run growth. Journal of Monetary Economics, 41(1), pp.3–26.
Calmfors, L. & Driffill, J., 1988. Bargaining structure, corporatism and macroeconomic performance.
Economic policy, 3(6), pp.13–61.
Carlsson, F. & Lundström, S., 2002. Economic freedom and growth: Decomposing the effects. Public Choice, 112(3–4), pp.335–344.
Chowdhury, K.R., 2013. Mongla seaport to get railway link in 4 years. Dhaka Tribune, p.Development.
Page 25 of 28 in the United States. European Journal of Political Economy, 27(3), pp.423–435.
Dawson, J.W., 2003. Causality in the freedom–growth relationship. European Journal of Political
Economy, 19(3), pp.479–495.
Debroy, B., Bhandari, L. & Aiyar, S.S.A., 2014. Economic freedom of the states of India, 2013, Academic Foundation.
Devnath, A., 2016. Record Exports Seen Rising as Bangladesh Woos U.S. Consumers. Bloomberg Markets
Magazine.
Dollar, D. & Kraay, A., 2003. Institutions, trade, and growth. Journal of monetary economics, 50(1), pp.133–162.
Doucouliagos, C. & Ulubasoglu, M.A., 2006. Economic freedom and economic growth: Does specification make a difference? European Journal of Political Economy, 22(1), pp.60–81.
Easterly, W. & Levine, R., 1997. Africa’s growth tragedy: policies and ethnic divisions. The Quarterly
Journal of Economics, pp.1203–1250.
Easterly, W. & Rebelo, S., 1993. Fiscal policy and economic growth. Journal of monetary economics, 32(3), pp.417–458.
Easton, S.T. & Walker, M.A., 1997. Income, Growth, and Economic Freedom. The American Economic Review, 87(2), pp.328–332.
Fabro, G. & Aixalá, J., 2012. Direct and Indirect Effects of Economic and Political Freedom on Economic Growth. Journal of Economic Issues, 46(4), pp.1059–1080.
Frankel, J.A. & Romer, D., 1999. Does trade cause growth? American economic review, pp.379–399.
Freeman, R.B., 1988. Labour market institutions and economic performance. Economic policy, 3(6), pp.63– 80.
Gwartney, J.D. & Lawson, R., 2003. The concept and measurement of economic freedom. European
Journal of Political Economy, 19(3), pp.405–430.
Gwartney, J.D., Lawson, R. a & Holcombe, R.G., 1999. Economic freedom and the environment for economic growth. Journal of Institutional and Theoretical Economics, 155(4), pp.643–663.
Gwartney, J.D., Lawson, R. a & Holcombe, R.G., 2011. Economic freedom dataset (Economic Freedom of the World: 2010 Annual Report).
Gwartney, J.D., Lawson, R. a & Holcombe, R.G., 2015. Economic Freedom of the World: 2015 Annual Report.
Gwartney, J.D., Lawson, R. a & Norton, S., 2008. Economic freedom of the world 2008 annual report.
De Haan, J., 2003. Economic freedom: editor’s introduction. European Journal of Political Economy,
19(3), pp.395–403.
De Haan, J., Lundström, S. & Sturm, J.-E., 2006. Market oriented institutions and policies and economic growth: A critical survey. Journal of Economic Surveys, 20(2), pp.157–191.
Page 26 of 28 De Haan, J. & Sturm, J.-E., 2000. On the relationship between economic freedom and economic growth.
European Journal of Political Economy, 16(2), pp.215–241.
Heckelman, J.C., 2000. Economic freedom and economic growth: A short-run causal investigation. Journal
of Applied Economics, 3(1), pp.71–91.
Heckelman, J.C. & Stroup, M.D., 2000. Whcich Economic Freedoms Contribute to Growth? Kyklos, 53(4), pp.527–544.
Heritage Foundation, 2016a. About The Index. Heritage Foundation, p.2016 Index of Economic Freedom. December 2, 2016.
Heritage Foundation, 2016b. Graph the Data. The Heritage Foundation, p.Visualize, November 29, 2016.
Husted, B.W., 1999. Wealth, culture, and corruption. Journal of International Business Studies, 30(2), pp.339–359.
Justesen, M.K., 2008. The effect of economic freedom on growth revisited: New evidence on causality from a panel of countries 1970-1999. European Journal of Political Economy, 24(3), pp.642–660.
Ken Farr, W., Lord, R.A. & Wolfenbarger, J.L., 1998. Economic freedom, political freedom, and economic well-being: a causality analysis. Cato J., 18, p.247.
Kurrild-Klitgaard, P. & Berggren, N., 2004. Economic consequences of constitutions: A theory and survey.
Journal des Economistes et des Etudes Humaines, 14(1).
Mah, J.S., 2000. An empirical examination of the disaggregated import demand of Korea—the case of information technology products. Journal of Asian Economics, 11(2), pp.237–244.
Martin, E., 2012. Goldman Sachs’s MIST Topping BRICs as Smaller Markets Outperform. Bloomberg,
August, 7.
Masih, M., Al-Elg, A. & Madani, H., 2009. Causality between financial development and economic growth: an application of vector error correction and variance decomposition methods to Saudi Arabia.
Applied Economics, 41(13), pp.1691–1699.
Miles, M. et al., 2004. Index of economic freedom, Heritage Books (DC).
North, D.C., 1990. Institutions, institutional change and economic performance, Cambridge university press.
O’Driscoll, G.P., Feulner, E.J. & O’Grady, M.A., 2001. The Index of Economic Freedom, Heritage
Foundation.
Olson, M., 1996. Distinguished lecture on economics in government: big bills left on the sidewalk: why some nations are rich, and others poor. The Journal of economic perspectives, 10(2), pp.3–24.
Olson, M., 2000. Power and prosperity: Outgrowing communist and capitalist dictatorships: Outgrowing
communist and capitalist dictatorships, Basic books.
Pattanaik, F. & Nayak, N.C., 2014. Economic freedom and economic growth in India: What is the empirical relationship? Economic Change and Restructuring, 47(4), pp.275–298.
Pattichis, C.A., 1999. Price and income elasticities of disaggregated import demand: results from UECMs and an application. Applied Economics, 31(9), pp.1061–1071.
Page 27 of 28 Pesaran, M.H., Shin, Y. & Smith, R.J., 2001. Bounds testing approaches to the analysis of level
relationships. Journal of applied econometrics, 16(3), pp.289–326.
Quadir, S., 2015. Bangladesh, Kenya, Myanmar move up income ranks - World Bank. Reuters, November 30, 2016.
Rabushka, A., 1979. Hong Kong: A study in economic freedom, University of Chicago, Graduate School of Business.
Rahman, F.M., 2015. No progress in economic freedom. The Daily Star.
Rahmatullah, M., 2013. Regional Transport Connectivity: Its current state. The Daily Star.
Razmi, M.J. & Refaei, R., 2013. The Effect of Trade Openness and Economic Freedom on Economic
Growth : the Case of Middle East and East Asian Countries. International Journal of Economics and
Financial Issues, 3(2), pp.376–385.
Rivera-Batiz, L.A. & Romer, P.M., 1990. Economic integration and endogenous growth, National Bureau of Economic Research.
Rodriguez, F. & Rodrik, D., 2001. Trade policy and economic growth: a skeptic’s guide to the cross -national evidence. In NBER Macroeconomics Annual 2000, Volume 15. MIT Press, pp. 261–338.
Romer, P.M., 1986. Increasing returns and long-run growth. The journal of political economy, pp.1002– 1037.
Sachs, J.D. et al., 1995. Economic reform and the process of global integration. Brookings papers on economic activity, 1995(1), pp.1–118.
Scully, G.W. & Slottje, D.J., 1991. Ranking economic liberty across countries. Public Choice, 69(2), pp.121–152.
Seputiene, J. & Skuncikiene, S., 2011. The Relationship Between Economic Development and Economic
Freedom : The Case of Transition Economies. Economics, Management, and Financial Markets, 6(1),
pp.790–799.
Sturm, J.-E. & De Haan, J., 2001. How robust is the relationship between economic freedom and economic growth? Applied Economics, 33(7), pp.839–844.
Tang, T.C. & Nair, M., 2002. A cointegration analysis of Malaysian import demand function: reassessment from the bounds test. Applied Economics Letters, 9(5), pp.293–296.
TheGlobalEconomy.com, 2016. Bangladesh: Economic growth. TheGlobalEconomy.com, p.Countries. November 30, 2016.
Tiwari, A.K., 2011. Foreign aid, FDI, economic freedom and economic growth in asian countries. Global
Economy Journal, 11(3).
Transparency International, 2016. Corruption Perceptions Index (CPI). Transparency International, p.Overview of Corruption Perceptions Index, November 21, 2016.
Transparency International, 2010. CPI: Long Methodological Brief. Transparency International, p.2.
Tribune, D., 2014. Bangladesh world’s 2nd most pro-free market country. Dhaka Tribune, p.Tribune Desk.
Page 28 of 28 Winters, L.A., 2004. Trade liberalisation and economic performance: an overview. The Economic Journal,
114(493), pp.F4–F21.
World Bank, 2005. Doing Business in 2005: Removing obstacles to growth, Washington DC.
Wu, C., 2011. Economic Freedom, Economic Growth, and China. Chinese Economy, 44(5), pp.104–119.
Wu, W. & Davis, O.A., 1999. The two freedoms, economic growth and development: an empirical study.
Public Choice, 100, pp.39–64.
Yanikkaya, H., 2003. Trade openness and economic growth: a cross-country empirical investigation.
Journal of Development economics, 72(1), pp.57–89.
Yesmin, S., 2013. Sub-regional connectivity in South Asia: Prospects and challenges. The Financial