Munich Personal RePEc Archive
Investor Sentiment and Stock Returns:
Evidence from the Athens Stock
Exchange
Gizelis, Demetrios and Chowdhury, Shah
Prince Mohammad Bin Fahd University, Prince Mohammad Bin
Fahd University
May 2016
Online at
https://mpra.ub.uni-muenchen.de/71243/
Investor Sentiment and Stock Returns: Evidence from the Athens
Stock Exchange
Demetrios James Gizelis Shah Saeed Hassan Chowdhury
Abstract
A plethora of academic research has been under way investigating the effect of individual
investor sentiment on stock returns. It seems that the issue is not resolved yet because the
empirical findings are not entirely conclusive. Most authors argue that there is a place for
sentiment as a determining factor in the stock return generating process while several others find
that it is exactly the opposite. This paper aims at contributing to the existing debate by examining
the relationship between investor sentiment and stock market returns of firms listed in the Athens
Stock Exchange. We employ two investor sentiment proxies, a direct and an indirect. As the
direct measurement of sentiment we use the historical investor sentiment indicators compiled by
the European Commission, and for the indirect one we resort to the closed-end equity fund
discount/premium. Using monthly data for the period January 1995 to April 2014 the regression
results indicate that investor sentiment weakly explains returns. Because this type of risk is not
diversifiable, for practical purposes somehow it ought to be priced. Thus, it appears that
behavioral factors may be considered in empirical asset pricing models for the Greek market.
Keywords: Investor sentiment, Greek stock market, Return predictability
I. Introduction
In neoclassical finance theory there is typically no place for investor sentiment because, it is
argued, share valuation reflects only fundamentals and nothing else. From its inception
away, on the grounds that in perfectly competitive financial markets irrational trading behavior
will be quickly washed away. The tenets on which this conclusion is drawn are: firstly, financial
markets are informationally efficient and secondly, market participants are rational.
The requirement of market efficiency, therefore, becomes one of the two foundations of modern
financial economics and its presence guarantees that in equilibrium asset prices embody all
available information regarding the fundamental value of the underlying security. In the absence
of market frictions, then, the price of marketable securities is equal to their intrinsic value, which
is defined as the sum of present value of all expected cash flows. Thus, in an efficient market
security prices instantaneously reflect all relevant information and this makes prediction of future
prices based on past and present information futile, because they just follow a random walk.1
The second foundation of modern financial theory is the assertion that individual investors
behave rationally, which implies that in their decision making calculus they take into
consideration and rely on all available relevant information they have access to. Rationality in
financial markets is based on the hypothesis of rational expectations found in economic theory,
which states that the predictions of economic agents regarding the future value of an asset are not
systematically biased, that is, errors are not correlated.2
Introducing in the model the additional factors of investors pursuing their own self-interest and
the forces of arbitrage, classical financial theory formulates its final argument that irrational
participants will be quickly expelled from the market and with them the opportunities of making
1 This pattern of security prices movement is postulated by the Efficient Market Hypothesis (EMH), which initially was
formalized by Samuelson (1965) and popularized by Fama (1970, 1976).
2
risk-free profits. The issue, however, is that in the real world investors are constrained on their
arbitrage activities due to the fact that financial markets are not frictionless. This is so because in
order to earn risk-free profit professional arbitrageurs must use substantial funds, which means
that this activity automatically is exposed to risk. Moreover, because of the presence of
transaction cost, information gathering cost, and financing cost arbitrageurs become very
skeptical and to a large extent are discouraged from exploiting market mispricing. Therefore,
arbitrage does not necessarily operate toward eliminating market anomalies (Shleifer and
Vishny, 1997).
The persistent presence of security mispricing and unexploited arbitrage opportunities, which are
manifested in financial puzzles such as the closed-end fund discount, January Anomaly, the
weekend effect, and IPO underpricing as well as the periodic occurrence of financial crises has
led a group of theorists to search for alternative explanations for these market anomalies. One
approach is resorting to non-economic factors, such as investor behavior, that bypass the strict
rationality assumption and the presence of arbitrage of the conventional finance paradigm. More
specifically, this practice has been advocated by proponents of behavioral finance, who posit that
some market participants may exhibit irrational characteristics and through their conduct could
affect market outcome, asset prices, and possibly the conduct of other investors. In this
framework, investor sentiment becomes a key factor that can explain the presence of market
distortions, such as limited arbitrage, which make asset prices diverge from equilibrium.
Proponents of behavioral finance have advocated that in real markets arbitrageurs are also
exposure for all participants, and therefore they (arbitrageurs) are not willing to expose
themselves to excessive non-diversifiable risks. These noise traders are usually small individual
investors with minimum or without any investment training and hence their behavior is not
necessarily rational, because in essence their decisions are made on rumors and not on
fundamentals. A further complication arises due to the fact that noise trading is strongly
correlated and creates what has been coined as herd behavior3. Because noise traders’
expectations about asset returns are sensitive to fluctuations in the same sentiment they have the
tendency to overreact or underreact in tandem, their trades are not randomly distributed across
assets and thus confuse arbitrageurs with their irrational conduct (De Long et al., 1990, 1991).
As opposed to the traditional view that stock return co-movements can result either by changes
in expected cash flows or the discount rate, the noise trader model postulates that synchronous
investment activities of unpredictable noise traders would also produce correlated returns.
Consequently, to the extent that sentiment gives rise to herd behavior of noise traders, this
sentiment becomes an additional explanatory variable in the return generating process of tradable
financial assets. In the case of stock prices, the implication of this reasoning is that, besides the
usual risk factors and macroeconomic variables, the investment activities of both rational
sophisticated arbitrageurs and irrational naive noise traders will determine market outcome4.
3 John Maynard Keynes in his masterpiece the General Theory of Employment, Interest and Money used the phrase “animal
spirits” to describe the instincts, propensities and emotions that systematically influence and guide human behavior, and which can be manifested in terms of investor sentiment.
4
However, with regard to investor sentiment researchers do not agree on a commonly accepted
definition. In the relevant literature we find a long list of such definitions, ranging from clouded
statements about investors’ perceptions to unique psychological biases, which are model
specific. The picture becomes even more opaque when considering the different ways this term
has been employed by academic researchers, professional practitioners, and the media (Barberis
et al., 1998; Daniel et al., 2002; Welch and Qiu, 2004; Cliff and Brown, 2004; Baker and
Wurgler, 2007; Shefrin, 2008). Specifically, some scholars view investor sentiment as the
tendency to trade on rumors rather than market information while the investment community
may use it less formally to indicate periods of euphoria or phobia.
For the purposes of this paper, investor sentiment is defined as the propensity of market
participants to speculate, and this attitude can be related to the psychological state of mind of
investors. Thus, it is argued that during market upswings it is euphoria that pushes irrational
investors to be lax in their investment strategies, whereas during corrections they base their
investment decisions on a wider spectrum of considerations and more careful analyses (Schwarz,
2002). In the same spirit, Dellavigna and Pollet (2009) assert that investors become less attentive
in good times, which leads to mispricing of stocks. In addition, Brown and Cliff (2004) describe
sentiment as the expectation of market participants relative to a norm, according to which the
average investor is a zero sentiment person whereas a bullish (bearish) investor expects higher
(lower) returns than this norm5.
5
The former Federal Reserve System chairman Alan Greenspan initiated the term “irrational exuberance” to describe the
excessive euphoria in the stock market during the 1990s, and explicitly warn investors of the high risks associated with the
bubble in dotcom stocks. Also, Robert Shiller (2002) blames the presence of sentiment as “irrational exuberance” driving the
As emerging markets are dominated relatively more by individual investors and lack availability
of quality information and professional financial analysts’ services, the performances of these
markets are more likely to be influenced by the sentiment of general investors. Short selling
usually is either not allowed or it is very shallow in many emerging stock markets and this is for
all practical purposes the case of the Greek market as well.6 Hence, as expected, the absence of
the mechanism of short selling makes it difficult for smart investors to respond quickly to any
new information in order to align mispriced stocks. Despite the high possibility of presence of
sentiment in the Greek capital market, there are only a couple of published papers dealing with
the effect of sentiment. Thus, this paper investigates the performance of the Greek stock market
primarily from behavioral perspective by introducing sentiment factors in the empirical asset
pricing models. Based on the above discussion, we believe that the impact of sentiment is an
important research issue for the Greek market and hence the paper contributes to the
understanding of the operation of this market.
We formalize our investigation on the significance of sentiment in the Greek market by forming
the following hypotheses:
Hypothesis 1: The Greek stock market with its periphery attributes is expected to be relatively
more prone to investor sentiment influence, in line with other less developed markets.
Hypothesis 2: Of the two complete stock market activity cycles that were recorded over the last
twenty five years, we postulate that the former is characterized by stronger sentiment influence
6
than the latter. This belief stems from the observable fact that during the first cycle the number
of immature and unsophisticated market participants was much larger than in the second cycle.
In other words, because so many “investors” were forcefully stripped off their wealth when the
market collapsed in 1999 they wouldn’t dare repeat the same mistake twice.
Hypothesis 3: For both cycles, the upswing phase is expected to exhibit stronger sentiment
influence than the downswing.
The rest of the paper proceeds as follows. Section II presents an overview of the relevant
literature on sentiment as determinant of stock returns. In section III we discuss the main
characteristics of the Greek stock market, the evolutionary historical developments that have
shaped it through the past quarter of a century, and its relative performance over the last two
major activity cycles of “boom and bust”. Section IV describes in detail the sources of data used
in our analyses and the rational of using the information contained therein. We also discuss the
research methodology used in the study. In section V we present the analysis of the results of our
empirical investigation. In section VI we conclude the paper.
II. Literature Review
The long debate among finance theorists and researchers on whether sentiment influences stock
prices is still to a large extent not resolved. Black (1986) introduces the concept of noise trading
and explains how irrational investors guided by sentiment distort market outcomes. Trueman
(1988) extents Black’s point further and explains why an investor would rationally opt to trade
on noise. De Long et al. (1990) develop a model where noise traders acting in concert can
disequilibria, which implies that sentiment is priced. Schleifer and Summers (1990) challenge
the efficient market paradigm by showing that the assumption of limited arbitrage in financial
markets is more plausible than the one of perfect arbitrage. Shefrin and Statman (1994) extend
the CAPM by allowing noise trading to interact with rational information trading and show that
noise traders act as a second driver, which destabilizes financial markets and pushes stock prices
away from their equilibrium value.
On the other hand, some researchers argue in favor of the EMH, in the sense that investor
sentiment does not qualify as a risk factor. Elton et al. (1998) provide evidence against the
proposition that investor sentiment is priced in the U.S. stock market. Doukas and Milonas
(2004) conduct an out of sample analysis in the Greek capital market, which they consider more
likely to be prone to investor sentiment, and do not find supporting evidence for the role of
sentiment in explaining the returns of closed-end funds. In line with Elton et al. they claim that
their findings do not support the hypothesis that investor sentiment represents an independent
and systematic asset pricing risk. Partly in line with these findings, Brown and Cliff (1999) find
weak relationship between sentiment and stock returns, although they report existence of strong
relationship between sentiment and returns of small stocks. Likewise, Leonard and Shull (1996)
investigate the investor sentiment effect on NYSE stocks over the two periods from July 1965 to
April 1980 and again from that date to December 1994. Their findings suggest a dichotomy over
the significance of investor sentiment as a risk factor. Whereas investor sentiment is priced in the
first sub-period, it loses its explanatory power during the second sub-period.
Overall, research in developed economies reveals the existence of a significant relationship
between stock returns and the sentiment of the market (Bhaskaran, 1996; Barberis et al., 1998;
Brown and Cliff, 2004; Baker and Wurgler, 2006, Kumar and Lee, 2006; and several others).
Specifically, Bhaskaran (1996) examines the relation between closed-end fund discounts and
small firm returns and discovers that discounts forecast future small firm returns and also provide
independent information about the conditional expected returns of small firms. In addition, he
finds that discounts forecast only the small firm factor return out of the five factors suggested by
Fama and French (1993). Kumar and Lee (2006) show that the trading activities of retail
investors are highly correlated and explain return co-movements for stocks with high retail
concentration that are difficult to arbitrage, which is consistent with the predictions of the noise
trading model. Beaumont et al. (2008) find that sentiment has a significant and asymmetric effect
on stock returns volatility. Finter et al. (2010) report that an index of market sentiment explains
the spread between the returns of sentiment sensitive stocks and sentiment insulated stocks.
Additionally, they find that stocks that are difficult to arbitrage and evaluate are more sensitive to
market sentiment. Baker et al. (2011) consider both local and global sentiment factors to
investigate the presence of sentiment in six major markets. They report that high sentiment
causes low future returns for relatively difficult to arbitrage and evaluate stocks. Antoniou et al.
(2012) find that higher momentum of returns occurs in higher sentiment periods and such
momentum is absent during pessimistic periods. Finally, Baker and Wurgler (2006) point out
that in case of young firms, extreme growth firms, small firms, and non-dividend-paying firms
the chance of subjective evaluation increases, which leads to susceptibility to market sentiment.
Thus, if the market itself is young, there should be even higher probability of the presence of
Research on a number of emerging markets indicates that sentiment plays a role in explaining
stock returns. To begin with, Aitken (1998) finds that as soon as institutional investors start
investing in emerging economies’ markets stock returns there experience a sharp increase in
autocorrelation. He concludes that the presence of institutional investors’ sentiment in emerging
markets works as a risk factor in the determination of asset prices, resulting in overshooting.
Kling and Gao (2008) show that sentiment influences stock returns in the Chinese stock market.
More precisely, they find that although the mood of investors follows a positive feedback in the
short-run, stock price and investor sentiment do not have a long-run relationship. Institutional
investors are optimistic (pessimistic) when previous market returns are positive (negative). Also,
institutional investors’ sentiment is not found to predict future stock returns. Canbas and Kandir
(2009) investigate the relation between investor sentiment and sock returns on the Istanbul Stock
Exchange, and their results indicate that past stock portfolio returns influence investor sentiment,
while investor sentiment fails to forecast future stock returns.
Zouaoui et al. (2010) use panel data of 15 European and U.S. stock markets and find that
sentiment has more effect on stock returns in those countries where investors are prone to herd
behavior and institutional investment is relatively low. Grigaliuniene and Cibulskiene (2010)
examine the effect of sentiment in Scandinavian markets and report negative relationship
between sentiment and future stock returns. Liu et al. (2011) consider the direct and indirect
effects of sentiment factors on Taiwan stock market returns. Their results indicate that extreme
sentiment indicator plays a critical role in determining changes in market returns. Anusakumar et
Asian stock markets. Their findings indicate the presence of sentiment in these markets and their
result is robust with respect to firm size, trading volume, sample period and other proxies.
Zhuang and Song (2012) examine the relationship between investor sentiment and stock returns
and volatility in the Chinese stock market. They report that investor sentiment has a strong
impact on stock returns in the Chinese stock market. Liston et al. (2012) investigate Dow Jones
Islamic Equity indices to find that bullish shifts in sentiment in current period lower conditional
future volatility. Rehman (2013) gives empirical evidence that stock returns of Karachi Stock
Exchange, a market which primarily consists of retail investors, are also influenced by investor
sentiments. Chowdhury et al. (2014) examine the effect of sentiment on returns in the
Bangladesh stock market and find that high sentiment leads to high contemporaneous returns
followed by downward correction in the next month and this is mainly observed for small size
portfolios. Thus, they conclude that sentiment should be considered as a source of systematic
risk.
Research on the Greek market reveals that it is rather susceptible to investor sentiment, which is
not surprising given that this market does not exactly possess the attributes of a mature capital
market. Having said that, it is expected that stock prices in the Athens Stock Exchange (ASE)
would not follow a random walk and this implies that the market is not informationally efficient.
Dockery and Kavussanos (1995) performed unit root tests over the period 1998 to 1994 using
panel data for a sample of 73 companies listed on the ASE and conclude that the Greek stock
market is inefficient and, therefore, share prices tend to move systematically over time. Niarchos
and Alexakis (1998) investigate the speed of price adjustment between common and preferred
movements of preferred shares tend to follow the price change of common shares. Thus, contrary
to the prediction of the EMH, it is possible to forecast the price movement of preferred shares
based on the information conveyed by price changes of common shares. Patra and Poshakwale
(2006) examine the link between selected macroeconomic variables and stock returns in the
Greek market during the 1990s and find a persistent relationship between inflation, money
supply, trading volume and stock prices. They conclude that the Greek stock market is not
efficient because publically available information regarding macroeconomic variables and
trading volumes can be potentially used to predict future stock prices. Athanasiadis (2010) tests
the weak-form of EMH in the Greek market by using daily closing prices over the period 2000
to 2008 of stocks of two major stock indices, the GI (general index) and the FTSE-20 (large cap).
He reports that whereas shares of the GI do not follow a random walk process, which implies
rejection of the efficient market hypothesis in its weak form, in the case of FTSE-20 shares the
test is inconclusive. In the latter case half of the socks appear to follow a random walk pattern
but the other half does not do that. Alexakis (2011) investigates the stock price movement
between large and small banks in the Athens Stock Exchange, before and during the financial
crisis of 2008-2009 and finds that they exhibit totally different price behavior. That is, big banks
during the financial crisis showed stock price dynamics due to high institutional ownership,
which were affected by correlated negative sentiment or mimicking minimizing loss strategies
irrespective of the quality of the banks’ assets. On the antipode of these findings, Doukas and
Milonas (2004) do not find support for the hypothesis that investor sentiment represents an
III. The Greek Stock Market in Historical Perspective
The Greek economy entered the 1990s burdened with serious macroeconomic imbalances and
significant structural rigidities, mainly as a result of the economic policies implemented during
the previous decades. The 1980s was marked by considerable slowdown in economic activity as
indicated by the modest growth in GDP, which averaged just 1.5% annually for the entire period.
This development is in sharp contrast with the preceding two decades, during which the average
GDP growth was 7% and 5% in the 1960s and 1970s, respectively. Inflation on the contrary rose
continuously and by the end of 1989 it reached approximately twenty percent and this had an
immediate impact on nominal interest rates, which hovered around 25 percent. Most economic
indicators demonstrated a significant deterioration of the economic situation in Greece. The large
government sector and its huge pervasiveness in all aspects of economic activity were
accountable for this gloomy situation. Public sector enterprises losses, which in the early 90s
produced over 60% of output in the industrial and services sector (including financial services),
and excessive government consumption expenditures translated into persistently high deficits in
the national budget, which eventually led to an unsustainable public debt.
The sample period extends from January 1995 until April 2014, covering a period of almost two
decades. We selected the mid-nineties as the starting point because it marks the beginning of a
long bullish market, which is mainly attributed to a number of major transformations of the
Greek economy. These structural changes were the outcome of a strict convergence plan aiming
at fulfilling the Maastricht criteria for joining the European Monetary Union and adopting the
macroeconomic environment unprecedented hitherto and this laid down the foundations for
long-term economic growth.
On the institutional front, during the 1990s the Athens Stock Exchange witnessed a long wave of
modernization characterized by structural changes, innovation, and expansion. These qualitative
changes infused confidence in the investor community that the local stock market was finally
transforming from an emerging market into a serious and trusted venue to place one’s savings,
equivalent to advanced economies. As a result we observe a sharp increase in the number of
financially healthy full-service brokerage firms. Additionally, the Parallel Market was
established in 1990, thus providing an alternative permanent source of funds for small and
medium firms. Also, the Automated Electronic Trading System was adopted, which expedited
the trading orders execution thus ending the 116 years-old tradition of trading with the outmoded
outcry method.
The stock market after a prolong period of hibernation, having overcome a number of
institutional and functional inertia foresaw both successfully and timely the ensuing benefits
stemming from the positive changes taking place in the economy. Consequently, over the
second half of the 1990s the Athens Stock Exchange experienced the greatest upswing phase of
its growth ever, not so much with regard to the increase in the level of its index but in some other
qualitative developments, such as:
By the end of 1999 the number of active accounts of private investors reached 1.5
million, which is the largest number in history.
Market capitalization increased to record high of 150 percent of annual GDP.
The number of foreign institutional investors not only increased manifold but at the same
time they became the most active market participants.
During the year 1999 alone the amount of funds raised by firms in the primary market
reached almost €13 billion. And over the period of 1997 to 2000 approximately €32
billion were raised in the capital market.
Furthermore, right from the start of the year 1997 trading volume gained significant momentum
and as a result sock prices began trending upwards. Both the Government and the positive
international economic climate of that time contributed towards this dynamism. The
Government’s contribution resulted from its realization that capital markets could function as a
conduit in the privatization process, and the latter’s contribution because by 1997 world stock
market activity was already experiencing one of the strongest and prolonged bull euphoria. It
was this time that the former FED chairman Alan Greenspan coined as the period of “irrational
exuberance”. The Greek stock exchange had experienced similar bull market periods in the past,
especially in 1972 and 1990, but this time there was a material qualitative difference. Now stock
investing became a cliché for everyone and all of a sudden it topped everything else in the
evening news. This time the stock euphoria like a giant vacuum absorbed hundreds of thousands
of ordinary households, with no prior investing experience whatsoever, throughout the entire
country from large metropolitan cities to the most remote mountain village.
As a result of this outright irrational exuberance the General Index climaxed on 17 September,
companies in the ASE increased to 279 and the stock market capitalization by the end of 1999
reached almost €200 billion, in comparison to just a little over €7 billion in the beginning of the
decade. At the same time, trading volume also increased many-fold rising to approximately
€175 billion in 1999 compared to a meager €5 billion in 1990. Eventually, the market ran out of
fuel, the pressure on stock prices subsided and by the year 2000 the situation was completely out
of control, mainly because the majority of emerging and a few of the advanced matured markets
were moving deeper into the correction phase of the investing cycle. However, this time the bear
market was short-lived and soon stock activity revived due to the fact that all of the required
institutional and regulatory changes had been completed, and the electronic order execution
systems were upgraded. All these positive developments coupled with Greece’s post-joining the
Eurozone monetary stability contributed to upgrading the Greek stock market to the category of
advanced matured markets in May 2001.
The Greek stock market hit its bottom around March 2003 to rebound again very aggressively
and keep on rising until the eruption of the great financial crisis of 2008, which followed the
collapse of world markets that were initiated with the annihilation of Lehman Brothers in the
USA. The rest is history; the Greek state became insolvent being unable to roll over its
borrowing at maturity, the yield on government bonds went through the roof, the rating agencies
downgraded the country to “junk” status and the so called troika (IMF, ECB and EU) came to
“rescue” by providing the largest loan in human history to a sovereign state, however to no avail.
The rescue efforts failed because the bailout terms stated in the memorandum were so
horrendous and aligned with unheard of austerity measures that forced the Greek economy to the
continued austerity and structural reforms the economy is still suffering from deficiency of
effective demand, due to the fact that the GDP has shrunk by one third over this time period.
Consequently, as long as the Greek economy struggles to come to grips with a public debt to
GDP ratio exceeding 170 percent and worsening through time, there is no chance that its stock
market will revive and the likelihood that the Composite Index of the Athens Stock Exchange
will hover around 1,000 points is more than certain. In light of the developments discussed
previously, it is not surprising that stock prices in the Athens Stock Exchange are characterized
by sharp volatility, as it is generally true for all stock markets worldwide, but in the case of the
Greek market the variability is much more intense and every time the bubble bursts has resulted
in complete wiping out entire households’ fortunes.
As indicated in Figure 1, from 1990 until the beginning of 1997 activity in the Greek stock
market was rather anemic, during which period the General Index of ASE was struggling to
penetrate sustainably the 1,000 points resistance ceiling. However, since that year the stock
market started attracting investors’ interest and the representative index really exploded as a
result, culminating in mid-September of 1999 when the general index reached the all record
height of 6,335 points. That is, in less than two years market activity increased by more than 500
percent. It was precisely during this euphoria period that everyone in Greece got involved in one
way or another with stock investing, they started neglecting most other productive activities and
sold real estate properties, farm-lands and equipment and other real assets in order to get
liquidity to burn out in the stock market inferno.
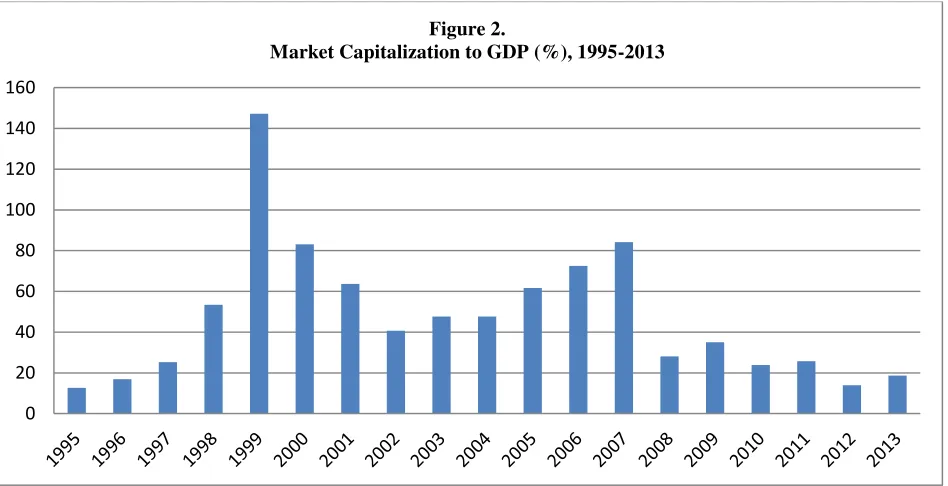
The insanity of the average Greek citizen obsessed with stock investments is illustrated vividly in
Figure 2, in which we present the market-capitalization-to-GDP ratio. The main observation in
that graph is that whereas in the early nineties the market capitalization was always below 20
percent of GDP (in current prices) all of a sudden at the height of the big bubble of 1999 it
climbed to almost 1.5 times the GDP of that year. Following the collapse of the market this ratio
retreated to about 50 percent and after that it climbed to a little over 80 percent just before the
start of the great recession of 2008, to shrink permanently to less than 20 percent during the last
few years.
When the bubble busted with ear-drum destroying sound the most violent wealth redistribution
in Greek economic history took place from the unprotected innocent and ignorant “investors” to
the so called smart money makers. Foreign hedge funds abandoned the cash producing cow
having left just a skeleton from what previously used to be a tireless money making machine.
Thus, it took a little over three years for the market to lose almost everything it had gained, and
by the beginning of 2003 it retreated to about the same level as in the early nineties, which is a
little less than the 1,500 points psychological threshold.
History has a tendency to repeat itself and the stock market is no exception to this rule. The
difference is that this time the big noise-making crowd was completely absent and only the more
sophisticate informed rational participants started considering stock investing as an attractive
alternative to place their excess liquidity. This is why it took the market now four and a half
years to reach its new peak at 5,335 points in October 2007 from the previous trough of March
previously, world developments at the end of 2007 were so dramatically pronounced that led the
global economy into the most severe recession since the times of the Great Depression of the
1930s, but Greece in particular was hit in the hardest way in comparison to the other peripheral
economies within the Eurozone. As a result, the Greek stock market today after almost seven
years of correction still is unable of finding its way out, being stuck with the representative index
at the 1,000 points level.
The narrative of the Greek stock market evolution over the past quarter of a century vividly
suggests that this venue provides an excellent laboratory for testing the small investors’
sentiment hypothesis proposed by behavioral finance scholars. This belief stems from the fact
that the market environment in Greece is more likely to be prone to investor sentiment reaction
in relation to other mature capital markets. Our approach is in line with the one adopted by
Doukas and Mylonas in their study, in which they cite the following reasons for conducting an
out-of-sample test of the sentiment hypothesis in the Greek stock market. Firstly, the Greek
capital market experienced two whole investment cycles during our examination period. The
unprecedented boom and bust, especially during the first cycle, leads us to expect that investor
sentiment should be more pronounced in this kind of stock market environment. Secondly, the
Greek capital market falls by far behind the mature and sophisticated markets of the USA and
most developed West European capital markets. Therefore, we hypothesize that human emotions
should have a greater impact on investment decisions, which implies that “noise” traders play a
crucial role in determining stock prices in this type of financial setting. Thirdly, to the extent
that investing by word of mouth and rumors rather than relying on fundamentals is primarily a
market, in which inexperienced and amateur participants account for a large fraction of total
market activity.
IV. Data and Methodology
A. Data
For the computational needs of our analyses we focus on market aggregates rather than on
individual stock data. Although it is highly probable that sentiment will permeate across all
stocks to the market level, we cannot rule out the possibility that the number of stocks positively
affected by bullish sentiment is roughly the same as those that are negatively affected by bearish
sentiment and thus they negate one another. In any case, our reliance on market aggregates is
primarily imposed by pragmatic considerations stemming from the fact that most of the measures
we examine are available for the entire market and not on a disaggregated level. Our empirical
investigation is conducted using monthly data and most of our indexes span over the time period
from January 1995 through April 2014, resulting in a total of 232 observations. However,
because some variables are not available for the full period part of the analyses is performed on
shorter subintervals, as indicated in the respective tables. Descriptive statistics for the variables
used in the study are presented in Table I. Additionally, in Table II we show contemporaneous
pairwise correlations for these variables. Discussion of these variables and their sources is
presented in the next section.
a. Direct Sentiment Measures
To carry out our empirical investigation we require various measures of investor sentiment.
European Commission conducts regularly harmonized surveys for different sectors of the
economies in the European Union (EU) member states. These surveys are addressed to
representatives of the industry (manufacturing), the services, retail trade, and construction
sectors, as well as to consumers and they are published in their present format on a monthly basis
since 1985. With these data composite indicators are constructed to track cyclical movements in
a specific sector and in the economy as a whole.
We use two of these economic indicators as proxies to gauge investor sentiment for the entire
period of the analyses. The first is the Economic Sentiment Indicator (ESI), which is constructed
as a composite index from the surveys on the five above mentioned sectors.7 We believe that this
overall sentiment measure is more appropriate to use as a proxy for capturing the investment
sentiment of the Greek market. Additionally, we experiment with a narrower version of market
sentiment, i.e., Consumer Confidence Indicator (CCI), in order to test whether the model would
identify it as a separate risk factor. It is noted that the CCI is included in the construction of the
ESI with twenty percent weight and, therefore, these two measures are highly correlated, as
indicated in Table 2.A couple of comments on the qualitative characteristics of these sentiment
measures are warranted. Firstly, the ESI shows considerably less variability than the CCI. The
coefficient of variation of the former is only one fourth of the latter. Secondly, the range of the
ESI is much narrower than the CCI’s. Thirdly, consumer’s confidence in Greece is generally
always disappointingly low in comparison to the confidence for the economy as a whole. This
issue becomes even more pronounced when the comparison is made with regards to the entire
European Union. Specifically, the CCI in the EU for the period under investigation averaged
7
12.2 and ranged between 1.6 and -32.2, whereas in Greece the average was -40.3 and the range
was between -5.8 and -83.8. Lastly, the respective figures for the ESI show an average of 100.0
with range between 67.2 and 116.8 for the EU, whereas in Greece the average was 99.2 and the
index ranged from 74.4 to 118.7.8
b. Indirect Sentiment Measures
In our models we use the Mutual Fund Discount (MFDIS) as the indirect measure of investor
sentiment. Although in the relevant literature findings on the appropriateness of this measure as
an indicator of individual sentiment are not conclusive (see, for example, Lee et all. (1991)), we
nevertheless decided to employ it mainly because it is the only one that we could reliably access.
The overwhelming majority of the Greek closed-end funds have traditionally been subsidiaries of
domestic banks, which hold a majority of share capital and also appoint their management teams.
These funds are required by Greek law to publish their net asset value at the end of each month.
The monthly data on closed-end funds used in our investigation were provided by the
Association of Greek Institutional Investors. Table 1 shows that the deviations of prices from
their NAVs are quite substantial, ranging from a maximum premium of 71 percent to a
maximum discount of 45 percent. However, over the entire period under investigation on the
average these funds experienced a rather large discount of 16.5 percent and quite high standard
deviation of about 20 percent.
Following Lee et all. (1991) and Doukas and Milonas (2004), we constructed a value-weighted index of discount (VWD) for each month as follows:
∑
where:
∑
= Net asset value of each individual MF i at time t
MF i at time t
nt = the number of funds with the available and
c. Economy and Market Variables
In addition to sentiment measures we collected data on some key macroeconomic and stock
market variables. Among the variables employed in the former category we use the Index on
Industrial Production (IPI) as an indicator of economic activity, the Consumer Price Index (CPI)
as a measure of inflation, and the yield on ten-year government bonds as a proxy for the risk-free
nominal interest rate. Data concerning the IPI and the CPI were collected from publications of
the Hellenic Statistical Authority (EL.STAT.), whereas information on sovereign debt rates was
gathered from publications of the Bank of Greece.
Market returns are calculated based on the major indexes used to gauge stock market activity by
the Athens Stock Exchange. Firstly, the ATHEX Composite Share Price Index (Composite)
includes the shares of the 60 largest listed companies in terms of market capitalization. Secondly,
the FTSE/ATHEX 20, which was introduced in September 1997, includes the 20 largest blue
chip companies in the market. Lastly, the FTSE/ATHEX Mid-cap Index (introduced in
trading activity in the medium and small segments category, respectively. It is noted that all
these market indices are value weighted.
B. Methodology
There are two types of sentiment measures; direct and indirect. Investor surveys provide the
direct measure of sentiment of the market. On the other hand, several indirect sentiment proxies
have been used in the extant literature.
Fortunately, for the Greek market confidence index and sentiment index are available. We use
these two sentiment measures along with mutual fund discount rates to investigate the effect of
sentiment on stocks listed in Athens Stock Exchange. Usually, sentiment proxies are highly
correlated. Consequently, researchers employ tools such as Principal Component Analysis (PCA)
in order to construct a single sentiment measure from various sentiment factors. We also find
high correlation among the three sentiment proxies used in the study. Table 2 indicates that the
economic sentiment (ESI) and the consumer confidence (CCI) indexes have correlation of 0.88,
which is very high, implying that we have to construct a unified sentiment index. Even the
mutual fund discount rate (MFDIS) has correlation of 0.44 with the ESI.
Because the correlation between the ESI and the CCI is extremely high we cannot use both of
them in the same regression model. Thus, we also employ (PCA) to make a Unified Sentiment
Indicator (USI) proxy that can be safely used instead of the above-mentioned three sentiment
variables. The PCA shows that the first principal component can account for 49% of the
variation in these three sentiment variables. Moreover, only the first component has an
eigenvalue greater than one. Therefore, we can pick only the first component as a proxy for our
sentiment proxy, which also has a unit variance. Monthly macroeconomic data, such as interest
rates, industrial production growth, and inflation are also used to isolate the effect of market risk.
We run the following regression model:
where: INF, INT and IP indicate monthly inflation, interest rates and industrial production
growth, respectively.
We use several forms of returns. Rt could be Athens Composite Index, FTSE-20, FTSE-Mid-cap
or FTSE-Small-cap.
V. Analysis of Results
Table III presents the regression results for the whole period. There are four dependent variables:
excess returns from all share index, excess returns from FTSE-20, excess returns from FTSE
Mid-cap and excess returns from FTSE Small-cap index. The estimated coefficients of the three
sentiment indicators – Mutual Fund Discount (MFD), Economic Sentiment Indicator (ESI), and
Consumer Confidence Indicator (CCI) – are reported in this table. Coefficients of the two
macroeconomic risk factors – Inflation and Industrial Growth – are not shown, because they are
used as control variables. Three different combinations of sentiment proxies for every dependent
variable have been employed. The fourth combination (where all sentiment indicators could be
used) would result in possible occurrence of near multicolinearity, and thus this model is
excluded from consideration.
For the Composite Index (that is, excess return on Composite Index), the MFD rate and the ESI
significantly affect returns. However, the R2s oftheregressions are very close to zero, signifying
regression model uses a Unified Sentiment Index (USI), which is constructed from all three
sentiment proxies. This USI is found to be significantly related to market returns. Next, similar
regressions are also run for Large-cap, Mid-cap and Small-cap firm returns.
In the case of Large-caps, the coefficients for MFD rates and ESI are significant at the 5% level.
As the coefficient for CCI is significant at 10% level, we can say that it has comparatively weak
influence on the returns of large firms. On the other hand, the relationship between large firm
returns and the USI is found to be significant at the5%level.
For Medium and Small firms, both ESI and CCI indexes exert significant influence. For all the
regressions discussed above, the MFD and the ESI have positive coefficients, whereas the CCI
has negative coefficients. It is noted that this happens because of the manner these indices are
constructed. Higher values of MFD and ESI indicate more favorable market sentiment and
enthusiasm, which drives prices up and ultimately resulting in higher returns. The CCI series, on
the other hand, is always negative and its movement toward zero is considered to be a positive
shift in sentiment. Because the raw data have been converted into percentage changes, a positive
shift in sentiment corresponds to a smaller change in percentage terms. Thus, our results show a
negative relationship between the CSI and stock returns.
The overall conclusion we draw from Table III is that the USI appears to be the most important
factor across all types of sentiment indices considered in the study. The estimated coefficients of
this comprehensive sentiment proxy are not only larger than the coefficients of the rest sentiment
and Small-caps cases where the coefficients besides being the largest, they are also characterized
by greater explanatory power according to the respective R2values.
Because over the entire period of investigation the effect of sentiment on excess returns, albeit
weak, is found significant we examine two sub-periods (1/1997 – 12/2002 and 1/2003 - 4/2012),
in order to test its consistency on stock prices. We consider these two periods in line with the
historical movements of stock prices. As seen in Figure 1, during the first period, the General
Index ascended very rapidly and afterwards it monotonously slumped at an even faster rate. The
same cyclical pattern characterizes the second period, the major difference this time being that
both the upward and downward phases are relatively more prolonged and do not show that much
variability. Our aim is to investigate the existence of a shift in the attitude of stock market
behavior in these two sub-periods, as far as the relationship between sentiment and stock return
is concerned.
In Table IV we present the results for the first complete market cycle, from 1/1997 through
12/2002. We examine the effect of sentiment on excess returns for the Composite and the
Large-cap cases only because the available observations for the other two market indices (Mid-Large-cap and
Small-cap) are not sufficient to warrant reliable conclusions. The general finding conveyed by
this table is that, contrary to our expectations, sentiment does not play any role over this period.
The coefficients of all sentiment indicators are very low and insignificant, with the exception
perhaps of the MFD. Moreover, the R2s are very close to zero indicating that variations in excess
returns are not explained by investors’ mood. This paradox could be attributed to the extreme
number of stocks positively affected by bullish sentiment is roughly the same as those that are
negatively affected by bearish sentiment and thus they cancel each other.
Table V shows the results for the second market cycle, from 1/2003 through 6/2012. The
availability of data over this period allows us to examine sentiment’s influence on excess returns
for all the market indices. As opposed to the first cycle, sentiment over this period exerts a strong
influence on market excess returns. The coefficients of every sentiment proxy are high and
significant for each of the market indicators, with the exception of the Composite Index. This is
especially true with regard to the Unified Sentiment Indicator, for which coefficients are the
highest and by far the most statistically significant. Moreover, the R2 values have improved
considerably in relation to the previous period.
Next we embark on investigating the effect of sentiment over the upswing and downswing
phases of the two distinct market cycles. The regression results of market excess returns on USI
are reported in Table VIII. With regard to the second market cycle the required data are available
and therefore it becomes feasible to carry out full investigation. These results are analytically
shown in Table VI and Table VII, respectively, for the “boom” and “bust” of the latter market
cycle. However, detailed investigation of the individual sentiment proxies and their effect could
not be made for the up and down phases of the first market cycle (period 01/1997 – 12/2000 and
again period 01/2001 – 03/2003) due to lack of sufficient data.
Table VI presents the results for the sub-period from 1/2003 through 6/2007. The most striking
observation here is that many of the coefficients of intercept terms are significant. This indicates
Sentiment Index is the most influential factor. Returns for both large firms and medium firms are
significantly influenced by sentiment. Because the intercept terms for large firms are significant,
apparently returns of these firms increased during this period on their own without any particular
relationship to sentiment. Interestingly, small firms show no sensitivity at all to sentiment factors
during this period.
Table VII presents the regression results for the period from July 2007 through April 2014. The
findings here are somewhat different from those reported in Table VI. The most striking
difference between 1/2003-6/2007 and 7/2007-4/2014 is the change of sign for the intercept
terms. Intercepts indicate that index returns are not explained by sentiment factors. However, the
intercept sign has always been positive in the former period whereas it turns negative in the latter
period. This phenomenon can be explained by the fact that during the first (second) period stock
prices almost always rose (dropped). Sentiment factors only weakly explain excess returns.
Among these factors the Unified Sentiment Index, as previously, has the ability to explain
returns. In this period, sentiment factors, albeit weakly, can explain the return of small firms.
Overall, except for the signs of intercept terms, because the impact of sentiment on returns
during 1/2003-6/2007 and 7/2007-4/2014 is similar, we can also conclude that market reaction to
sentiment remains almost unchanged regardless of the state of the investment cycle.
Table VIII shows how sentiment could possibly be related to market returns (Composite Index
Returns) in two long-run-up-and-down-market periods. The second column exhibits whether a
particular time period corresponds to an upward or a downward market trend. Because, as
already has been shown, the overall sentiment measure performs the best among all proxies we
sentiment exerts significant impact on stock returns only in the second long-run up market
(04/2003 – 12/2007). Therefore, the relation between returns and sentiment in long-run trend (up
or down) is weak.
VI. Conclusion
This paper investigates the influence of market sentiment on the Greek stock market returns. The
results suggest that for the entire period under investigation market sentiment exerts a significant
albeit week effect on stock returns. Among the various size portfolios the effect of sentiment is
more pronounced in the case of mid-caps. For all the different periods that we examine their
regression coefficients have the greatest values. Furthermore, the results do not indicate any
material difference when the whole period is divided into two sub-periods as suggested by the
long-term trend of the market. On the contrary, examination of sentiment’s influence during the
upswings and downswings of the two market cycles conveys that its effect is most pronounced
during the period that preceded the market meltdown in the aftermath of the financial crisis of
2007. As a consequence, the Greek stock market completely collapsed and even today, more
than six years later, it still struggles to find its way to recovery. This development is not
surprising at all, given that the Greek Economy was hit the hardest of all the peripheral Eurozone
countries because of its extreme sovereign debt burden. Finally, our results point to the direction
that a unified sentiment variable probably captures this stock market’s sentiment better than any
other sentiment proxy considered in isolation.
As a peripheral market, the Greek stock market would be expected to exhibit vulnerability to
investor sentiment represents a systematic asset pricing risk in the Greek capital market.
Therefore, in the absence of strong sentiment influence, future studies may look into other
behavior-related trading strategies such as momentum and contrarian to investigate how investor
References
Acemoglou, D., and Scott, A. (1994). “Consumer Confidence and Rational Expectations: Are Agents, Beliefs Consistent with the Theory?”The Economic Journal, Vol. 104, pp. 1-19.
Aitken, B. (1998). “Have Institutional Investors Destabilized Emerging Markets?” Contemporary Economic Policy, Vol. 16, No. 2, pp. 173-184.
Alexakis, C. (2011). “Financial Crisis, Ownership Effect and Investors Sentiment: Empirical Evidence from the Banking Sector in Greece.”European Research Studies, 2011, Vol. XIV, Issue 3. 2011.
Antoniou, C., Doukas, J. A., and Subrahmanyam, A. (2013). “Cognitive dissonance, sentiment and momentum.”
Journal of Financial and Quantitative Analysis, Vol. 48 No. 1, pp. 245–275.
Anusakumar, S., Ali, R. and Wooi, H. C. (2012). “Momentum and investor sentiment: Evidence from Asian stock markets.” The Seventh Annual Conference on Asia-Pacific Financial Markets, South Korea.
Athanasiadis, T. (2010). “Testing the Efficiency of Athens Stock Exchange Market.” Value Invest Magazine, Issue 4, 2010, pp. 6-17.
Baker, M., and Wurgler, J. (2007). “Investor Sentiment in the Stock Market.”Journal of Economic Perspectives, Vol. 21, pp. 129-151.Baker, M., and Wurgler, J. (2006). “Investor sentiment and the cross-section of stock returns”.Journal of Finance, Vol. 55, pp. 2219–2257.
Baker, M., Wurgler, J., and Yuan, Y. (2012). “Global, local, and contagious investor sentiment.” Journal of
Financial Economics, Vol. 104, pp. 272-287.
Barberis, N., Shleifer, S., and Vishy, R. (1998). “A Model of Investor Sentiment.”Journal of Financial Economics, Vol. 49, pp. 307-343.
Beaumont, R., Daele, M, Frijns, B., Lehnert, T., and Muller, A. (2008). “Investor Sentiment, Mutual Fund Flows and its Impact on Returns and Volatility.”Managerial Finance, Vol. 34 No. 11, pp. 772–785.
Bhaskaran, S. (1996). “Time-Varying Expected Small Firm Returns and Closed-End Fund Discounts.” The Review of Financial Studies, Fall 1996, Vol. 9, No. 3, pp. 845-887. Black, F. (1986). “Noise.” Journal of Finance, Vol. 41, No. 3, pp. 529-543.
Bram, J., and S. Ludvigson. (1998). “Does Consumer Confidence Forecast Household Expenditure? A Sentiment Index Horse Race.”FRBNY Policy Review, pp. 59-78.
Brown, G., and Cliff, M. (2004). “Investor Sentiment and the Near-Term Stock Market”. Journal of Empirical Finance, Vol. 11, Elsevier.
Canbas, S., and Kandir, S. (2009). “Investor Sentiment and Stock Returns: Evidence from Turkey.” Emerging
Markets Finance and Trade, August 2009, Vol. 45, No 4, pp. 35-52.
Carroll, C., Fuhrer, F., and Wilcox, D. (1994). “Does Consumer Sentiment Forecast Household Spending? If so, Why?”American Economic Review, Vol. 84, No. 5, pp.1397-1408.
Chowdhury, S., Sharmin, R., and Rahman, A. (2014). “Effect of Sentiment on the Bangladesh Stock Market Returns.” Available at SSRN.
Daniel, K., Hirshleifer, D., and Subrahmanyam, A. (2002). “Investor Psychology and Security Market Under-and-Overeactions.”The Journal of Finance, Vol. 53, (6), pp. 1839-1885.
De Long B., Shleifer, A., Summers, L., and Waldman, R. (1990). “Noise Trader Risk in Financial Markets.” The
Journal of Political Economy, Vol. 98, No. 4, pp. 703-773.
De Long B., Shleifer, A., Summers, L., and Waldman, R. (1991). “The Survival of Noise Traders in Financial Markets.” Journal of Business, Vol. 64, No. 1, pp. 1-19.
Dockery, E., and Kavussanos, M. (1995). “Testing the Efficient Market Hypothesis Using Panel Data, with Applications to the Athens Stock Market.” Applied Economics Letters, 1996, Vol. 3, pp. 121-123.
Doukas, J. A. and Milonas, N. T. (2004). “Investor Sentiment and the Closed-end Fund Puzzle: Out-of-sample Evidence”, European Financial Management, Vol. 10, No. 2, pp. 235-266.
Fama, E., and French, K. (1993). “Common Risk Factors in the Returns on Stocks and Bonds.” Journal of Financial Economics, Vol. 33, pp. 3-56.
Finter, P., Niessen-Ruenzi, A., and Ruenzi, S. (2010). “The impact of investor sentiment on the German stock market.” Working Paper, University of Cologne, Germany.
Garrett, T. A., R. Hernandez-Murillo, and M. T. Owyang. (2005). “Does Consumer Sentiment Predict Regional Consumption?”FRB of St. Louis – Review, Vol. 87, pp. 123-135.
Grigaliuniene, Z., and Cibulskiene, D. (2010). “Investor sentiment effect on stock returns in Scandinavian stock market”.Economics and Management, Vol. 15, pp. 929–940.
161-Kling, G., and Gao, L. (2008). “Chinese Institutional Investor’s Sentiment”. Journal of International Financial
Markets, Institutions and Money, Vol., 18, No. 4, pp. 374-378.
Kumar, A. and Lee, C. M. C. (2006). “Retail Investor Sentiment and return Comovements”. Journal of Finance, Vol.61, pp. 2451-2485.
Lee, C. (2003). “Fusion Investing.” In Equity Valuation in a Global Context. Charlottesville, VA: AIMR.
Lemmon, M., and Portniaguina, E. (2006). “Consumer Confidence and Asset Prices: Some Empirical Evidence”.
The Review of Financial Studies 19, 1499-1529.
Leonard, D., and Shull, D. (1996). “Investor Sentiment and the Closed-End Fund Evidence: Impact of the January Effect.”The Quarterly Review of Economics and Finance, Vol. 36, No. 1, pp. 117-126.
Liston, D. P., Haq, S., and Huerta, D. (2012). “Does investor sentiment risk impact the returns and volatility of Islamic equities?” Working Paper, Prairie View A&M University.
Liu, H. H., Wu, C.C., and Su, Y.K. (2011), “The role of extreme investor sentiment on stock and futures market returns and volatilities in Taiwan.”British Journal of Politics and International Relations, Vol. 11 No. 1, pp. 504–551.
Lucas, R. (1972). “Expectations andthe Neutrality of Money”. Journal of Economic Theory, Vol. 4, pp.103-124. Ludvigson, S. (2004). “Consumer Confidence and Consumer Spending”. Journal of Economic Perspectives, Vol.
18, pp. 29-50.
Muth, J. (1961) “Rational Expectations and the Theory of Price Movements”. Econometrica, Vol. 29 (3), pp. 315-335.
Niarchos, N., and Alexakis, S. (1998. “Stock Market Prices, Causality and Efficiency: Evidence from the Athens Stock Market”. Applied Financial Economics, 1998, Vol. 8, pp. 167-174.
Patra, T., and Poshakwale, S. (2006). “Economic Variables and Stock Market Returns: Evidence from the Athens Stock Exchange”. Applied Financial Economics, 2006, Vol. 16, pp. 993-1005.
Qiu, L., and Welch I. (2006). “Investor Sentiment Measures”. National Bureau of Economic Research, Cambridge, MA. Unpublished Working Paper 10794.]
Rehman, U. M. (2013). “Investor’s sentiment and stock market volatility: An empirical evidence from emerging stock market”. Pakistan Journal of Commerce and Social Sciences, Vol. 7 No. 1, pp. 80–90.
Samuelson, P. (1965). “Proof that Properly Anticipated Prices Fluctuate Randomly”. Industrial Management Review, Vol. 6, pp. 41-50.
Sargent, T., and Wallace, N. (1975). “Rational Expectations, the Optimal Monetary Instrument, ane the Optimal Money Supply Rule”. Journal of Political Economy, Vol., 83 (2), pp. 241-254.
Shefrin, H. (2008). “Risk and Return in Behavioral SDF-Based Asset Pricing Models,” Journal of Investment
Management, Vol. 6, No. 3, (2008).
Shefrin, H., and Statman, M. (1994). “Behavioral Capital Asset Pricing Theory”. The Journal of Financial and Quantitative Analysis, Vol. 29, No. 3, pp. 323-349.
Shleifer, A., and Summers, L. (1990). “The Noise Trader Approach to Finance”. Journal of Economics Perspective, Vol. 4, pp. 19-33.
Shiller, Robert J. (1984). “Stock Prices and Social Dynamics.” Brookings Papers on Economic Activity, 2:457-498. Washington, DC: Brookings Institute.
Shleifer, A., and Vishny, R. (1997). “The Limits of Arbitrage”. The Journal of Finance, Vol. Lii, No.1, March 1997. Schwarz, N. (2002). “Situated Cognition and the Wisdom of Feelings: Cognitive Tuning”. In B. Feldman and P.
Slovey (Eds). The Wisdom of Feeling, New York, Guilford Press, pp. 144-166.
Throop, A. W. (1992). “Consumer Sentiment: Its Causes and Effects”. Federal Reserve Bank of San Francisco Economic Review, Vol. 1, pp. 35-60.
Trueman, B., (1988). “A Theory of Noise Trading in Securities Markets”. Journal of Finance, Vol. 43, No. 1, pp. 83-95.
Zhuang, X. C. L., and Song, D. (2012), “Investor sentiments in the Chinese stock market: An empirical analysis”,
Applied Economics Letters, Vol. 19 No. 4, pp. 345–348.
Demetrios James Gizelis*
Department of Accounting and Finance, School of Business Administration, Prince Mohammad Bin Fahd University, Kingdom of Saudi Arabia, dgizelis@pmu.edu.sa
Shah Saeed Hassan Chowdhury
Department of Accounting and Finance, School of Business Administration, Prince Mohammad Bin Fahd University, Kingdom of Saudi Arabia
Source: ATHEX Fact Book, various annual publications, published by Athens Exchange S.A.
Source: ATHEX Fact Book, various annual publications, published by Athens Exchange S.A.
[image:36.612.74.556.68.296.2]
0 1000 2000 3000 4000 5000 6000 7000
Figure 1.
Movement of General Index, 1990-2014
0 20 40 60 80 100 120 140 160
Figure 2.
[image:36.612.76.550.357.600.2]Table I Summary Statistics
Mean Std. Dev. CV Maximum Minimum Skewness Kurtosis N
RCI 0.1848 9.3013 50.3294 34.5946 -32.6730 -0.2326 1.5218 232
RF20 -0.4841 10.776 -22.2605 40.9006 -34.9378 -0.1476 1.6048 200
RFMID -1.2190 10.4712 -8.5810 27.5898 -33.6893 -0.3048 0.7786 176
RFSMALL -1.3431 11.4337 -8.5130 47.7926 -35.5302 0.2156 3.2996 132
ESI 99.2138 10.9292 0.1102 118.7000 74.4000 0.7067 0.5914 232
CCI -40.2582 17.9445 -0.4457 -5.8000 -83.8000 0.8597 0.0317 232
MFDIS -16.4520 20.0479 -1.2186 71.0377 -45.3442 1.6506 4.4126 208
Table II
Contemporaneous Correlations
CI FTSE20 FTSE-Mid FTSE-Small ESI CCI MFDIS
CI 1.00
FTSE20 0.96 1.00
FTSE-Mid 0.84 0.80 1.00
FTSE-Small 0.58 0.55 0.66 1.00
ESI 0.07 0.08 -0.05 0.06 1.00
CCI 0.06 0.07 -0.02 0.06 0.88 1.00