A Smoothing Filter for Misorientation Mapping Obtained by EBSD
Masayuki Kamaya
*Institute of Nuclear Safety System, Inc., Mikata-gun, Fukui 919-1205, Japan
Electron backscatter diffraction in conjunction with scanning electron microscopy is used to assess local misorientation. However, measurement errors cause the distribution of misorientation to be scattered. To reduce the errors in local misorientation identification and obtain a smooth map, a data processing procedure is proposed. By taking the average of the crystal orientation of surrounding points, the distribution of the local misorientation became smoother and clearer. Moreover, the obtained local misorientation was shown to be valid for quantitatively evaluating the degree of plastic strain induced in Type 316 stainless steel. [doi:10.2320/matertrans.MAW201005]
(Received April 8, 2010; Accepted May 12, 2010; Published August 25, 2010)
Keywords: electron backscatter diffraction, crystal orientation, misorientation, filter, plastic strain
1. Introduction
Electron backscatter diffraction (EBSD) in conjunction with scanning electron microscopy is one of the most promising techniques to measure crystal orientation. By using commercial systems for EBSD measurement, we can identify crystal orientations by scanning the surface of samples. Misorientation between neighboring points is a parameter derived from the measured orientation, and is used to quantify the degree of plastic strain induced in a material.1–5)However, the measurement of crystal orientation has an error of 0.1–1 depending on various factors such as the number of pixels of the CCD camera used to capture EBSD patterns,6)parameters for data processing for
identi-fying the orientation from obtained EBSD patterns and the plastic strain.7–9) The magnitude of the error becomes
relatively large for a small misorientation.10)Therefore, the
misorientation distribution is scattered due to errors when the spatial resolution of the measurements is fine or induced plastic strain is small, and the misorientation map shows a meaningless local variation. For a quantitative evaluation, it is important to reduce the errors and obtain a smooth map.
In this study, a data processing procedure was developed in order to reduce the errors and to exclude the local variation in the misorientation map, then the validity of the proposed procedure for quantifying the plastic strain was examined.
2. Procedure
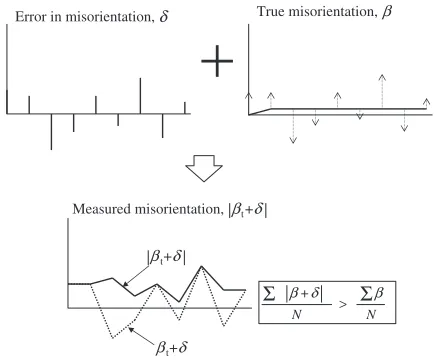
In general, the averaging of several data is an effective way for reducing the local variation due to errors in measurement. However, the averaging of misorientation does not always reduce the errors, even though it may provide a smooth map. Figure 1 schematically shows the influence of errors in crystal orientation measurement on the misorientation iden-tification. Since the magnitude of measurement error is random, the identified misorientation shows a local variation even if the distribution of true misorientation is smooth. The local variation can be suppressed by taking the average of the fluctuating misorientation. However, the magnitude of the averaged misorientation is not always the same as the true
misorientation: if the error in the misorientation is larger than the true misorientation, the averaged misorientation becomes larger than the true misorientation, because the misorienta-tion angle is an absolute value. Even if true misorientamisorienta-tion is zero, averaged misorientation can not be zero no matter how many points are averaged, although the distribution becomes smooth. In particular, to reduce the error in misorientation is important for measurements of high spatial resolution because the misorientation decreases and the error become relatively large.
In order to achieve both smoothing and reduction of errors, in this study, not the misorientation but the measured crystal orientation was averaged. Figure 2 shows a schematic drawing of the averaging procedure. After defining grain boundaries, averages of the crystal orientation of surrounding points are calculated for each point. The number of crystal orientations used for averaging is represented by ROA
(Range Of Averaging). In the case of ROA¼33, an average of nine crystal orientations at surrounding points was calculated and the crystal orientation at the center was replaced with the average. The average of 49 points is calculated in the case of ROA¼77. When we take the average of the misorientation, the distance from the center should be the same because the magnitude of the
misor-Error in misorientation,δ
N N
β+δ β
>
Σ Σ
True misorientation, β
Measured misorientation, |βt+δ |
βt+δ |βt+δ |
Fig. 1 Schematic figure representing influence of error in misorientation identification (N: number of data).
*Corresponding author, E-mail: [email protected]
[image:1.595.317.534.274.455.2]ientation depends on the distance. On the contrary, the distance has minor influence on the averaging in the current procedure and it is possible to take the average of a relatively large number of points from the same area. The averaging is done for the points that exist in the same grain, and a set of quaternion is used for the averaging calculation.11)In this study, this procedure is referred to as the smoothing filter.
3. Results
The observed samples were strained Type 316 austenitic stainless steel, which was deformed by a tensile load. The material had an approximately equiaxial grain structure with an average grain diameter of 50mm. Induced macroscopic plastic strain (hereafter, global plastic strain) was "p¼0%,
4.9%, 10.3% and 15.2%. Details of the procedure of specimen preparation are described elsewhere.6)
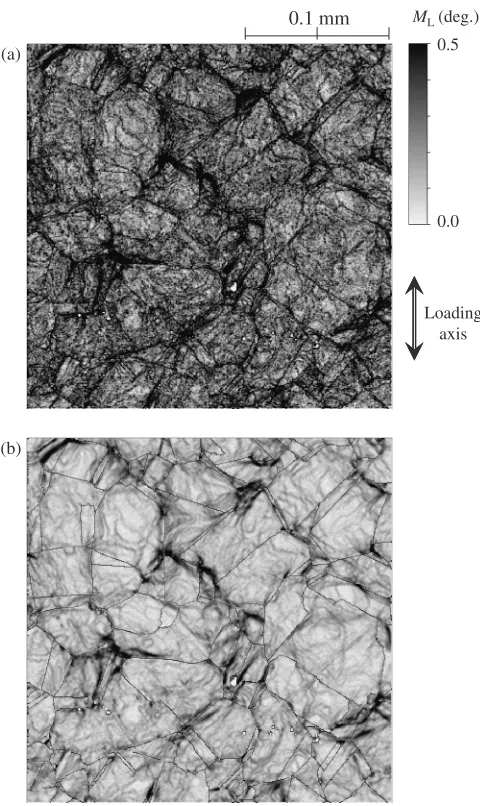
Figure 3 shows the local misorientation, ML, calculated
by the following equation:
MLðpoÞ ¼1 4
X4
i¼1
ðpo;piÞ ð1Þ
whereðpo;piÞdenotes the misorientation between a fixed
point poand neighboring points pi in the grain as shown in
Fig. 4. Misorientations larger than 5were regarded as grain
boundaries. The spacing between measurements (step size) was d ¼0:5mm, and the plastic strain was"p¼4:9%. By
applying the smoothing filter, the local variation in the local misorientation disappeared and the distribution became smooth. Figure 5 shows the change in the local misorienta-tion along a straight line, which crosses grain boundaries. The distribution of misorientations was inhomogeneous and tended to be large near some grain boundaries. Due to the errors in measured crystal orientation, the local misorienta-tion without the smoothing filter was scattered significantly, but was suppressed when the smoothing filter was applied.
Furthermore, the magnitude of the filtered local misorienta-tion was relatively small, which implies that the smoothing filter reduced the error in the crystal orientation. It should be noted that the averaging cuts down peaks in local misor-ientation. Therefore, the spatial resolution of the mapping may deteriorate by the filtering.
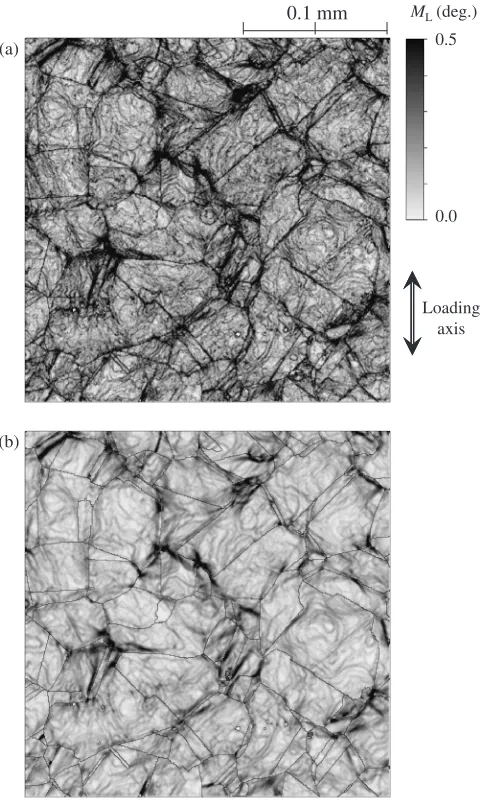
Figure 6 shows the local misorientation obtained under different measurement condition; the number of pixels of the CCD camera for EBSD pattern acquisition was 640480
(hereafter, ‘‘fine pixel’’) whereas it was12896(hereafter, ‘‘coarse pixel’’) in Fig. 3. The fine pixel CCD camera condition makes it possible to measure precise crystal orientation and reduces the local variation in the local misorientation. In spite of such significant difference in the local misorientation map, the maps after applying the smoothing filter showed similar distribution.
In order to assess the effect of the filtering, the average of the local misorientation, Mave, was calculated by the
following equation:
Mave¼exp 1
N
XN
i¼1
lnfMLðpiÞg
" #
ð2Þ Grain boundary
ROA = 3 × 3 ROA = 5 × 5 ROA = 7 × 7
Fig. 2 Averaging crystal orientation for the smoothing filter.
(a)
0.1 mm
0.5
ML(deg.)
Loading 0.0
axis
(b)
[image:2.595.306.546.70.473.2] [image:2.595.62.278.74.318.2]where N is the number of data included in the map. Only grains consisting of more than 10 points were included in the calculation; smaller grains were ignored. The local misor-ientation distribution was well-represented by the log-normal distribution.6) The change in averaged local misorientation withROAis shown in Fig. 7.Mavedecreased by applying the
smoothing filter, due to the reduction of the errors included in the misorientation. The magnitude of Mave was almost the
same under the coarse pixel and the fine pixel conditions when the smoothing filter was applied. Figure 8 shows the local misorientation distributions for larger degree ofROA. A large ROAreduces Mave not only by eliminating errors but
also by cutting down peaks in local misorientation distribu-tion. For a quantitative evaluation, it is important to get the same results from different measurements conditions under the same step size. The agreement ofMavefrom the coarse
pixel and fine pixel conditions implies that the smoothing filter works well to reduce the error and enables us to compare the results from different measurement conditions. By applying smoothing filter ofROA¼33, we can obtain well-converged local misorientations irrespective of the accuracy of crystal orientation measurement.
4. Effect on Quantitative Evaluation
In the previous study,6) it was shown that the averaged local misorientation Mave was correlated with the plastic
strain "p, showing linear correlation at less than"p¼15%.
[image:3.595.114.227.71.183.2]This correlation was evaluated using the filtered data. Figure 9 shows the relationship between "p and Mave for 1.0
1.2
Smoothing filter (ROA: 3 x 3) Original
0.2 0.4 0.6 0.8
0.0
0.0 0.2 0.4 0.6 0.8 1.0
Local misorientation, deg.
Position x/W
Fig. 5 Local misorientation along a line from Fig. 3 (plastic strain: 4.9%, step size 0.5mm).
po p1
p2 p4
p3
(po) =
{
(p ) + (p (p ) + (p )}
L o 1 o 2 o 3 o 4
1
,p ,p ,p
4
M
Grain boundary
,p
β β ) +β β
p1
po
p3 p2 p4
(po)=
{
(p )+ (p )}
L o 2 o 3
1 ,p
2
M β β ,p
Fig. 4 Definition of local misorientation.
0.5
ML(deg.)
0.1 mm
(a)
0.0
Loading axis
(b)
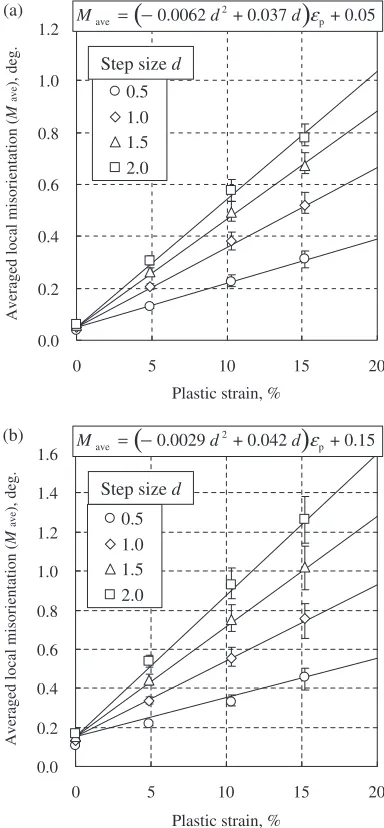
[image:3.595.307.547.73.476.2] [image:3.595.111.227.214.351.2] [image:3.595.56.283.391.648.2]different step size ofd. The averages ofMavefrom four maps,
whose size was250mm250mm, were shown and the error bars denotes the maximum and minimum values. The solid line shows the correlation obtained by a linear regression and expressed by:
Mave¼ ð0:0062d2þ0:037dÞ"p0:05
ðROA¼33Þ ð3Þ
Mave¼ ð0:0029d2þ0:042dÞ"p0:15
ðwithout filteringÞ ð4Þ
where the strain is given in percent and step size in mm.
Mave shows an excellent correlation with the plastic strain
regardless of the filtering. However, the variation of Mave
for each sample is smaller for the filtered data. It is deduced that the error in measurements caused the relatively large variation inMavein the unfiltered data. Agreement ofMaveat
strain of 0% from different step sizes implies that Mave of
unstrained sample does not emanate from residual plastic strain but from inherent fluctuation in crystal orientation and unresolved background error. Since the misorientation can not be less than the magnitude of error, average error in local misorientation identification is less than 0.05, which isMave
of unstrained sample. The magnitude of error was improved from 0.15by the filtering.
0.00 0.05 0.10 0.15 0.20 0.25 0.30 0.35
0
ROA
Averaged local misorientation (
M
ave
), deg.
Coarse pixel Fine pixel
3 × 3 5 × 5 7 × 7 11 × 11
Fig. 7 Change in averaged local misorientation withROA.
0.5
ML(deg.)
0.1 mm
(a)
0.0
Loading axis
(b)
Fig. 8 Local misorientation mapping for deformed stainless steel after the smoothing filter (plastic strain: 4.9%, step size 0.5mm). (a)ROA¼55 (b)ROA¼77
0.0 0.2 0.4 0.6 0.8 1.0 1.2
0 5 10 15 20
Plastic strain, %
Averaged local misorientation (
M
ave
), deg.
0.5 1.0 1.5 2.0 Step size d
(
)
p2
ave = – 0.0062 d + 0.037 d ε + 0.05
M
0.0 0.2 0.4 0.6 0.8 1.0 1.2 1.4 1.6
0 5 10 15 20
Plastic strain, %
Averaged local misorientation (
M
ave
), deg.
0.5 1.0 1.5 2.0 Step size d
(
)
p2
ave = – 0.0029 d + 0.042 d ε + 0.15
M
(a)
(b)
[image:4.595.75.261.74.237.2] [image:4.595.330.522.76.490.2] [image:4.595.48.286.276.681.2]The size of250mm250mmseems to be large enough for representing the local inhomogeneity of the plastic strain if the error in measurement is excluded. By using eqs. (3) and (4), it is possible to quantify the magnitude of local plastic strain.
5. Conclusions
In order to reduce the fluctuation in the local misorienta-tion and to obtain a smooth map, a data processing procedure was proposed. By taking the average of the crystal orientation of surrounding points, the distribution of the local misor-ientation became smooth and clear. Average error in local misorientation identification is suppressed to less than 0.05 by the filtering. Moreover, the obtained local misorientation was shown to be valid for quantitatively evaluating the degree of plastic strain induced in Type 316 stainless steel. The smooth filtering improves the accuracy of estimation of the global plastic strain.
REFERENCES
1) E. M. Lehockey, Y. Lin and O. E. Lepik: A. J. Schwartz, M. Kumar, B. L. Adams (Ed.), Electron Backscatter Diffraction in Materials Science, (Kluwer Academic/Plenum Publishers, New York, 2000) pp. 247–264.
2) J. A. Sutliff: Microscopy and Microanal. Supp2(1999) 236–237. 3) T. M. Angeliu, P. L. Andresen, E. Hall, J. A. Sutliff and S. Sitzman:
Proc. CORROSION/2000, (NACE international, 2000) paper no. 186. 4) M. Kamaya, A. J. Wilkinson and J. M. Titchmarsh: Nucl. Eng. Design
235(2005) 713–725.
5) M. Kamaya, A. J. Wilkinson and J. M. Titchmarsh: Acta Mater.54 (2006) 539–548.
6) M. Kamaya: Mater. Charact.60(2009) 125–132.
7) A. J. Wilkinson and D. J. Dingley: Acta Metal Mater.39(1991) 3047– 3055.
8) D. J. Prior: J. Microscopy195(1999) 217–225.
9) F. J. Humphreys, P. S. Bate and P. J. Hurley: J. Microscopy201(2001) 50–58.