Effect of Different Preservative Methods on Fracture Behavior
of Bovine Cortical Bone
*1Masahiro Kuninori
1;*2, Hisao Kikugawa
2, Takashi Asaka
3and Hirakazu Kasuya
41
Department of Mechanical Engineering, Graduate School of Engineering, Tokai University Graduate School, Hiratsuka 259-1292, Japan
2Department of Network and Computer Engineering, School of Information and Design Engineering,
Tokai University, Tokyo 151-0063, Japan
3Department of Applied Chemistry, School of Engineering, Tokai University, Hiratsuka 259-1292, Japan 4Department of Prime Mover Engineering, School of Engineering, Tokai University, Hiratsuka 259-1292, Japan
Bone specimens used for evaluating the mechanical properties of bone may not have been necessarily preserved by the same method before they become available. To this end, the mechanical properties of bone may be affected by freezing, a common preservation method, as well as by formalin and other preservation solutions. In this study, bone specimens were preserved by different methods (i.e., freezing, preservation in saline, preservation in ethanol, and preservation in formalin) to examine the effects of each preservation method on the fracture characteristics of bovine femoral cortical bone. Regarding the crack extension behavior in the fracture toughness test, microcracks accumulated at the top of the slit in the low-load region before the maximum load was reached. When such accumulated microcracks grew to a visible size, a crack was formed from the top of the slit, and then grew with subsequent expansion of the processing zone. The fracture toughness values of the bone groups preserved in formalin and neutral buffered formalin were significantly lower than those of the bone groups preserved by other methods. As the fracture surface by scanning electron microscopic observations was smoother with a loading rate of 20 mm/min than with 1 mm/min, cracks were considered to develop easily, resulting in a lower fracture toughness value. Scanning electron microscopic observations of a test section subjected to a low loading rate showed that the fracture surface of the bone groups preserved in formalin or neutral buffered formalin was flat and smooth. In the other preservation groups, the lamellae adjacent to the top of the slit had undulating contours with plastic deformation. [doi:10.2320/matertrans.MRA2008375]
(Received October 14, 2008; Accepted November 11, 2008; Published December 25, 2008)
Keywords: cortical bone, fracture toughness, preservation method, freezing, physiological saline solution, ethanol, formalin, microcrack
1. Introduction
In recent years, there has been an increasing need for countermeasures to different bone diseases caused by aging. In fact, a large part of the living bone lost through operations or traffic accidents is generally replaced by an artificial bone. However, some clinical problems have been encountered with increasing frequency in the use of an artificial bone. For example, mismatch in mechanical properties at the interface between the living bone around the prosthetic section and the artificial bone causes loosening. Furthermore, mismatch in mechanical properties between the living body and the artificial bone has also become a problem. These clinical drawbacks are due to the fact that the dynamic property data of the living bone are not fully reflected on the design of an artificial material. It is essential to quantitatively recognize the mechanical properties of bone as well as promote the advancement of mechanical analysis of the musculoskeletal system, including the finite element method to improve the safety of aircraft/automobile passengers.
Remodeling or bone restructuring, occurs continually in living bone tissue in which worn-out sections are replaced by new bones, particularly by osteocytes. It is common knowl-edge that a microcrack is sometimes formed in bone to the extent that does not end in bone fracture within the physiological movement range such as during walking in daily life or playing sports.1) Also, there is a substantial
number of micropore measuring roughly 100mm or less within the cortical bone, including blood vessels or bone cavities. Such a micropore or microcrack is thought to be the origin of fracture or serves as the rate-limiting factor in remodeling,2) presumably having an effect on fracture extension behavior or fracture toughness values. The fracture mechanics method is also necessary for evaluating the mechanical properties of bone.
There have been some studies on the fracture toughness of bone over the years as it can be regarded as a measure of brittleness.3)Fracture toughness value particularly increases and decreases with changes of the crack-tip stress state due to differences in the radius of the top of a fatigue crack or slit introduced into each test specimen or the thickness of the test specimen plate. Thus, although it is difficult to simply compare fracture toughness values reported from respective research institutes, a certain amount of data on it has been obtained.4–9) However, the actual bone specimens used for evaluating fracture toughness may not have been necessarily preserved using routine procedures before they become available or when they are machined into a test section. In addition, since microscopic damage to bone is often evaluated from the fracture surface of a test specimen following testing, there are still many unclear points regard-ing the behavior of damage extension.
Saline (0.9 mass% aqueous NaCl solution) was used exhaustively during the processing of bone specimens, starting from the short-term preservation period up to the implementation of mechanics testing and others, as it has the same osmotic pressure as that of the living body but without an antiseptic effect. Some fatigue testings that take a longer
*1This Paper was Originally Published in Japanese in J. Japan Inst. Metals 72(2008) 679–685.
*2Graduate Student, Tokai University
time are performed in a wet environment with saline to prevent the drying out of a test specimen. Nevertheless, certain data suggests that long-time infiltration of bone with saline results in an increase in bone stiffness, although the increase is not significant.10)The authors have confirmed that several times as many inorganic components contained in cortical bone eluted into the preservation solution when saline was used as the preservative compared with formalin; however, the effects of these components on the mechanical properties of bone remains to be clarified. In addition to freezing, which is a commonly used bone preservation method, tissue fixation using alcohol and chemical agents such as formalin is performed in cases where prevention of pathogen-induced infection cannot be ensured in order to detoxify the bone specimen. In particular, formalin has long been employed for preserving the human cadaver for anatomy studies. Although tissue fixation using these chemi-cal agents incurs lower cost for preservation than that by freezing, many points remain unclear regarding its effect on the mechanical properties of bone or tissue. Studies have been carried out to address these issues; however, there is only 1 report on formalin preservation at present from a research group of the authors11,12)and 1 study on alcohol and saline preservation conducted by Lucksanasombool et al.13) Moreover, there have been few investigations on the effects of preservation using a unified test method.
In this study, research was performed to determine the effects of a preservation method on the fracture character-istics of bovine femoral cortical bone using a unified test method in the case where a test specimen is preserved using following preservation methods, namely, freezing, preserva-tion in saline, preservapreserva-tion in ethanol, and preservapreserva-tion in formalin and neutral buffered formalin for 30 days at room temperature. Specifically, the relationship between the behavior of microscopic damage formed at the top of the slit and fracture toughness values was discussed and examined.
2. Experimental Method
2.1 Preparation and preservation of fracture toughness test specimen
About 24-month-old beef bovine femur, which shows similar static tension and compression properties to those of human cortical bone, was used for evaluating the fracture toughness of bone. Bones were purchased immediately after slaughter/extraction. As shown in Fig. 1, a fracture tough-ness test specimen was prepared from the plexiform bone found in the anterior part of the central diaphysis in such a way that its long direction was parallel to the long axis of the bone under a wet condition while adding saline by drops to prevent temperature increases due to machining. The test specimen under machining was sealed up in a plastic storage container containing saline solution, with air exhaustively bled from the specimen that is to be frozen at30C; in the
thawing process, the specimen was restored to room temper-ature by placing the storage container under running water. The period from procurement up to the completion of the test specimen was set within 5 days from the time of purchasing the bone specimen. The plexiform bone used for the
preparation of a test specimen assumes a composite layer structure composed of elastic type I collagen and flat sections composed of hard, brittle hydroxyapatite, with bone tissue forming a structure of alternating presence of nonlamellar bone and lamellar bone including blood vessels, as shown in Fig. 2. Concerning the three-point bending tests for the accurate determination of fracture toughness of brittle materials such as bone, no specifications regarding the size of a test specimen are established at present; there are also few reports on the effects of test specimen configuration, loading rate or related parameters on fracture toughness values. Kobayashi et al.14,15) have performed fracture toughness evaluation of ceramics (test specimen width: W ¼8mm) and indicated that fracture toughness values increase with a plate thickness of B¼4mm or below and with increasing radius of the notch tip, where the process zone tends to also increase. Regarding cortical bone, American Society for Testing and Materials (ASTM)-com-pliant research was conducted by Niinomi et al.4) using a specimen with W ¼8mm. They accordingly reported that the fracture toughness values of a test specimen with a slit introduced in the circumferential direction increase with a plate thickness of B¼0:5mm of below. A test specimen introduced with a radius at the top of the slit of 0.08 mm or below showed increased fracture toughness values with an increase in the radius of the slit tip.5) A similar trend has been observed regarding the effects of the plate thickness of a test specimen or the radius of the slit tip in the fracture toughness evaluation of cortical bone compared with that of ceramics.
All specimens used in the fracture toughness test were prepared to conform as much as possible to ASTM E399-90.16) The dimensions of a test specimen were as follows: W (width) = 8 mm,L(length) = 40 mm andB(plate thick-ness) = 4 mm, as shown in Fig. 3. A slit was introduced using a metal saw with a width of 1.2 mm, a point angle of 30 and a radius of the slit tip of 0.05 mm in an attempt to havea=W ¼0:5(a¼4mm) in the circumferential direction
Anterior (Front) Posterior
(Back)
Medial Lateral
100mm
Long axis of bone
[image:2.595.321.532.74.286.2](in the direction of the arrow shown in Fig. 2) in the cross section of bone. Subsequently, wet sanding was carried out using emery paper up to #2000 grit immediately prior to the fracture toughness test in an effort to smoothen the top surface of the test specimen. Since the stable introduction of a fatigue precrack, which is provided in ASTM E399-90,16)is difficult, no precrack was introduced in this study. It is a fact that the mechanical properties of bone may vary according to
the preservation conditions in the entire preparation process from specimen procurement to machining, up to the completion of a test specimen; thus, a control group composed of 10 pieces was prepared in addition to each preservation group. The fracture toughness test was per-formed on the control group immediately after the comple-tion of the test specimens.
Four types of preservation solution, namely, 80 vol% ethanol solution (hereinafter referred to as ethanol), formal-in,11)neutral buffered formalin12)and saline, were employed for the preservation of a test specimen. Following prepara-tion, a specimen was subjected to ultrasonic cleaning in each preservation solution for 1 minute. Then, the specimens were immersed in each 0.2 dm3of preservation solution and sealed
by 10 pieces for preservation in the dark at room temperature (20C) for 30 days. A test specimen of the freezing group was
sealed in the above-mentioned storage container in a manner so as to prevent its freeze-drying, and then preserved at 30C for 30 days. Mass change of the test specimen due to
freezing was not observed after being thawed.
These preservation groups were subjected to fracture toughness tests following preservation for a specified period for a comparative study with the control group. The preservation solutions used other than that made of ethanol were subjected to chemical analysis.
200
µ
m
Nonlamellar bone
Lamellar bone
Vascular canal
Introducing direction of initial crack tip
Fig. 2 Photomicrograph of polished section perpendicular to the long axis of bone.
S = 32 B = 4
P
W = 8 a = 4
1.2 30°
L = 40
[image:3.595.112.485.71.409.2] [image:3.595.61.277.489.635.2]2.2 Three-point bending tests for the accurate determi-nation of fracture toughness
Three-point bending tests for the accurate determination of fracture toughness were performed in accordance with ASTM E399-9016) to the maximum extent possible. An Instron type material testing machine (load capacity: 1 kN) was used for the fracture toughness test, and the specimens were loaded until fracture formation at loading rates of
1 mm/min and 20 mm/min, with a support span of S¼
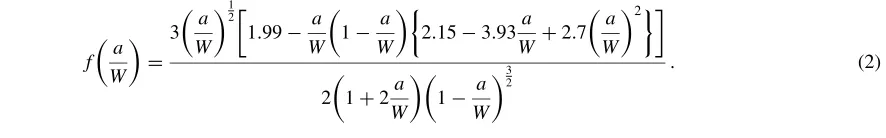
32mm. Fracture toughness, KQ, was calculated using following equation:
KQ¼ PQS
BW32 f a
W ; ð1Þ
wherefða=WÞis a correction term, which can be given by the following equation:
f a
W ¼
3 a
W 1
2
1:99 a W
1 a
W
2:153:93a
W þ2:7 a
W
2
2
1þ2a
W
1 a W
3 2
: ð2Þ
As it can hardly be said that the fracture toughness values obtained in this test satisfy the requirements of ASTM E399,16)they are thus expressed asK
Qhereafter.
2.3 Analysis of preservation solution and observation of fracture surface tissue
Bone is composed of collagen fibers as organic compo-nent; phosphorus (P) and calcium (Ca), which compose hydroxyapatite, as inorganic components including magne-sium (Mg), which is involved in bone metabolism; and natrium or potassium electrolyte components, which con-stitute biological fluid, as well as other constituents. Thus far, the authors have demonstrated that the inorganic components of bone eluted into the preservation solution. Based on this factor and as with previous reports,11,17) analysis was performed in this study on 3 elements, namely, P, Ca and Mg, which were the elements mainly eluted, using an inductively coupled plasma-atomic emission spectro-photometer (hereinafter referred to as ICP).
The fracture behavior of the bone during the test was filmed with a high-speed camera, and the test specimen after fracture was air-dried. Then, observation of fracture surface tissue was performed under a low-vacuum scanning electron microscope (hereinafter referred to as SEM).
2.4 Statistical test
Tests to compare differences in the mean value between 2 groups (control group and each preservation group with loading rates of 1 mm/min and 20 mm/min), were performed by the following procedures. The variance equality test was initially carried out using the F test. In the case where the result of this test ended up with an equal variance, the result of the Studentt test was adopted; if otherwise, the result of the Welch’sttest was used. The risk rate was 5%.
3. Results and Discussion
3.1 Load-displacement relationship and fracture behav-ior
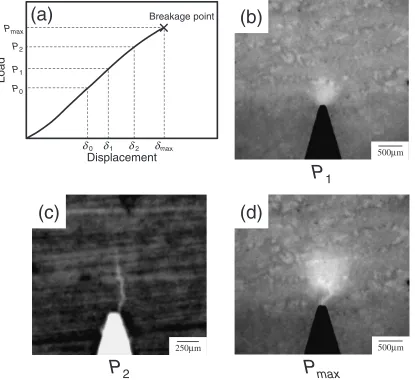
A typical load-displacement curve at a loading rate of 1 mm/min and the results of filming the area adjacent to the crack tip until fracture are shown in Fig. 4. The load-displacement relationship showed a trend of downward convexity in the low-load region, a linear curve in the
intermediate region and upward convexity in the high-load region, with no observed extreme difference due to the preservation method used. Furthermore, crack initiation was found with its origin at the crack tip in the load region of the maximum load Pmax at the final breakage point and below. Our observations can be summarized as follows: a high-intensity area (apparently the white area) at the top of the slit, which is regarded as a damaged area, grew to a visible size with increasing load from the loadP0(Fig. 4(b)), and then a
crack was formed from the top of the slit (Fig. 4(c)) and thereafter grew followed by the subsequent expansion of the white area (Fig. 4(d)), resulting in fracture formation. Figure 4(c) shows an observation result of another test specimen with the surface applied with India ink in an attempt to show a typical example as clear confirmation of the crack developed on the specimen surface.
Tanabe et al.2)performed the fracture toughness test on cortical bone using a compact tension (CT) specimen, and suggested that the so-called process zone, the development of which is based on microcracking, is formed and expands prior to the growth of a major crack. Moreover, several studies have reported on the microcrack of bone.18–21)Also, Vashishth et al.22)suggested the development of a fracture process zone wake estimated from distinctive increase and decrease in crack growth rate and crack growth amount, and thereby proposing models for explaining such damage behavior. The white area (Figs. 4(b) and 4(d)) developed in this test can be inferred as a damaged area that includes a microcrack of bone tissue or the fracture process zone. From another viewpoint, it can also be assumed that this study experimentally reviewed the model proposed by Vashishth
et al.
Furthermore, the test result at a loading rate of 20 mm/min showed the same trend as that at a loading rate of 1 mm/min; however, the load-displacement relationship with a stronger linear trend can be obtained with increasing loading rate. Therefore, the crack shown in Fig. 4(d) in this case moved toward a trend with its initiation occurring just before the breakage point.KQvalue was calculated using equation (1) withPQ¼Pmax.
[image:4.595.108.551.182.251.2]vertical scale was calculated by dividing the difference between the meanKQvalues of the preservation and control groups by the mean KQ value of the control group. A significant difference test was performed using the meanKQ values of the control and preservation groups, as described in Section 2.4. In the group where formalin and neutral buffered formalin were used as preservatives, KQ values showed a
significant decrease by 8–18% compared with the control group. The possible cause of this decrease is lowering ofKQ values caused by the stiffness of collagen fibers in bone due to formaldehyde.11,12) On the other hand, no significant difference in KQvalues was observed between each preser-vation group (freezing, saline and ethanol) and the control group.
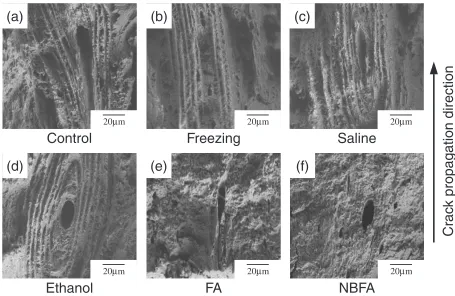
Figure 6 shows SEM observations of the lamellar struc-tures adjacent to the top of a slit for each preservation group; the respective preservation groups of freezing, saline and ethanol assumed a fracture surface where adjacent lamellae had undulating contours similar to those of the control group. Such a fracture surface with asperities can be presumed to be formed by the bridging effect23–25)of collagen fibers, which inhibits crack extension. In contrast, the fracture surface of the preservation group of formalin or neutral buffered formalin was smooth. It is speculated that the development of such a smooth fracture surface may be attributed to the inhibition of the viscoelastic effect due to the denaturation of collagen fibers with formaldehyde and the resultant loss of the inherent crack bridging effect. In addition, a trend was shown for this phenomenon to be more remarkable with increasing loading rate.
From the above results, the evaluation of KQ values revealed that the impact of preservation on fracture toughness
(a)
500µm
250µm 500µm
P
1
P
2
P
max
(d)
(c)
(b)
Displacement
Load
0 1 2 max P0
P1
P2
Pmax
Breakage point
δ δ δ δ
Fig. 4 Typical load-displacement curve and typical prefailure damage near the initial crack tip before breakage point.
-20 -10 0 10 20
Preservative method
P
e
rcentage of a
v
er
age
diff
erence f
or control (%)
FreezingSaline Ethanol FA NBFA 1mm/min
20mm/min
*** *** ** *
* p < 0.05
**p < 0.01
***p < 0.001
[image:5.595.96.511.74.454.2] [image:5.595.57.284.501.661.2]of bone can be minimized to a higher level with the use of saline, ethanol or freezing as preservatives than with the use of formalin or neutral buffered formalin in terms of preservation for about 30 days. However, the microdamage behavior of bone shown in Section 3.1 remains unknown because very few studies on this behavior were conducted in the past. Given this situation, evaluation results are shown below those of the control group, thus permitting the evaluation of a certain number of microdamage in the preservation groups using saline and ethanol as preservatives through the images filmed with a high-speed camera.
Figure 7 shows the ratio between the load on microdamage development (P0) for each preservation group and the
maximum load (Pmax). There was no significant difference
inP0between the control group and each preservation group;
however, a decrease inP0at a higher loading rate of 20 mm/
min was observed. Taken together, the tests confirmed that microdamage was developed from the top of the slit under a relatively low load of about 50% or below of the fracture load.
It has been found that microcrack initiation in the area adjacent5) to the top of the slit induced stress relaxation, resulting in an increase in fracture toughness values, and that the cumulative number of cracks and fracture toughness values increase with crack extension; a previous report indicated that these findings show a positive correlation between them.18) Accordingly, an evaluation of N, which indicates the degree of development of the damaged area in the process from initiation of a damaged area up to fracture formation, was conducted as shown below using the follow-ing equation:
N¼ rmax max0
; ð3Þ
where rmax and max are the dimensions and displacement amount of the microdamage area at the breakage point, respectively;0 is the displacement amount at the initiation
of microdamage.
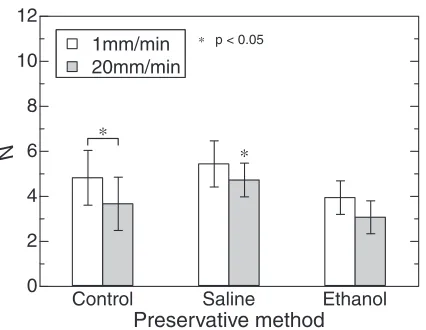
As can be seen in Fig. 8,N showed higher values in the preservation group of saline than in the control group, but lower values in the preservation group of ethanol. Moreover, N was lower at a higher loading rate of 20 mm/min than at 1 mm/min for all preservation groups. Here, it can be considered that the calculated N is proportional to the microcrack increment per unit displacement amount. How-ever, no appreciable nonlinear variation was found with the
Cr
ac
k propagation direction
20µm
(a)
20µm
(b)
20µm
(c)
20µm
(d)
20µm
(e)
20µm
(f)
Saline
Control
Freezing
Ethanol
FA
NBFA
Fig. 6 SEM images of the facture surface near the initial crack tip in bones subjected to different preservative methods.
*
0 0.2 0.4 0.6 0.8 1.0
1mm/min 20mm/min
Control Saline
P0
/
Pmax
Preservative method
Ethanol * p < 0.05
*
[image:6.595.68.523.70.366.2] [image:6.595.65.276.401.565.2]load-displacement curve within a range of loading rate applied in this test, suggesting that the changes inNshown in Fig. 8 have slight effects onKQvalues.
Preservation in saline is believed to show more effects in causing element elution from hydroxyapatite and the in-organic component of bone than in inducing effects on collagen fibers, which have a denaturation temperature of about 60C.26)Table 1 shows the result of the analysis using ICP with regard to the elution amount of inorganic elements (P, Ca and Mg) into preservation solutions in accordance with a previous report.12) In the case of the preservation solution of neutral buffered formalin, a large quantity of Na2HPO4 or NaH2PO4 was added in advance as pH buffer,
and no analytical result for P is shown here. On the other hand, the results demonstrated that larger amounts of inorganic components elute into the preservation solution of saline than into that of formalin, with the concentration of P in the saline solution reaching about 4 times that in the formalin solution, and with the concentration of Ca reaching about 48 times and that of Mg reaching about 32 times that of their respective counterparts in the formalin solution. Given this factor, the reason for the significant increase inN in the preservation group of saline compared with the control group can be speculated from the analysis results that a microscopic cavity, as observed in the patient with osteoporosis, is formed in bone due to inorganic element elution, causing some effects on microcrack development behavior. We are presently clarifying the cause of the elution of larger amounts of inorganic components from bone into the preservation solution of saline than into that of formalin, which is considered to have a decalcification action.
In contrast, preservation in ethanol is considered to have a dehydrating effect on fluid elements contained in bone.
Lucksanasombool et al.13) conducted research on cortical bone preservation in alcohol and saline for a short period and showed that the fracture toughness values of cortical bone were 25–45% higher when preserved in alcohol than in saline. In addition, it was concluded that the effect of alcohol can be eliminated by preservation in saline. Nonetheless, the authors speculated that ethanol dehydrates not only bone tissue but also water retained in collagen fibers, decreasing viscoelasticity and inhibiting the bridging effect, resulting in a decrease in fracture toughness values.
Therefore, in the present study, an evaluation was made concerning the fracture toughness of cortical bone preserved in ethanol and saline under the same conditions as those applied by Lucksanasombool et al.13) (i.e., preserving temperature: 37C; loading rate: 15 mm/min) using the
specimen shown in Fig. 3. The results of our study are shown in Fig. 9 including that of the control group. We used and evaluated 3 preservation groups: the group preserved in ethanol for 7 days; that preserved in saline for 7 days; and that preserved in ethanol for 7 days and then in saline for 7 days. Nshowed a significant decrease in the preservation groups of ethanol and saline compared with the control group. However, theKQvalues of the respective preservation groups showed no significant change when compared with those of the control group, and no elimination of the dehydrating effect of ethanol by saline was observed. Nevertheless, since the number of specimens tested for each group in the present study was small (as few as 5 pieces), further examination of other factors affecting the mechanical properties of bones, such as test conditions, is needed in the future.
4. Conclusion
In the present study, the effects of preservation for 30 days under different environments (i.e., freezing, saline, ethanol, and formalin) on the fracture toughness of bovine femoral cortical bone were examined. Our major findings are as follows:
(1) Observation of the crack extension behavior in the area adjacent to the top of the slit demonstrated that microdamage develops at the top of the slit in the low-load region prior to crack extension. When the damaged area grew with increas-ing load, a crack was formed from the top of the slit, and then
*
0 2 4 6 8 10 12
Control Saline 1mm/min
20mm/min
N
Preservative method
Ethanol *
* p < 0.05
[image:7.595.65.278.71.236.2]Fig. 8 Comparison ofNunder different preservative methods.
Table 1 Eluted mineral concentrations in preservative solutions of physiological saline, formalin and neutral buffered formalin.
Preservative solution Mineral concentration,C/mmoldm
3
P Ca Mg
Physiological saline solution 1.78 4.27 1.62 Formalin 0.41 0.09 0.05 Natural buffered formalin — 0.09 0.12
0 2 4 6 8 10 12
0 2 4 6 8 10 12
Preservative temperature 37°C Cross head speed 15mm/min
n = 5
N ; KQ
Saline
N
Ethanol Ethanol -Saline Control
* p < 0.05
***p < 0.001
*** *
F
racture toughness
,
KQ
/ MP
a
·
m
1/2
Preservative method
[image:7.595.314.539.75.235.2] [image:7.595.45.291.306.372.2]the crack grew followed by the subsequent expansion of the damaged area, resulting in fracture of the entire test specimen.
(2) No appreciable change inKQvalues was observed for the preservation groups of freezing, saline and ethanol. On the other hand,KQvalues of the preservation groups of formalin and neutral buffered formalin showed a significant decrease. (3) SEM observations revealed that plastic deformation was produced, where adjacent lamellae showed rough asperities in the area adjacent to the top of the slit similar to the control group for the preservation groups of freezing, saline and ethanol at a loading rate of 1 mm/min. On the other hand, the bone fracture surface of the preservation groups of formalin and neutral buffered formalin was smooth. This smooth characteristic was speculated to result from the inhibition of the viscoelastic effect due to collagen fiber denaturation by formaldehyde and the resultant loss of the inherent bridging effect.
(4) Microdamage at the top of the slit was developed with a relatively low load of about 50% of the fracture load for both preservation groups of saline and ethanol. N, which indicates the degree of development of a damaged area, showed a significantly higher value in the preservation group of saline than in the control group, but a lower value in the preservation group of ethanol. Moreover, it was shown that at a loading rate of 20 mm/min,Nshowed lower values than at a loading rate of 1 mm/min for all preservation groups. However, regarding the range of the loading rate applied in this test, no appreciable effects of the change in N on KQ values were observed.
In this report, a qualitative evaluation was made on the development behavior of microdamage developed at the top of the slit made in the test specimen, with the period required from microdamage initiation to the formation of a complete fracture regarded as the series of changing process. However, it is considered that the development of a crack and its propagation in the process of bone fracture formation dynamically vary in relation to bone tissue. We are presently conducting an analysis of strain distribution using image correlation techniques as a quantitative method for
evaluat-ing damage with consideration to bone microstructure usevaluat-ing an image filmed with a high-speed camera.
REFERENCES
1) Y. Tanabe and W. Bonfield: JSME Int. J. C42(1999) 532–538. 2) Y. Tanabe, W. Bonfield and K. E. Tanner: J. Jpn. Soc. Clin. Biomech.
Relat. Res.17(1996) 337–341. 3) Y. Tanabe: J. JSNDI49(2000) 425–429.
4) M. Niinomi, N. Watanabe, M. Kitaide, H. Fukui and J. Hasegawa: Trans. Jpn. Soc. Mech. Eng. A64(1998) 312–318.
5) M. Niinomi, T. Akahori, J. H. Kim, H. Tajima and T. Kodama: Trans. Jpn. Soc. Mech. Eng. A69(2003) 1641–1648.
6) J. H. Kim, M. Niinomi and T. Akahori: Tras. Jpn. Soc. Mech. Eng. A71
(2005) 486–493.
7) J. Yan, K. B. Clifton, J. J. Mecholsky Jr. and R. L. Reep: J. Biomech.39
(2006) 1066–1074.
8) J. Yan, K. B. Clifton, J. J. Mecholsky Jr. and L. A. Gower: J. Biomech.
40(2007) 1641–1645.
9) J. Yan, J. J. Mecholsky Jr. and K. B. Clifton: Bone40(2007) 479–484. 10) J. D. Currey, K. Brear, P. Zioupos and G. C. Reilly: Biomaterials16
(1995) 1267–1271.
11) T. Asaka and H. Kikugawa: Mater. Trans.48(2007) 16–20. 12) H. Kikugawa, T. Asaka and M. Miyake: Mater. Trans.48(2007) 1417–
1421.
13) P. Lucksanasombool, W. A. J. Higgs, R. J. E. D. Higgs and M. V. Swain: Biomaterials22(2001) 3127–3132.
14) T. Kobayashi, K. Matsunuma, H. Ikawa and K. Motoyoshi: J. Japan Inst. Metals51(1987) 723–729.
15) T. Kobayashi, H. Asai, S. Yamauchi and M. Miyake: J. Japan Inst. Metals54(1990) 1214–1221.
16) ASTM E399-90 (Reapproved 97).
17) T. Asaka, H. Kikugawa, M. Higuchi, Y. Azuma and K. Katayama: J. Soc. Inorg. Mater. Jpn.15(2008) 27–31.
18) D. Vashishth, J. C. Behiri and W. Bonfield: J. Biomech.30(1997) 763–769.
19) P. Zioupos and J. D. Currey: J. Mater. Sci.29(1994) 978–986. 20) G. C. Reilly and J. D. Currey: J. Exp. Biol.202(1999) 543–552. 21) G. C. Reilly: J. Biomech.33(2000) 1131–1134.
22) D. Vashishth, K. E. Tanner and W. Bonfield: J. Biomech.33(2000) 1169–1174.
23) R. K. Nalla, J. H. Kinney and R. O. Ritchie: Nature Mater.2(2003) 164–168.
24) R. K. Nalla, J. J. Kruzic and R. O. Ritchie: Bone34(2004) 790–798. 25) R. K. Nalla, J. J. Kruzic, J. H. Kinney and R. O. Ritchie: Biomaterials
26(2005) 217–231.